
Monero Price Forecast: XMR eyes $500 as derivatives markets show bullish bias
- Monero price trades in green on Thursday after finding support around the key level earlier this week.
- Derivatives data support a bullish bias, as open interest is rising, funding rates are positive, and large whale orders.
- The technical outlook suggests rally continuation targeting levels above $500.
Monero (XMR) price trades above $444 on Thursday after rebounding from key support earlier this week. Bullish momentum is strengthening, as derivatives metrics for XMR show rising Open Interest (OI), a positive funding rate, and large whale orders. On the technical side, the privacy-focused coins suggest rally continuation, targeting levels above $500.
Monero’s derivatives traders are positioning for a rally
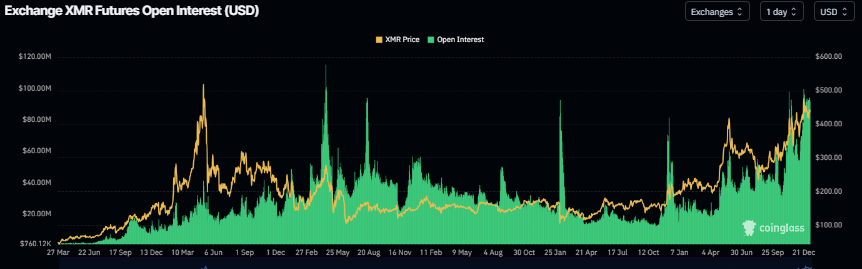
Monero’s derivatives metrics show a bullish bias. CoinGlass’s data show that XMR futures OI at exchanges rose to $92 million on Thursday, up from $82 million on December 27, and has since remained steady. Rising OI represents new or additional money entering the market and new buying, which could fuel the current XMR price rally.
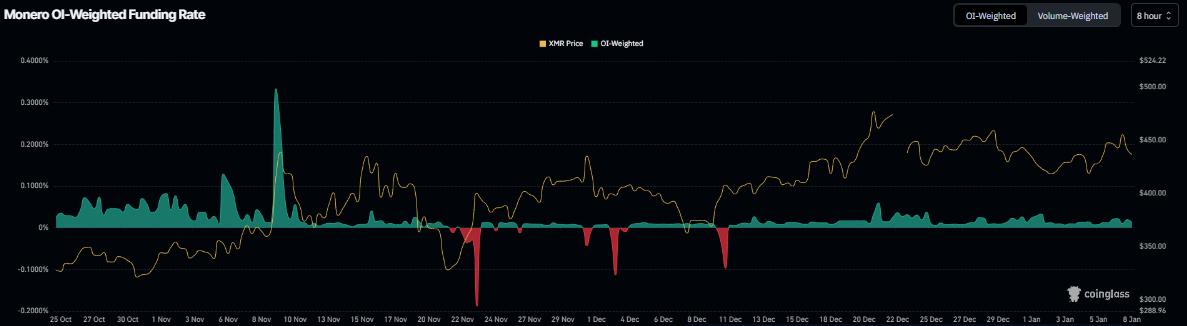
Coinglass’s OI-Weighted Funding Rate data shows that the number of traders betting that the price of XMR will slide further is lower than those anticipating a price increase.
The metric flipped to a positive rate in mid-December and has remained in positive territory, reading 0.012% on Thursday, indicating that longs are paying shorts. Historically, as shown in the chart below, when the funding rates have flipped from negative to positive and remained steady, Monero’s price has rallied sharply.
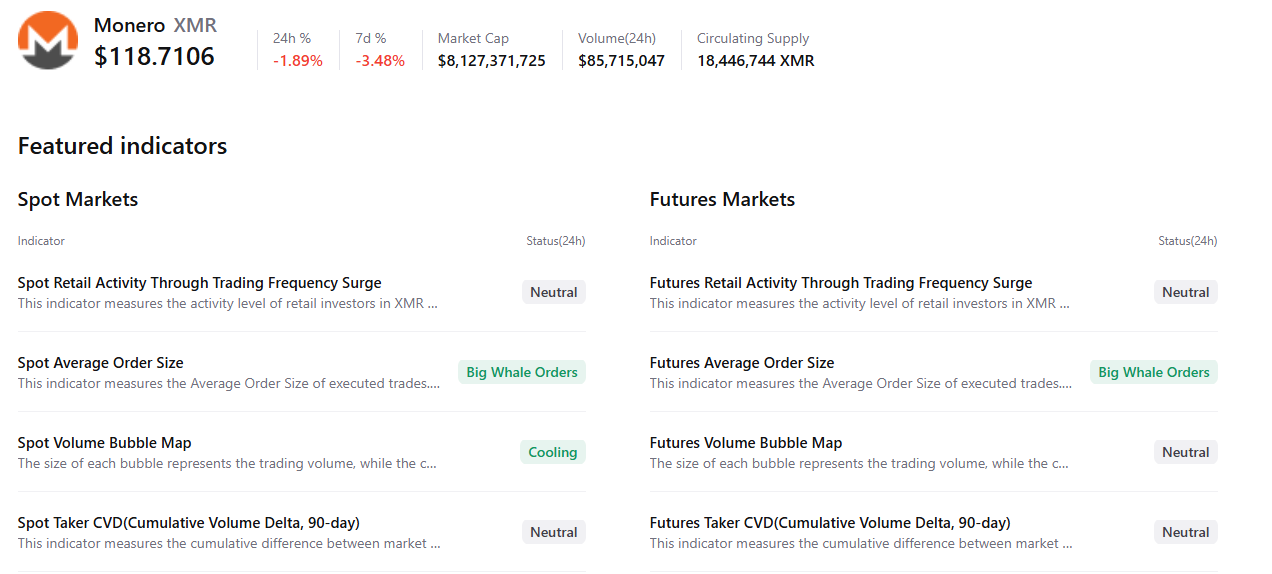
In addition, CryptoQuant’s summary data also supports the bullish outlook, with both the spot and futures markets showing large whale orders, signaling a potential rally ahead.
Moreover, privacy-focused coins such as Monero (XMR) and Zcash (ZEC) have started the year on a strong footing, collectively gaining around 7.8% so far this month, signaling renewed investor interest in the space.
-1767862464549-1767862464550.jpeg)
Monero Price Forecast: XMR bulls aiming for a level above $500
Monero price found support around the daily level of $418 on Sunday and rose nearly 6% in the next two days. This daily level at $418 roughly aligns with the 50-day Exponential Moving Average (EMA) at $416.42, making this area a key support level. At the time of writing on Thursday, XMR is trading slightly higher at around $444.
If XMR continues its upward trend, it could extend the rally toward the December 20 high of $497. A close above this level could extend additional gains above $500, a psychological level.
The Relative Strength Index (RSI) on the daily chart is 55, above the neutral 50 level, indicating bullish momentum is gaining traction. Moreover, the Moving Average Convergence Divergence (MACD) lines are converging, with the red horizontal bars diminishing, indicating fading bearish strength. If the MACD flips a bullish crossover, it would further support the bullish thesis.
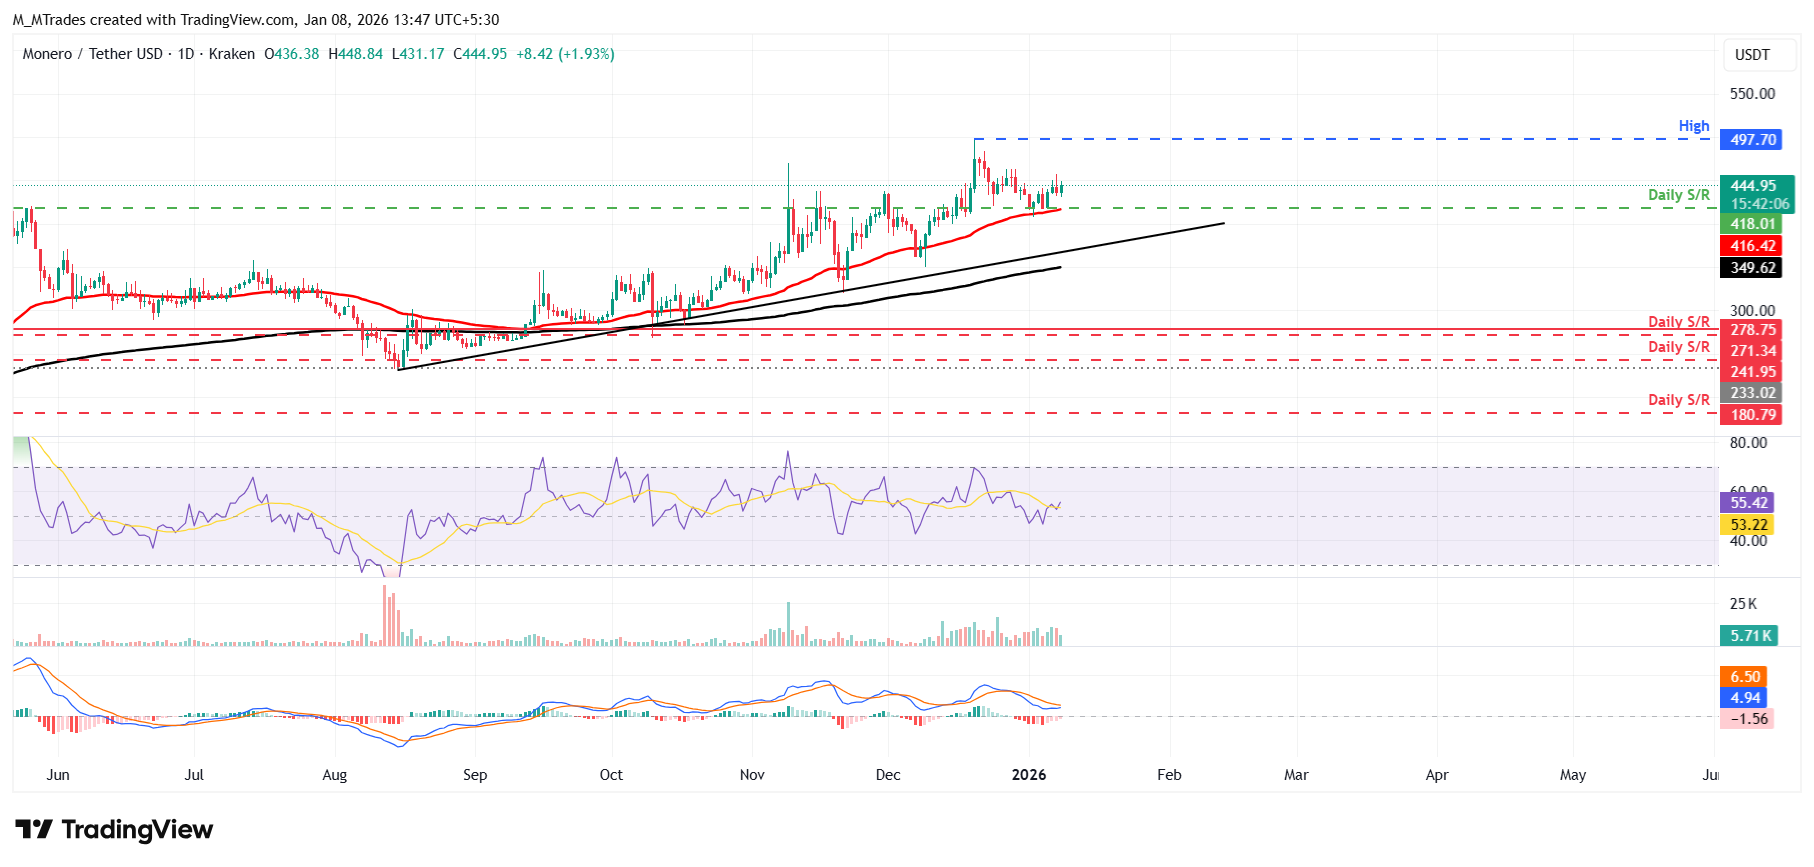
However, if XMR corrects and closes below the 50-day EMA at $416, it could extend the decline toward the psychological support level at $400.
Bài viết đề xuất


