Solana Price Forecast: SOL hits key support as sell-off wave cools down

Nguồn Fxstreet
  • Solana holds above $130, aiming for a rebound as RSI flashes oversold conditions.
  • Selling pressure declines in the cash and futures markets, as large wallet investors return to the spot market.
  • Institutional demand remains unfazed for Solana as ETF inflows record $8.26 million on Monday.

Solana (SOL) edges higher by 2% at press time on Tuesday, holding above the $130 mark. The technical outlook for Solana focuses on key support at $126 amid heightened selling pressure. However, steady inflows from Solana Exchange Traded Funds (ETFs) and an underlying shift in the spot and futures markets could help SOL rebound.

Dip in Solana shifts investors' sentiment

Solana is experiencing a surge in demand from large wallet investors, commonly referred to as whales, who are keen to buy the dip. According to CryptoQuant, the average order size of the executed trades in the SOL spot market indicates large whale orders. Furthermore, the Cumulative Volume Delta (CVD) indicates a positive difference in the market's buy and sell order volume, suggesting buy-side dominance.

At the same time, the volume bubble map, which tracks the difference in trading volume, indicates a decline in both spot and futures markets. This decrease in trading volume, amid a prevailing declining trend, signals reduced selling pressure that could act as dry powder for the subsequent Solana rebound.
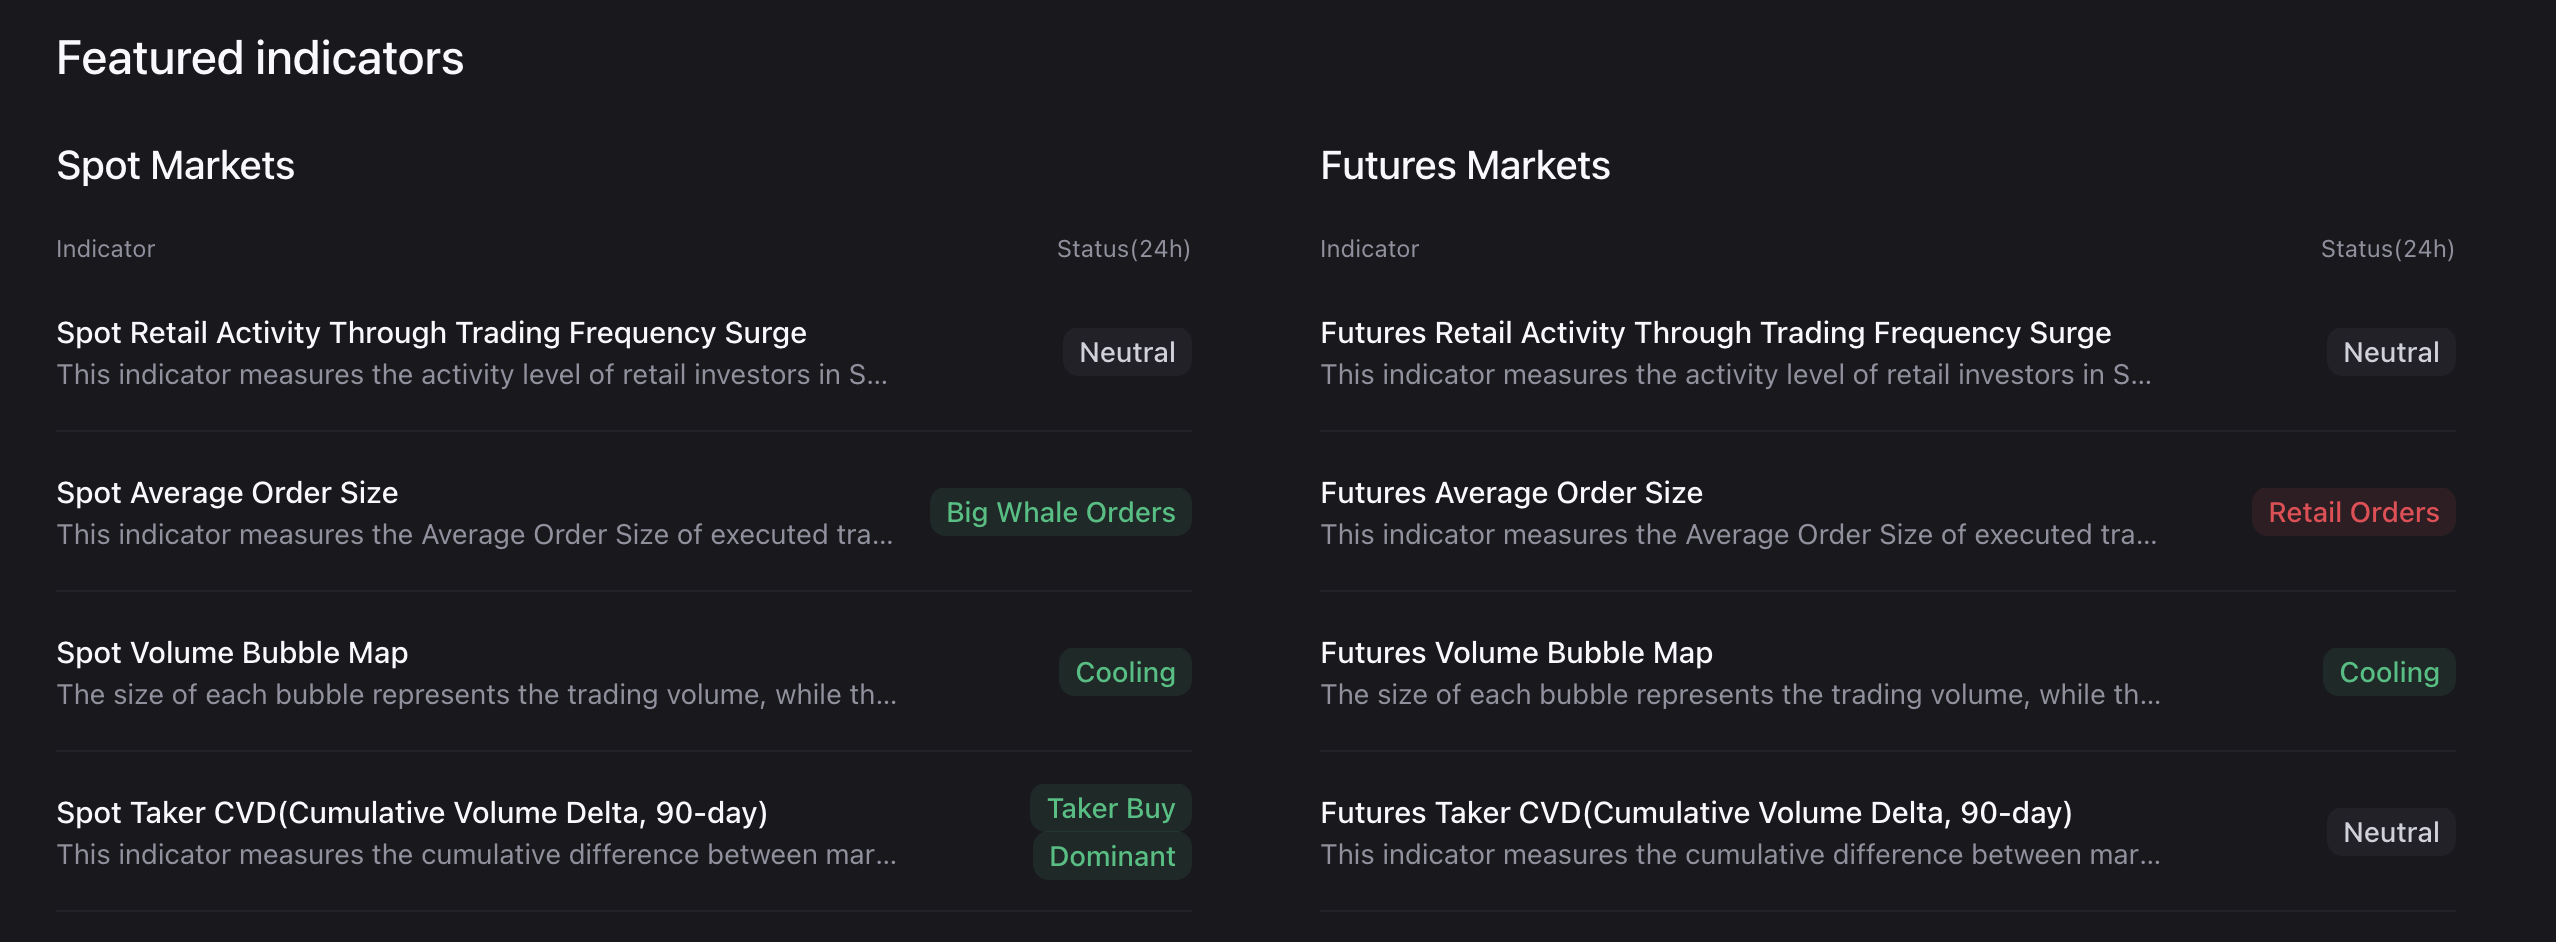
Solana spot and futures market data. Source: CryptoQuant.

Meanwhile, despite Solana being down over 30% from October 28, the institutional demand remains steady. The SOL ETFs recorded a net inflow of $8.25 million on Monday, marking 15 consecutive days of positive flows.
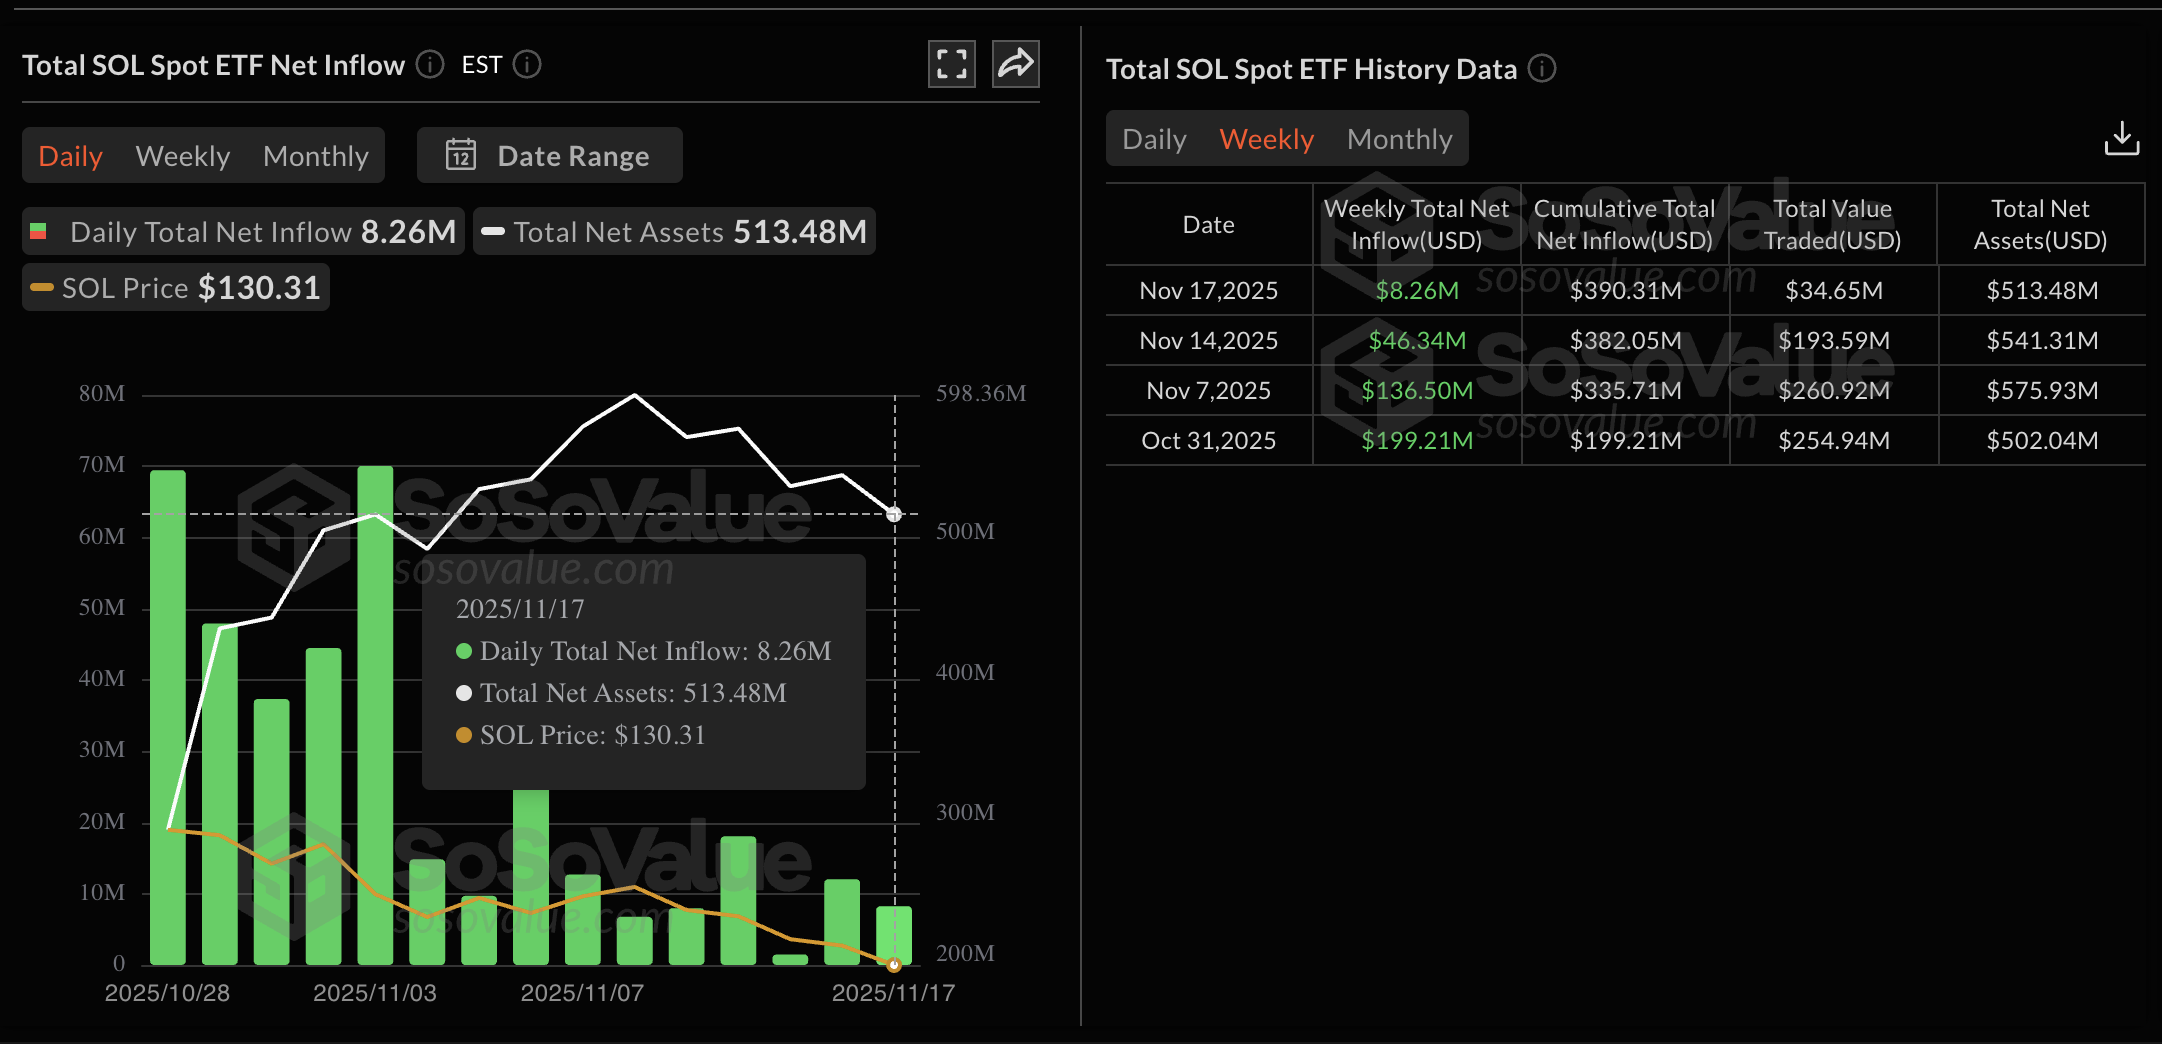
Solana ETF data. Source: CoinGlass.

Solana hits a crucial crossroads, preparing for a rebound

Solana holds above the S2 Pivot Point at $128, slightly above the bearish target of $126, marked by the June 22 low, as previously reported by FXStreet. However, the close alignment of these strong supports could absorb the incoming supply, potentially leading to a bounce back. 

This potential rebound in SOL could test the $150 psychological level near the $155 supply zone. 

Still, the technical indicators on the daily chart tilt bearish, as the Moving Average Convergence Divergence (MACD) continues to extend the declining trend with the signal line. 

Even the Relative Strength Index (RSI) at 30 hovers near the oversold boundary, signaling heightened selling pressure. However, extreme oversold conditions, indicated by RSI values below 30, signal a potential reversal as investors shift to buy the dip at undervalued prices. 
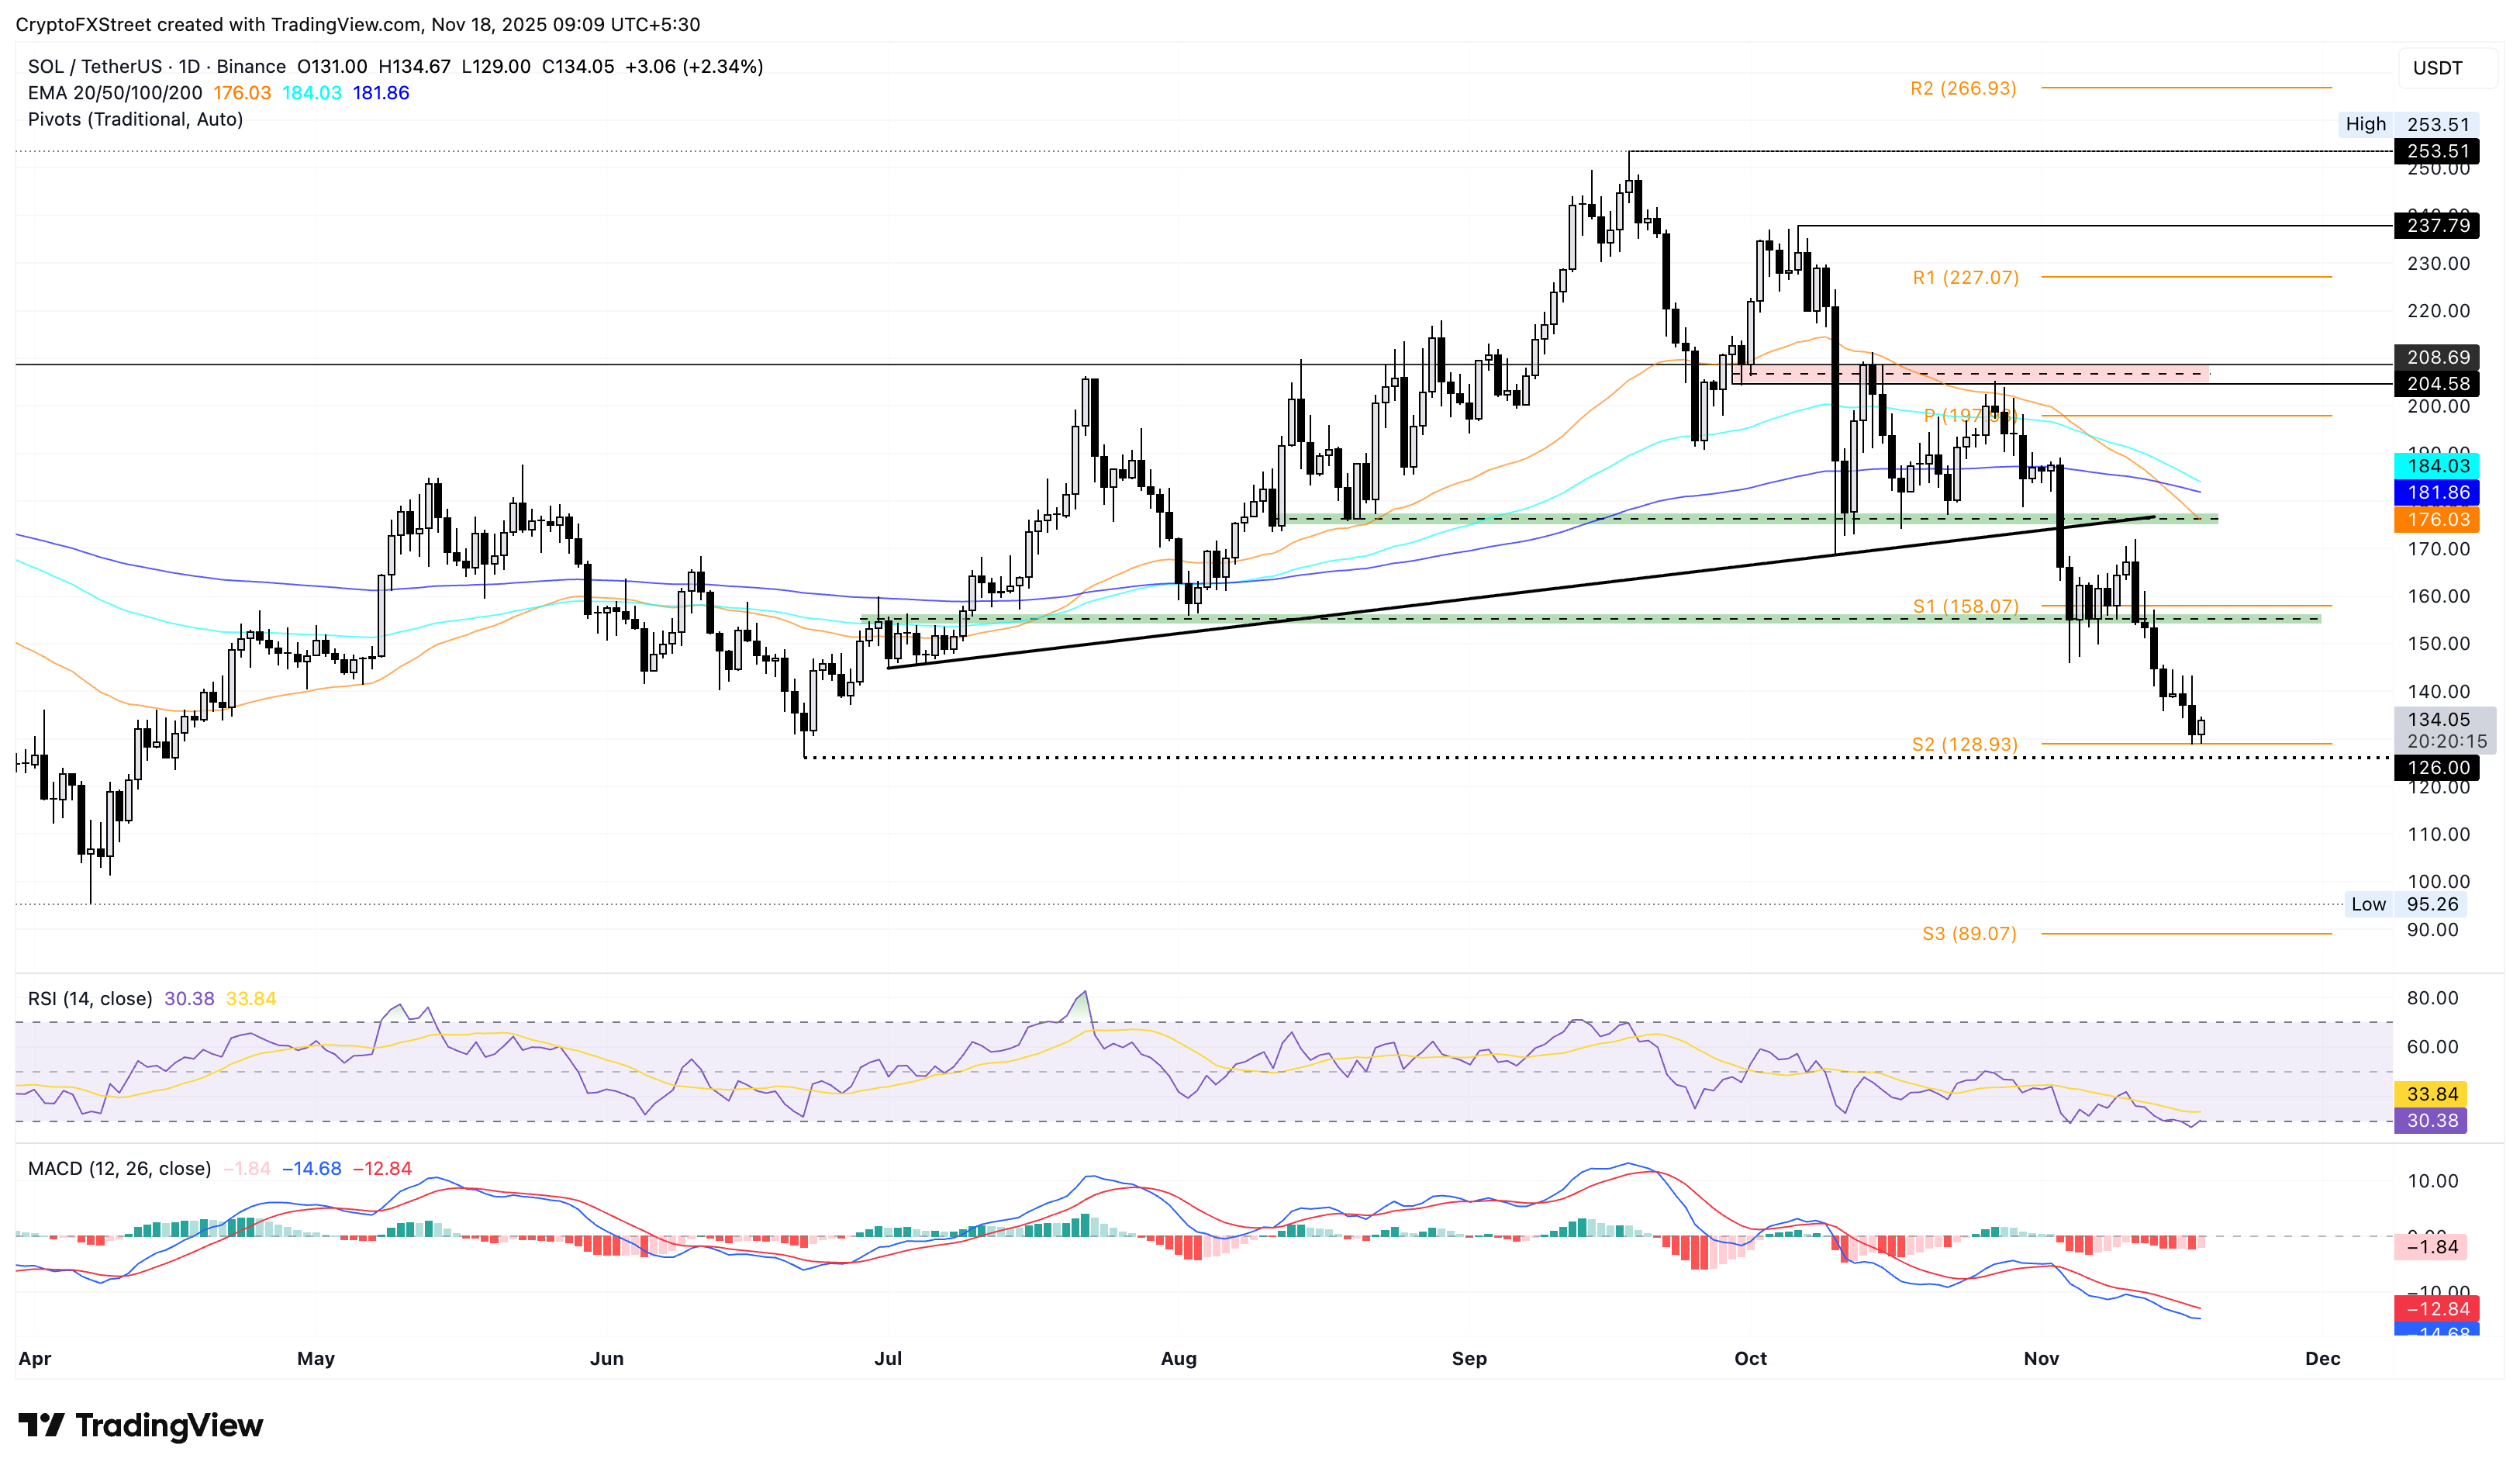
SOL/USDT daily price chart.

If SOL drops below $126, it would nullify rebound chances and likely test the April 7 low of $95.

Tuyên bố miễn trừ trách nhiệm: Chỉ dành cho mục đích thông tin. Hiệu suất trong quá khứ không đảm bảo cho kết quả trong tương lai.
placeholder
Nhìn lại lịch sử giá vàng trong 50 năm qua. Liệu vàng còn tiếp tục thời kỳ hoàng kim thêm 50 năm nữa? Trong 50 năm qua, vàng vẫn luôn giữ được vị thế là tài sản được ưa chuộng và phổ biến nhất thế giới. Giao dịch vàng luôn được các nhà đầu tư quan tâm do mức độ thanh khoản cao và tầm ảnh hưởng lớn đến toàn bộ thị trường tài chính. Vậy, lịch sử giá vàng như thế nào và cách đầu tư vàng ra sao? Chúng ta sẽ cùng tìm hiểu qua bài viết dưới đây.
Tác giả  Nhóm Traderins
ngày11 tháng 12 năm 2023
Trong 50 năm qua, vàng vẫn luôn giữ được vị thế là tài sản được ưa chuộng và phổ biến nhất thế giới. Giao dịch vàng luôn được các nhà đầu tư quan tâm do mức độ thanh khoản cao và tầm ảnh hưởng lớn đến toàn bộ thị trường tài chính. Vậy, lịch sử giá vàng như thế nào và cách đầu tư vàng ra sao? Chúng ta sẽ cùng tìm hiểu qua bài viết dưới đây.
placeholder
EUR/USD di chuyển xuống dưới 1,1700, đà giảm có vẻ bị hạn chế do giọng điệu ôn hòa của FedEUR/USD giảm nhẹ sau khi ghi nhận mức tăng khoảng 0,5% trong phiên giao dịch trước, giao dịch quanh mức 1,1690 trong giờ châu Á vào thứ Hai
Tác giả  BeInCrypto
8 tháng 18 ngày Thứ Hai
EUR/USD giảm nhẹ sau khi ghi nhận mức tăng khoảng 0,5% trong phiên giao dịch trước, giao dịch quanh mức 1,1690 trong giờ châu Á vào thứ Hai
placeholder
USD/JPY giao dịch dưới mức 154,00 khi các số liệu CPI của Tokyo vẫn ở trên mục tiêu của BoJCặp USD/JPY giảm nhẹ sau khi đạt mức cao nhất trong tám tháng là 154,45 trong phiên giao dịch trước đó, giao dịch quanh mức 153,80 trong những giờ giao dịch ở châu Á vào thứ Sáu.
Tác giả  FXStreet
10 tháng 31 ngày Thứ Sáu
Cặp USD/JPY giảm nhẹ sau khi đạt mức cao nhất trong tám tháng là 154,45 trong phiên giao dịch trước đó, giao dịch quanh mức 153,80 trong những giờ giao dịch ở châu Á vào thứ Sáu.
placeholder
Đợt tăng 400% trong tháng 10 của Zcash cho thấy dấu hiệu đuối sức — liệu sắp có nhịp điều chỉnh?Zcash (ZEC) gây chú ý với mức tăng gần 400% trong tháng 10 và nhảy 44.2% trong tuần này. Chỉ riêng 24 giờ qua còn tăng thêm 6.6%, cho thấy lực mua rất mạnh. Tuy nhiên, dù giá Zcash tiếp tục leo dốc, c
Tác giả  BeInCrypto
10 tháng 31 ngày Thứ Sáu
Zcash (ZEC) gây chú ý với mức tăng gần 400% trong tháng 10 và nhảy 44.2% trong tuần này. Chỉ riêng 24 giờ qua còn tăng thêm 6.6%, cho thấy lực mua rất mạnh. Tuy nhiên, dù giá Zcash tiếp tục leo dốc, c
placeholder
Dự báo giá vàng: XAU/USD giảm xuống dưới mức 4.050$ do sức mạnh của USD và các bình luận diều hâu từ FedGiá vàng (XAU/USD) tiếp tục giảm xuống khoảng 4.030$ trong phiên giao dịch đầu ngày thứ Ba ở châu Á. Kim loại quý giảm nhẹ khi các nhà giao dịch hạ bớt kỳ vọng về việc cắt giảm lãi suất của Mỹ vào tháng tới.
Tác giả  FXStreet
4 giờ trước
Giá vàng (XAU/USD) tiếp tục giảm xuống khoảng 4.030$ trong phiên giao dịch đầu ngày thứ Ba ở châu Á. Kim loại quý giảm nhẹ khi các nhà giao dịch hạ bớt kỳ vọng về việc cắt giảm lãi suất của Mỹ vào tháng tới.
sản phẩm liên quan
goTop
quote