


Chainlink Price Forecast: LINK bulls defend key support, but low retail interest signals caution
- Chainlink trades above $14.00 on Monday, as the cryptocurrency market generally recovers from last week’s volatility.
- LINK faces declining retail interest amid a weak derivatives market characterised by suppressed Open Interest.
- A Death Cross pattern on LINK’s daily chart points to a short-term bearish outlook.
Chainlink (LINK) is trading above $14.00 at the time of writing on Monday, as the broader cryptocurrency market mildly recovers following last week’s volatility and extended sell-off.
Chainlink edges higher despite low retail interest
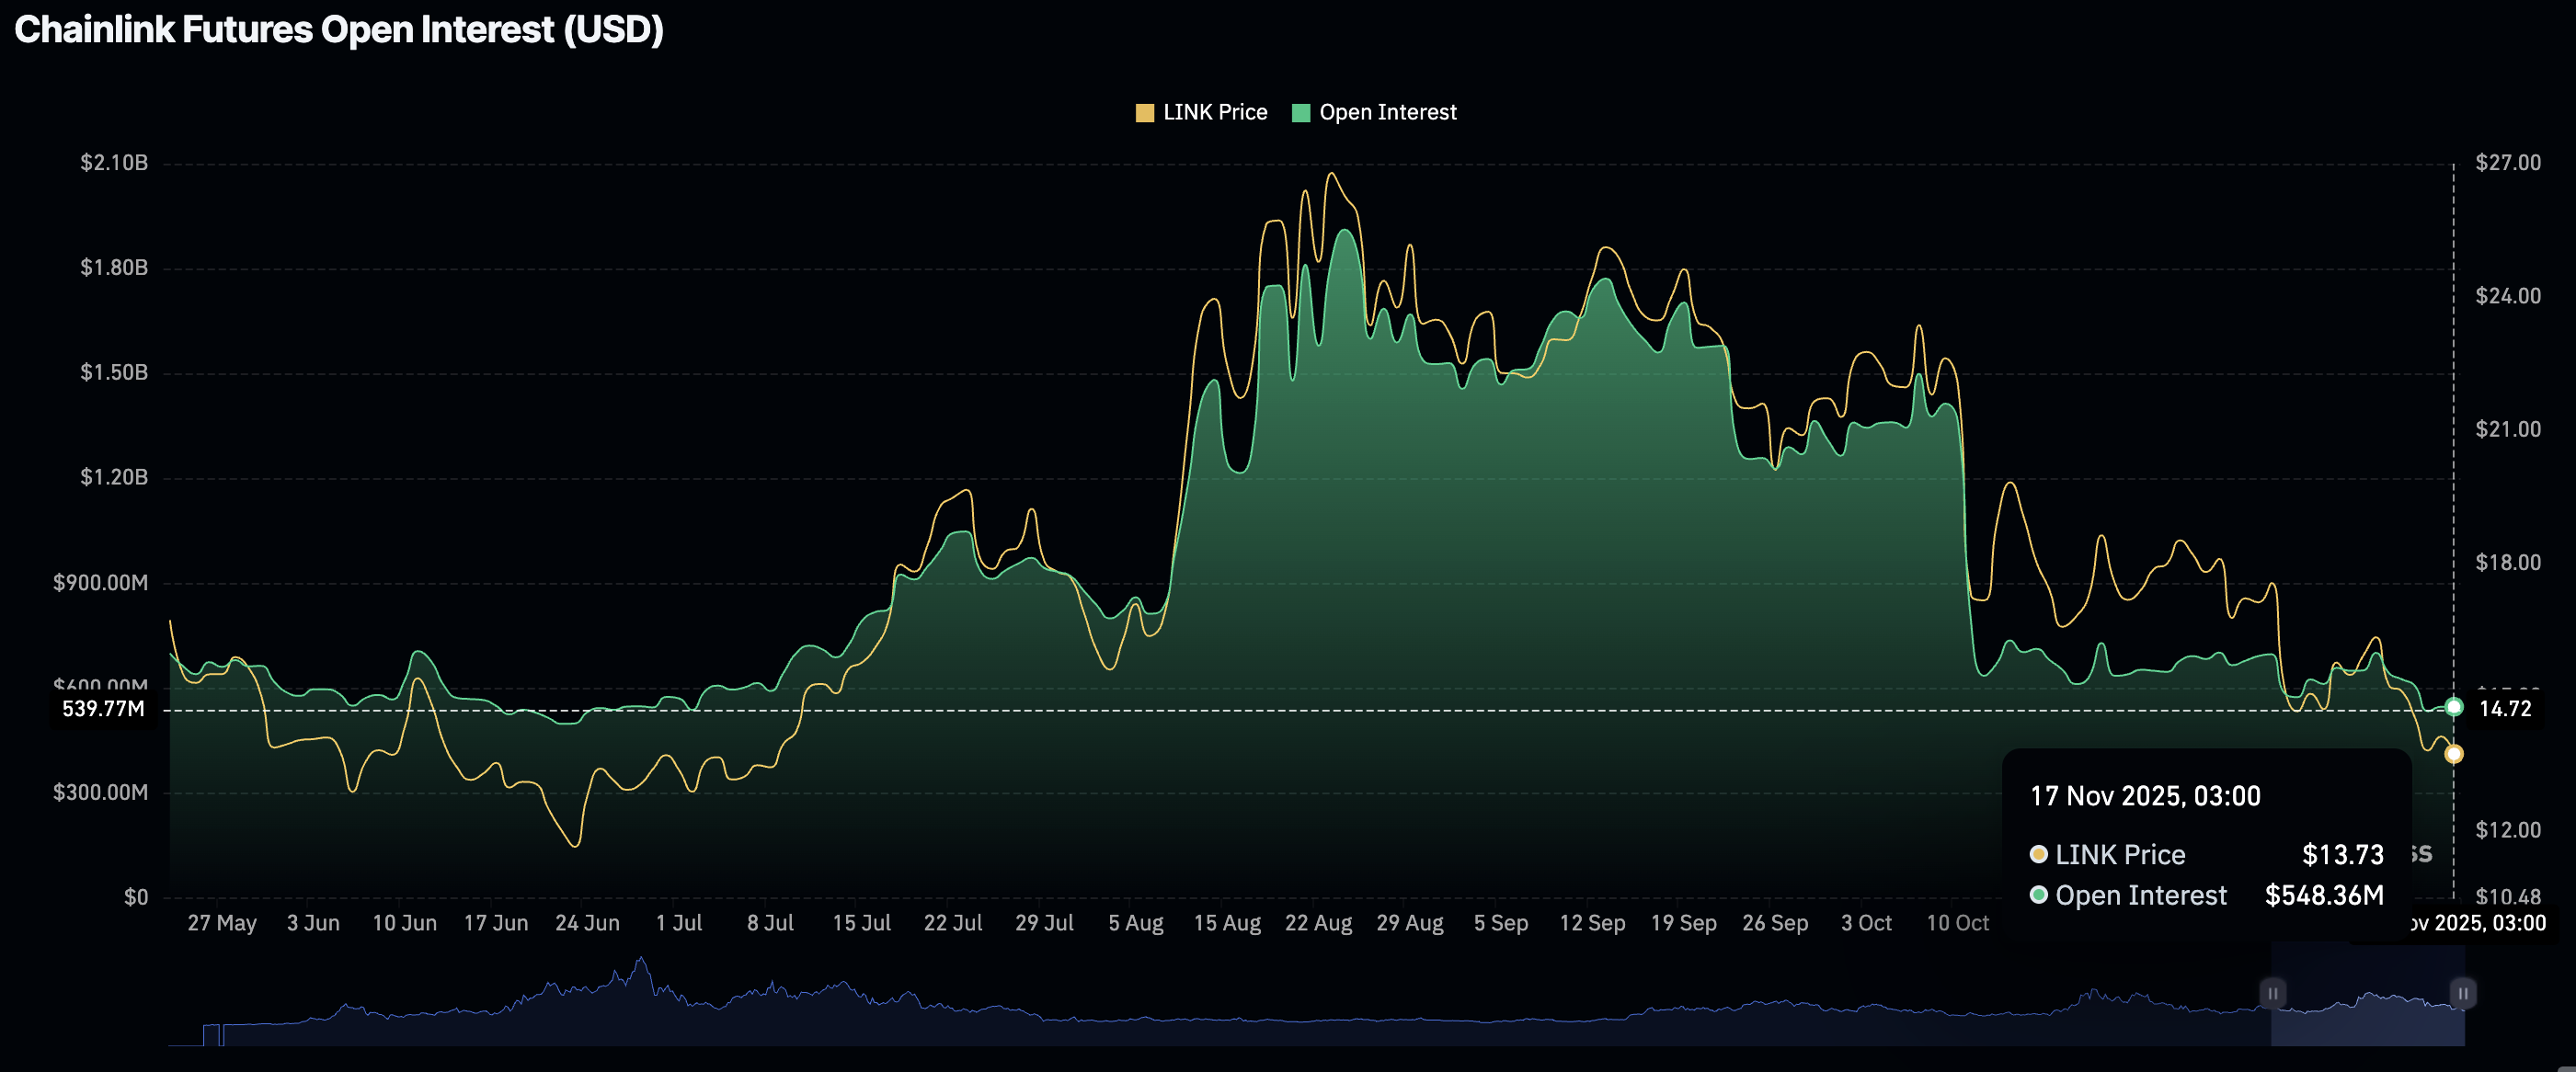
Chainlink is experiencing a weak derivatives market, characterised by a significantly suppressed futures Open Interest (OI). According to CoinGlass data, the OI, representing the notional value of outstanding futures, has remained relatively unchanged over the past two days at approximately $548 million.
Compared to the OI record high of $1.91 billion on August 24, this represents a 71% decline in LINK retail demand, which may hinder a steady recovery in the short term.
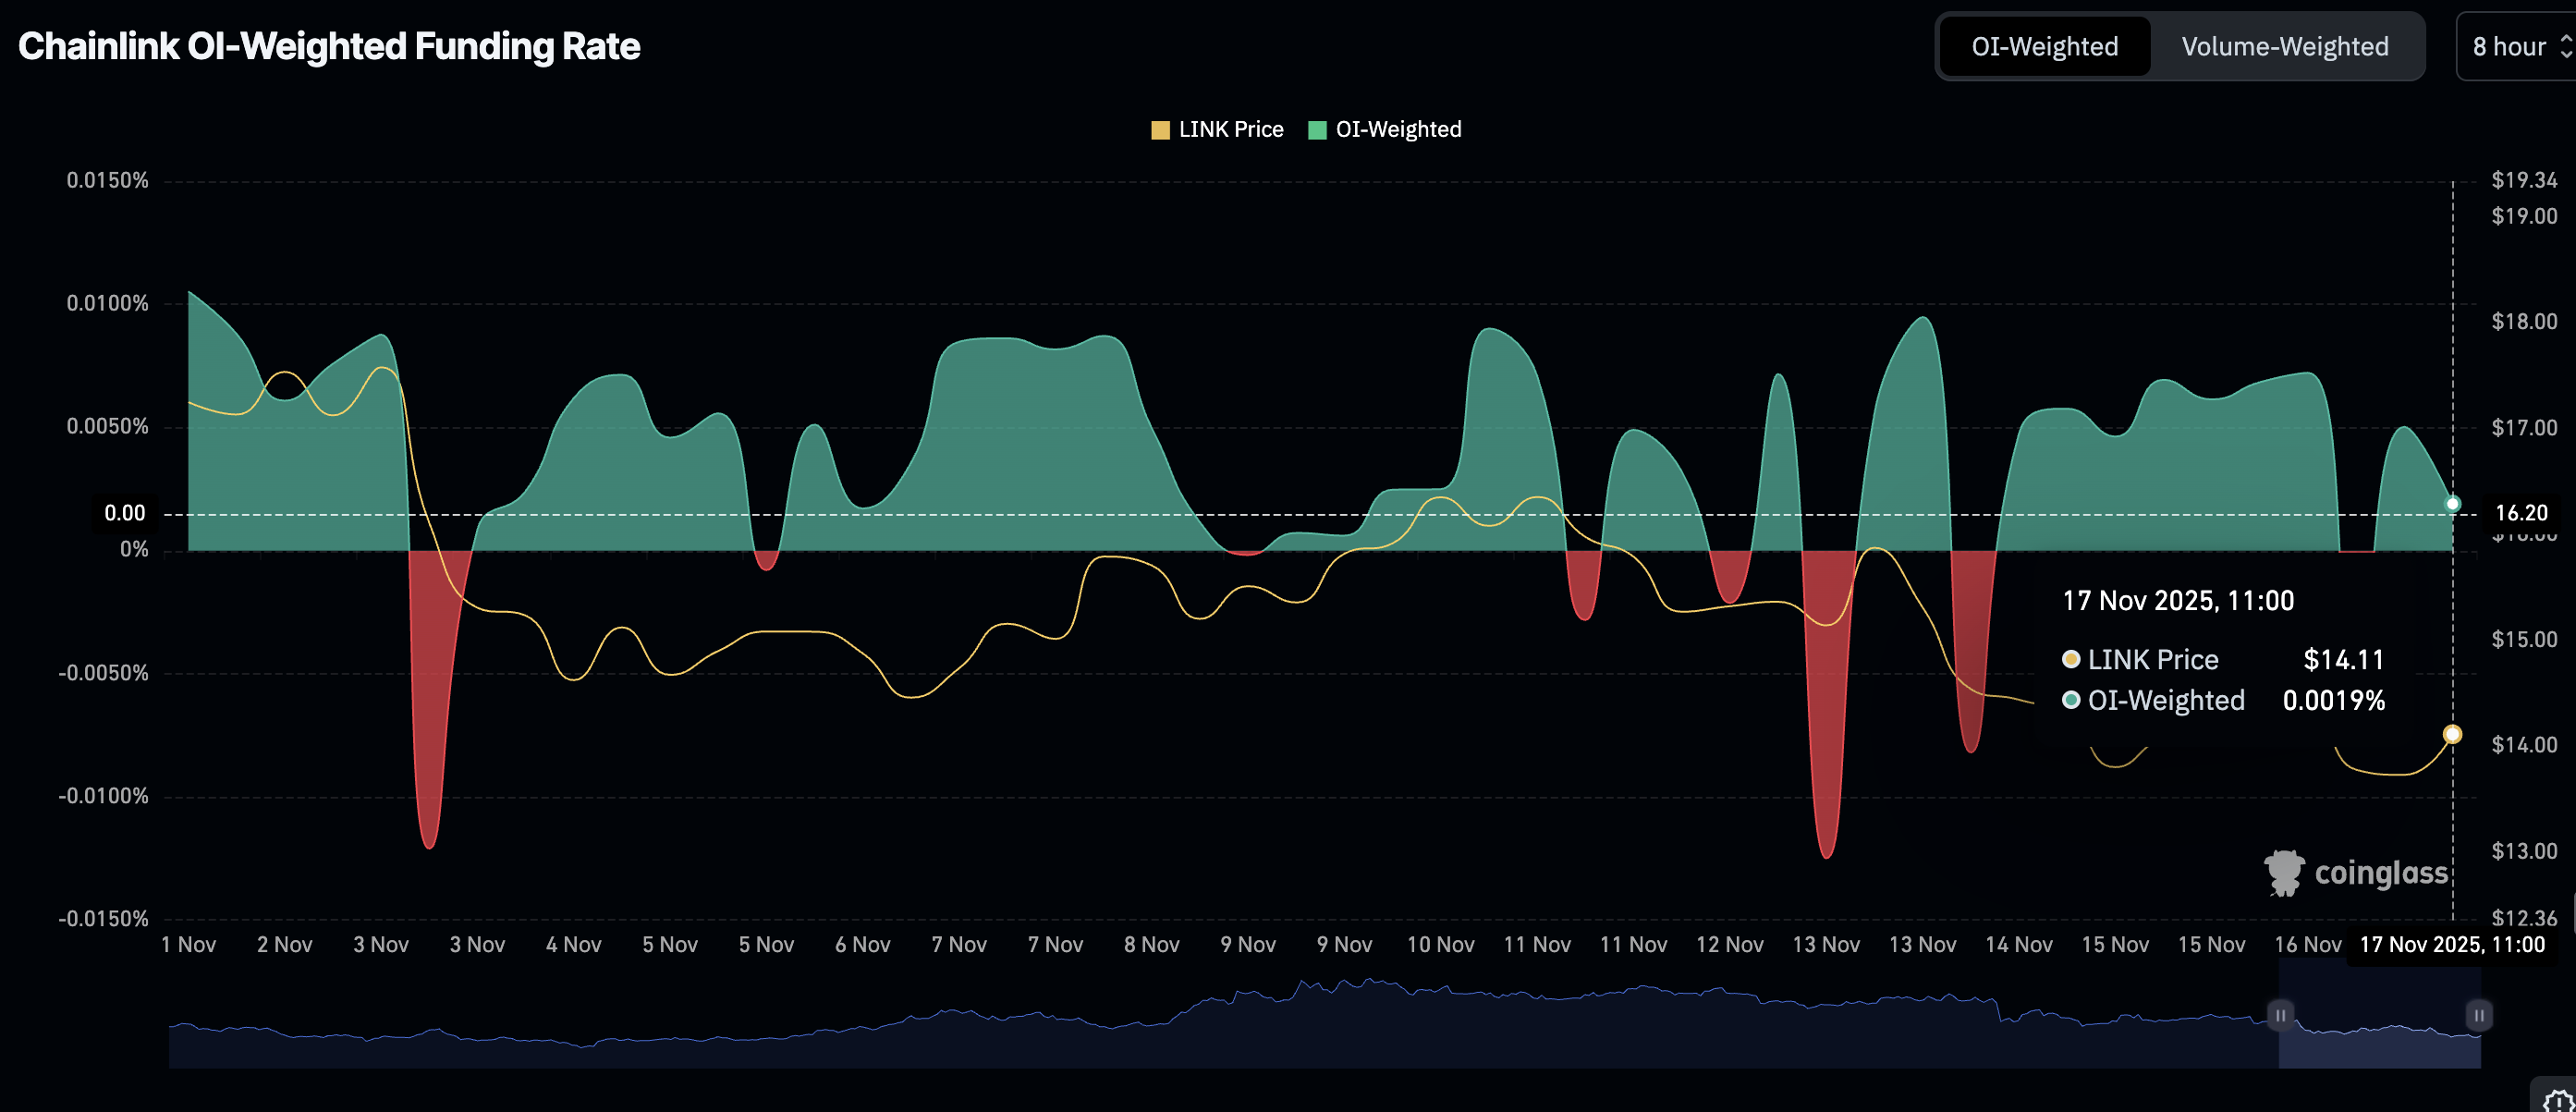
Traders are also leaning bearishly, piling into short positions, as evidenced by the OI-Weighted Funding Rate falling to 0.0019% from a peak of 0.0050% earlier in the day. Low retail demand, along with risk-off sentiment, could prevent Chainlink from stabilizing the uptrend above $14.00.
Technical outlook: LINK holds near support
Chainlink is trading above $14.00 at the time of writing on Monday, supported by a mildly strong technical structure. The Relative Strength Index (RSI) has risen to 36 from 34 the previous day, suggesting that bullish momentum is slowly increasing. Higher readings toward the bullish region would signal a strong bullish grip and increase the odds of a breakout targeting $20.00.
However, the Moving Average Convergence Divergence (MACD) indicator continues to support a sell signal from Friday. Until the blue MACD line crosses above the red signal line, traders cannot shrug off the possibility of selling pressure increasing.
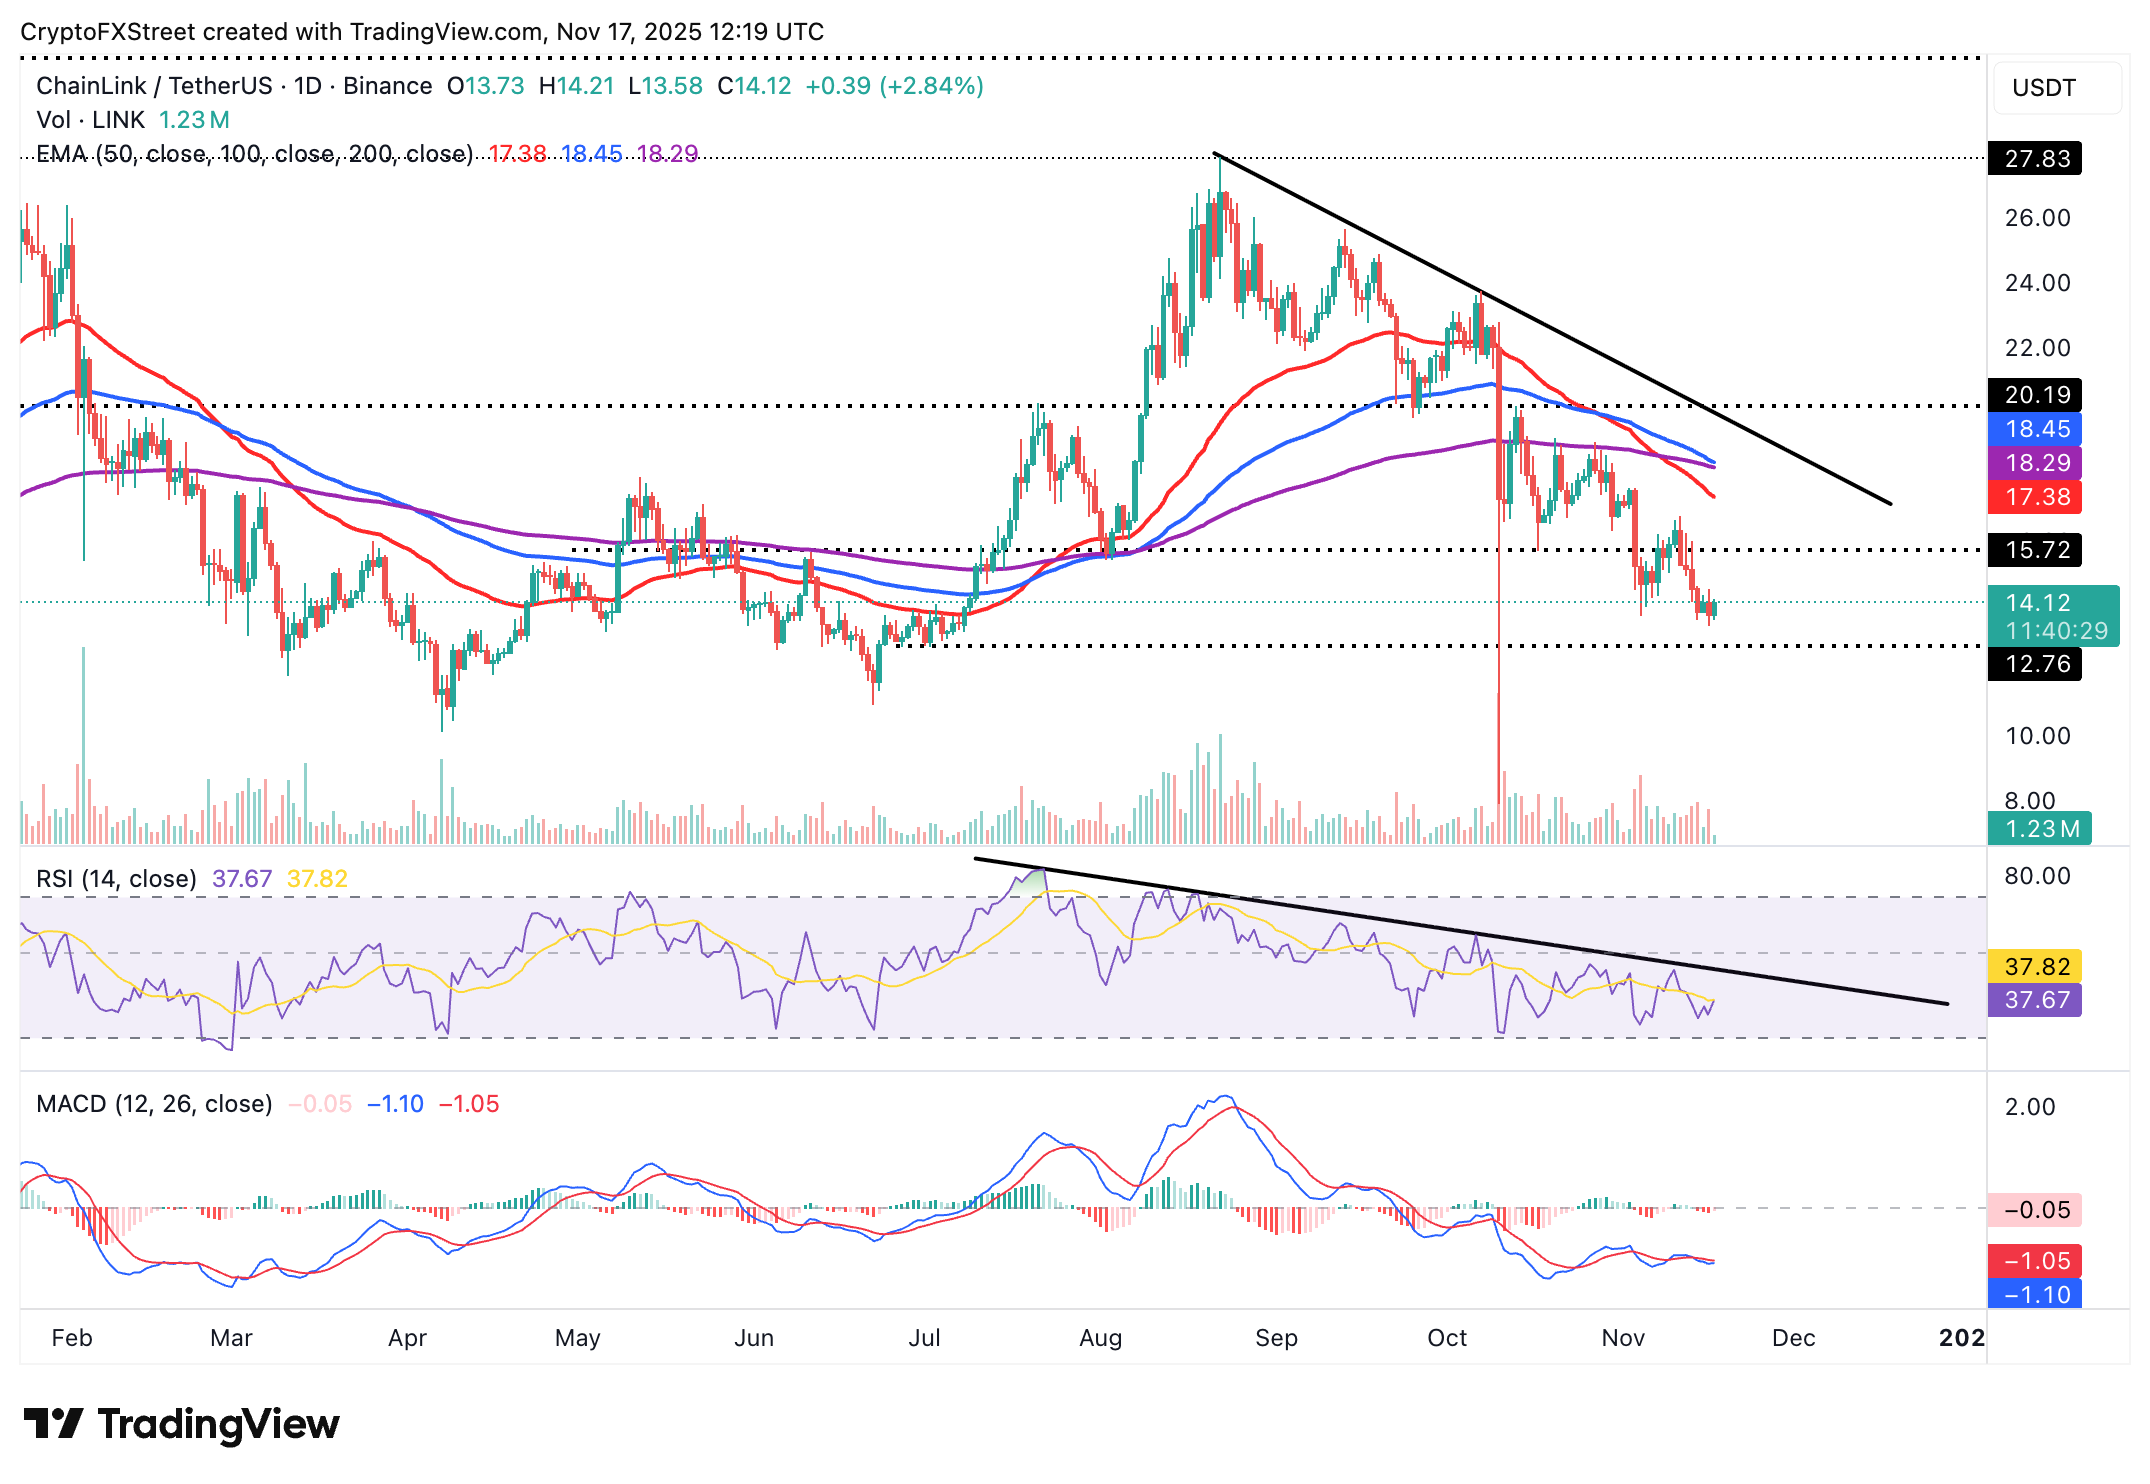
The 50-day Exponential Moving Average (EMA) at $17.37 recently confirmed a Death Cross pattern after crossing below the 100-day EMA, which is currently at $18.44. This is a bearish pattern, reinforcing bearish sentiment surrounding Chainlink.
Key areas of interest for traders include $16.85, tested on Tuesday, the 50-day EMA and the round-number supply level of $20.00. If LINK extends its decline below $14.00, traders may shift their attention to the demand zone between $10.98 and $12.76, where they could increase exposure in anticipation of a stronger rebound.
Open Interest, funding rate FAQs
Higher Open Interest is associated with higher liquidity and new capital inflow to the market. This is considered the equivalent of increase in efficiency and the ongoing trend continues. When Open Interest decreases, it is considered a sign of liquidation in the market, investors are leaving and the overall demand for an asset is on a decline, fueling a bearish sentiment among investors.
Funding fees bridge the difference between spot prices and prices of futures contracts of an asset by increasing liquidation risks faced by traders. A consistently high and positive funding rate implies there is a bullish sentiment among market participants and there is an expectation of a price hike. A consistently negative funding rate for an asset implies a bearish sentiment, indicating that traders expect the cryptocurrency’s price to fall and a bearish trend reversal is likely to occur.
Bài viết đề xuất


