
Pi Network Price Forecast: PI crashes below key support, risking further losses
- Pi Network extends the decline after breaking below the $0.2565 support level the previous day.
- Two major Pi Network transactions are user deposits to OKX, suggesting investors are reducing their exposure.
- PI risks further losses as it targets the $0.2000 round figure, with selling pressure growing.
Pi Network (PI) price is down 3% at press time on Wednesday, following a 6% decline from the previous day. Both large transaction records on the network and the technical outlook indicate heightened selling pressure, which could further extend the losses to $0.2000 round figure.
Supply pressure on the rise
The retail interest in Pi Network is gradually declining as users deposit to Centralized Exchanges (CEX) in large numbers. PiScan data shows that two of the largest transactions on the Pi Network, based on volume, are user deposits of 532,434 PI and 473,426 PI tokens. Typically, tokens that shift from on-chain to exchanges are considered part of the supply pressure.
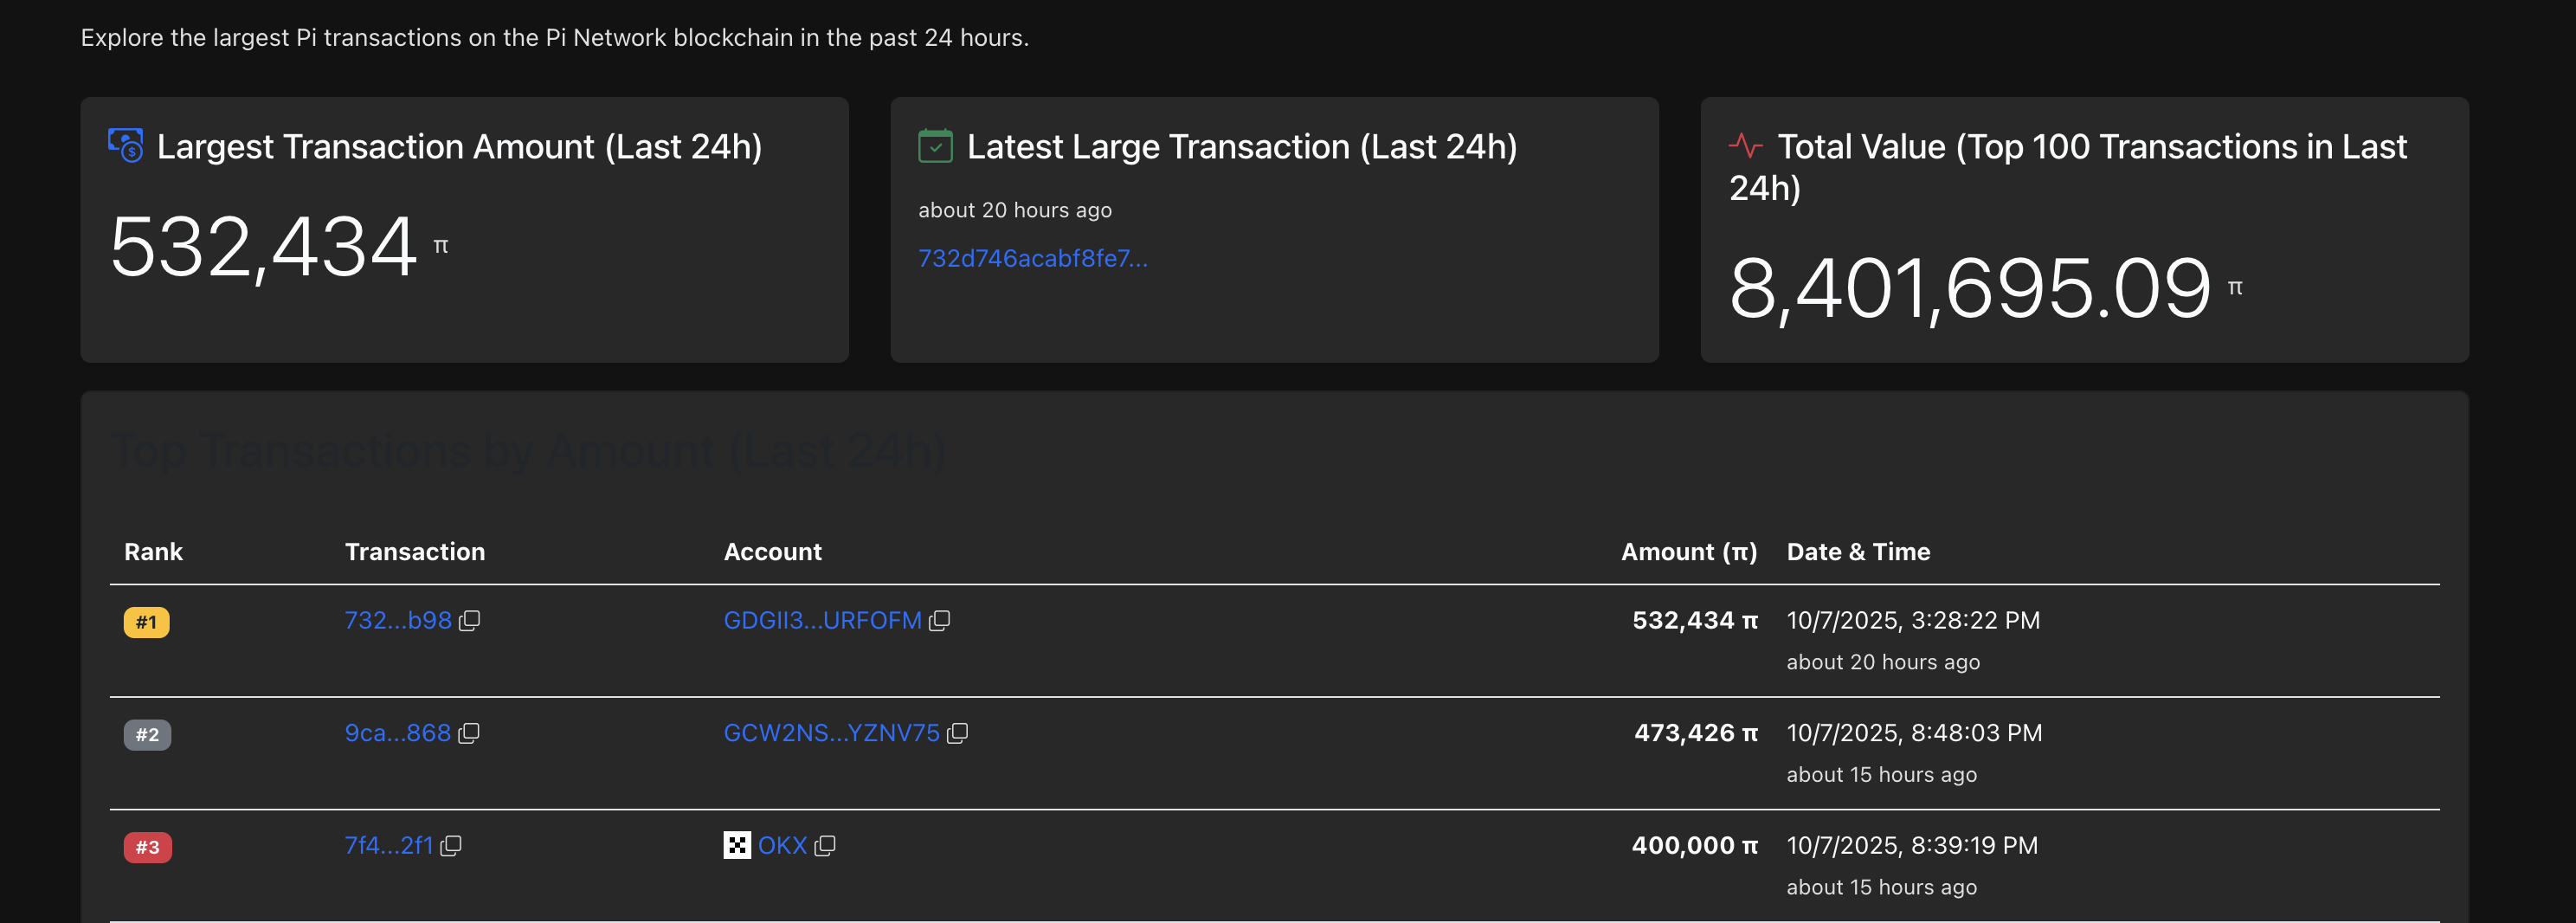
Transaction records. Source: PiScan
However, the CEX reserves continue to decline over the same period by over 1.37 million PI tokens, suggesting that the majority of the supply pressure is coming from direct on-chain transfer, bypassing the CEXs. Out of the 8.246 billion PI in circulation, just 428.26 million PI is held by CEXs, which accounts for slightly over 5%, as previously reported by FXStreet.
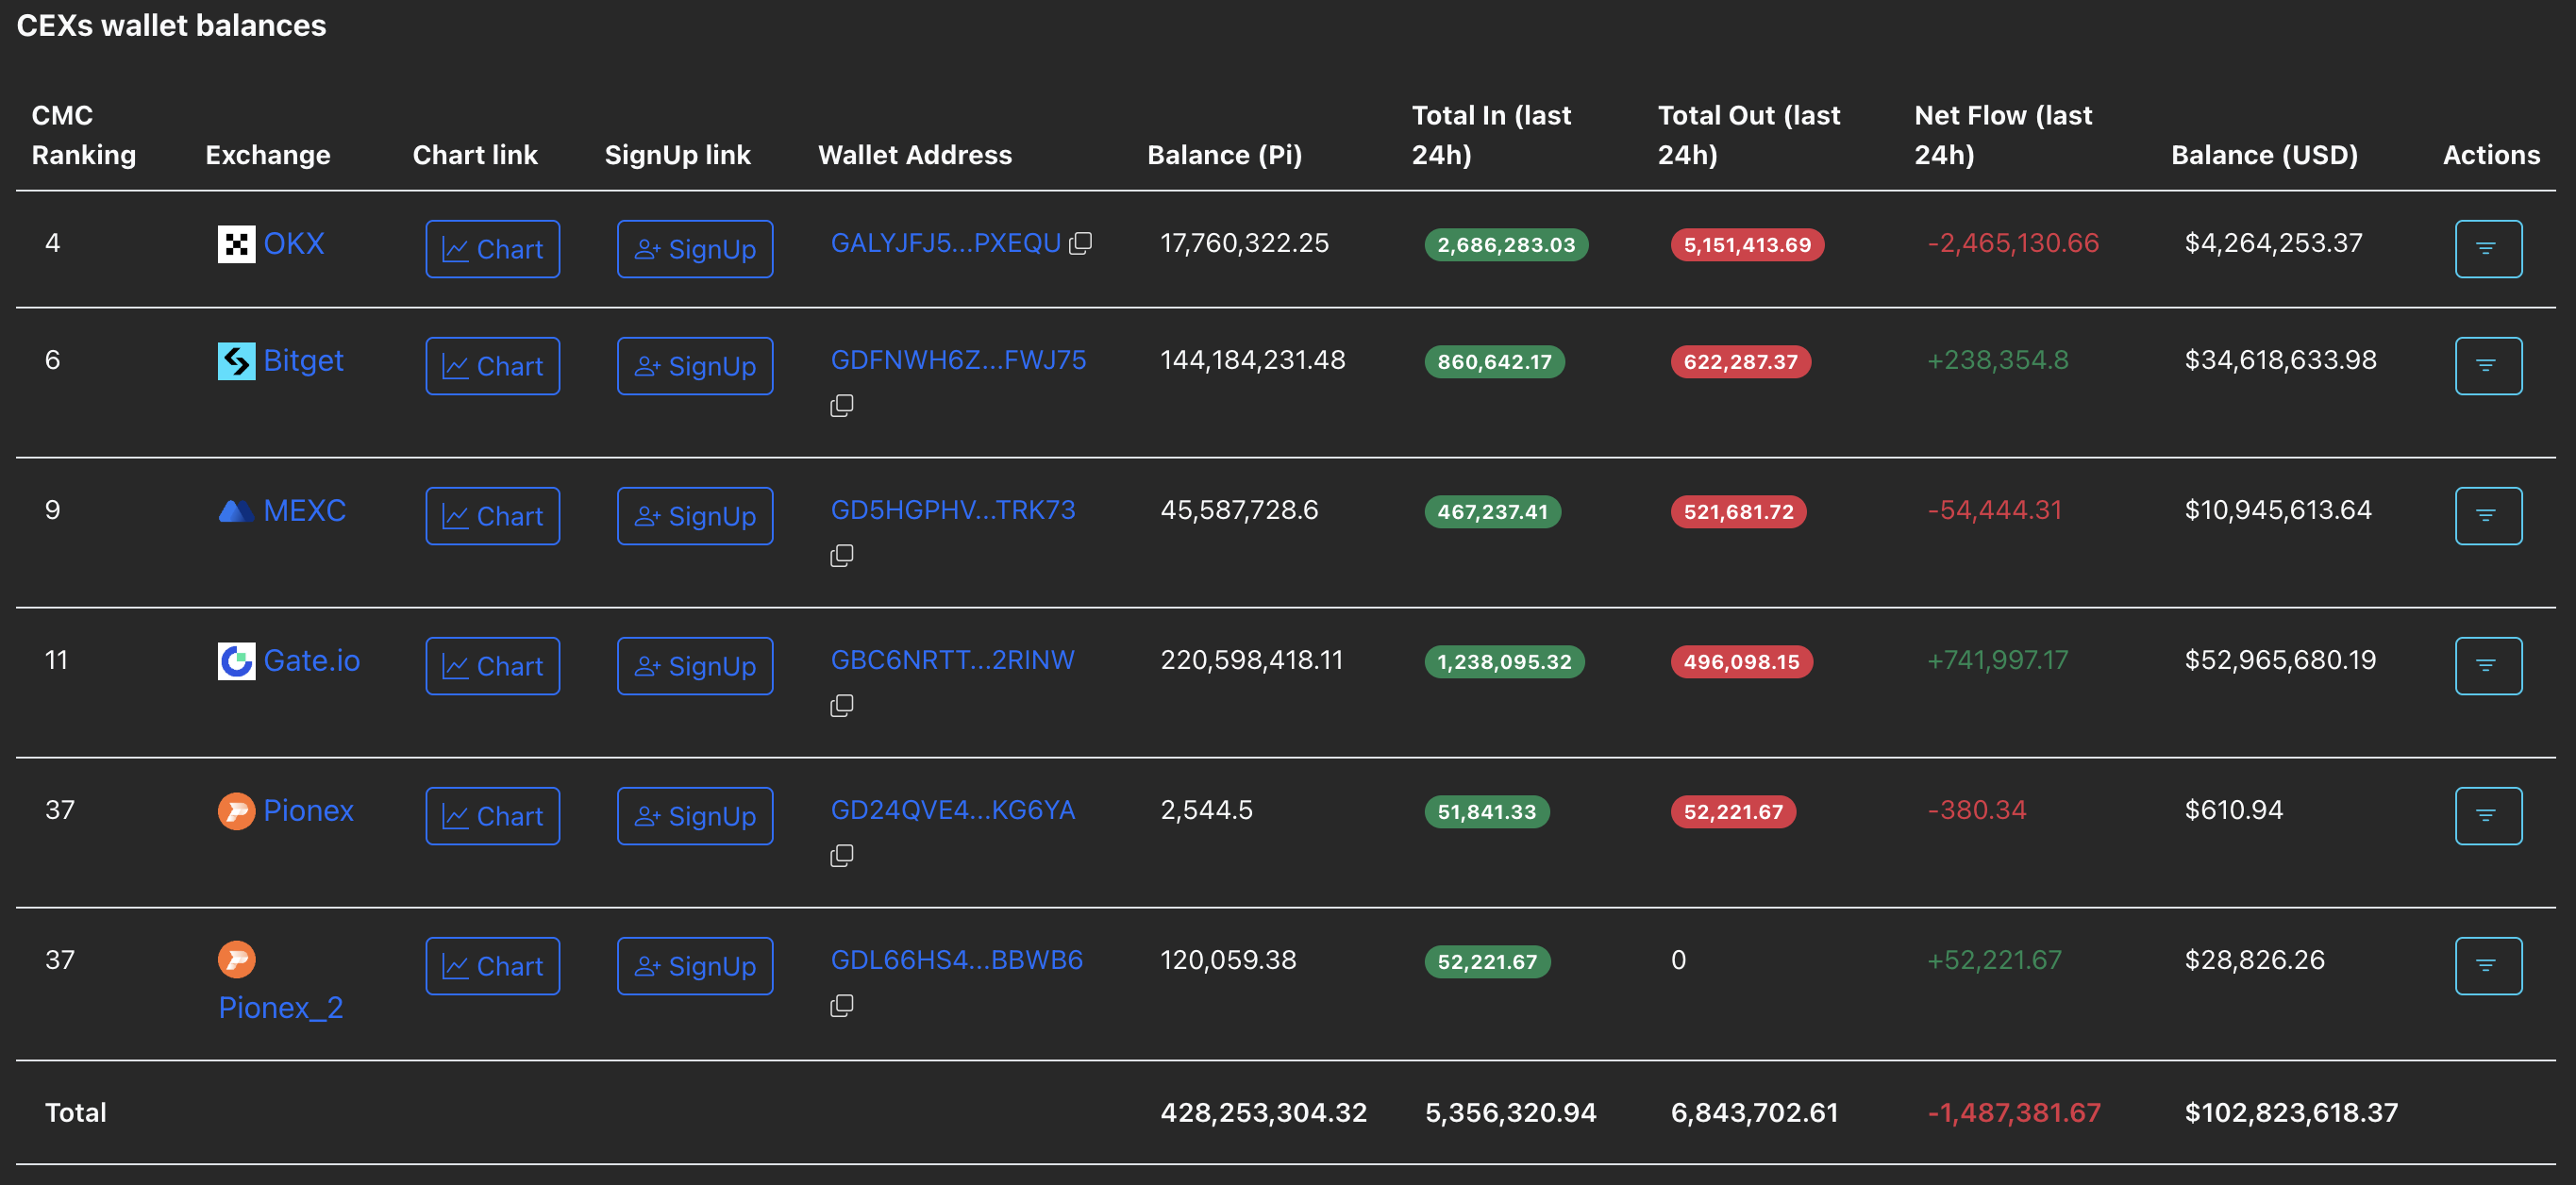
CEXs wallet balances. Source: PiScan
Pi Network risks further losses
Pi Network trades below $0.2400 at press time on Wednesday, extending its third consecutive week of losses. The mobile mining cryptocurrency failed to recover as the market rebounded last week, but suffered a pullback amid the broader market decline, indicating weakened investor sentiment.
If the declining trend in PI persists, it could find support at the S3 and S4 Pivot Point levels, located at $0.2259 and $0.2113, respectively. Meanwhile, the market anticipates a potential drop to the $0.2000 psychological support.
Despite Decentralized Finance (DeFi) protocols such as Decentralized Exchange (DEX), Automated Market Maker (AMM), and a token creation tool in the pipeline for the mainnet, the lack of transparency on the launch date, development progress, and the ongoing update to the Stellar protocol version 23 keeps the investors on edge.
The technical indicators on the 4-hour chart indicate strong bearish momentum, as the Relative Strength Index (RSI) has dropped to 23, entering the oversold zone. Meanwhile, the Moving Average Convergence Divergence (MACD) corroborates the rise in selling pressure with successive rises in red histogram bars and declining average lines.
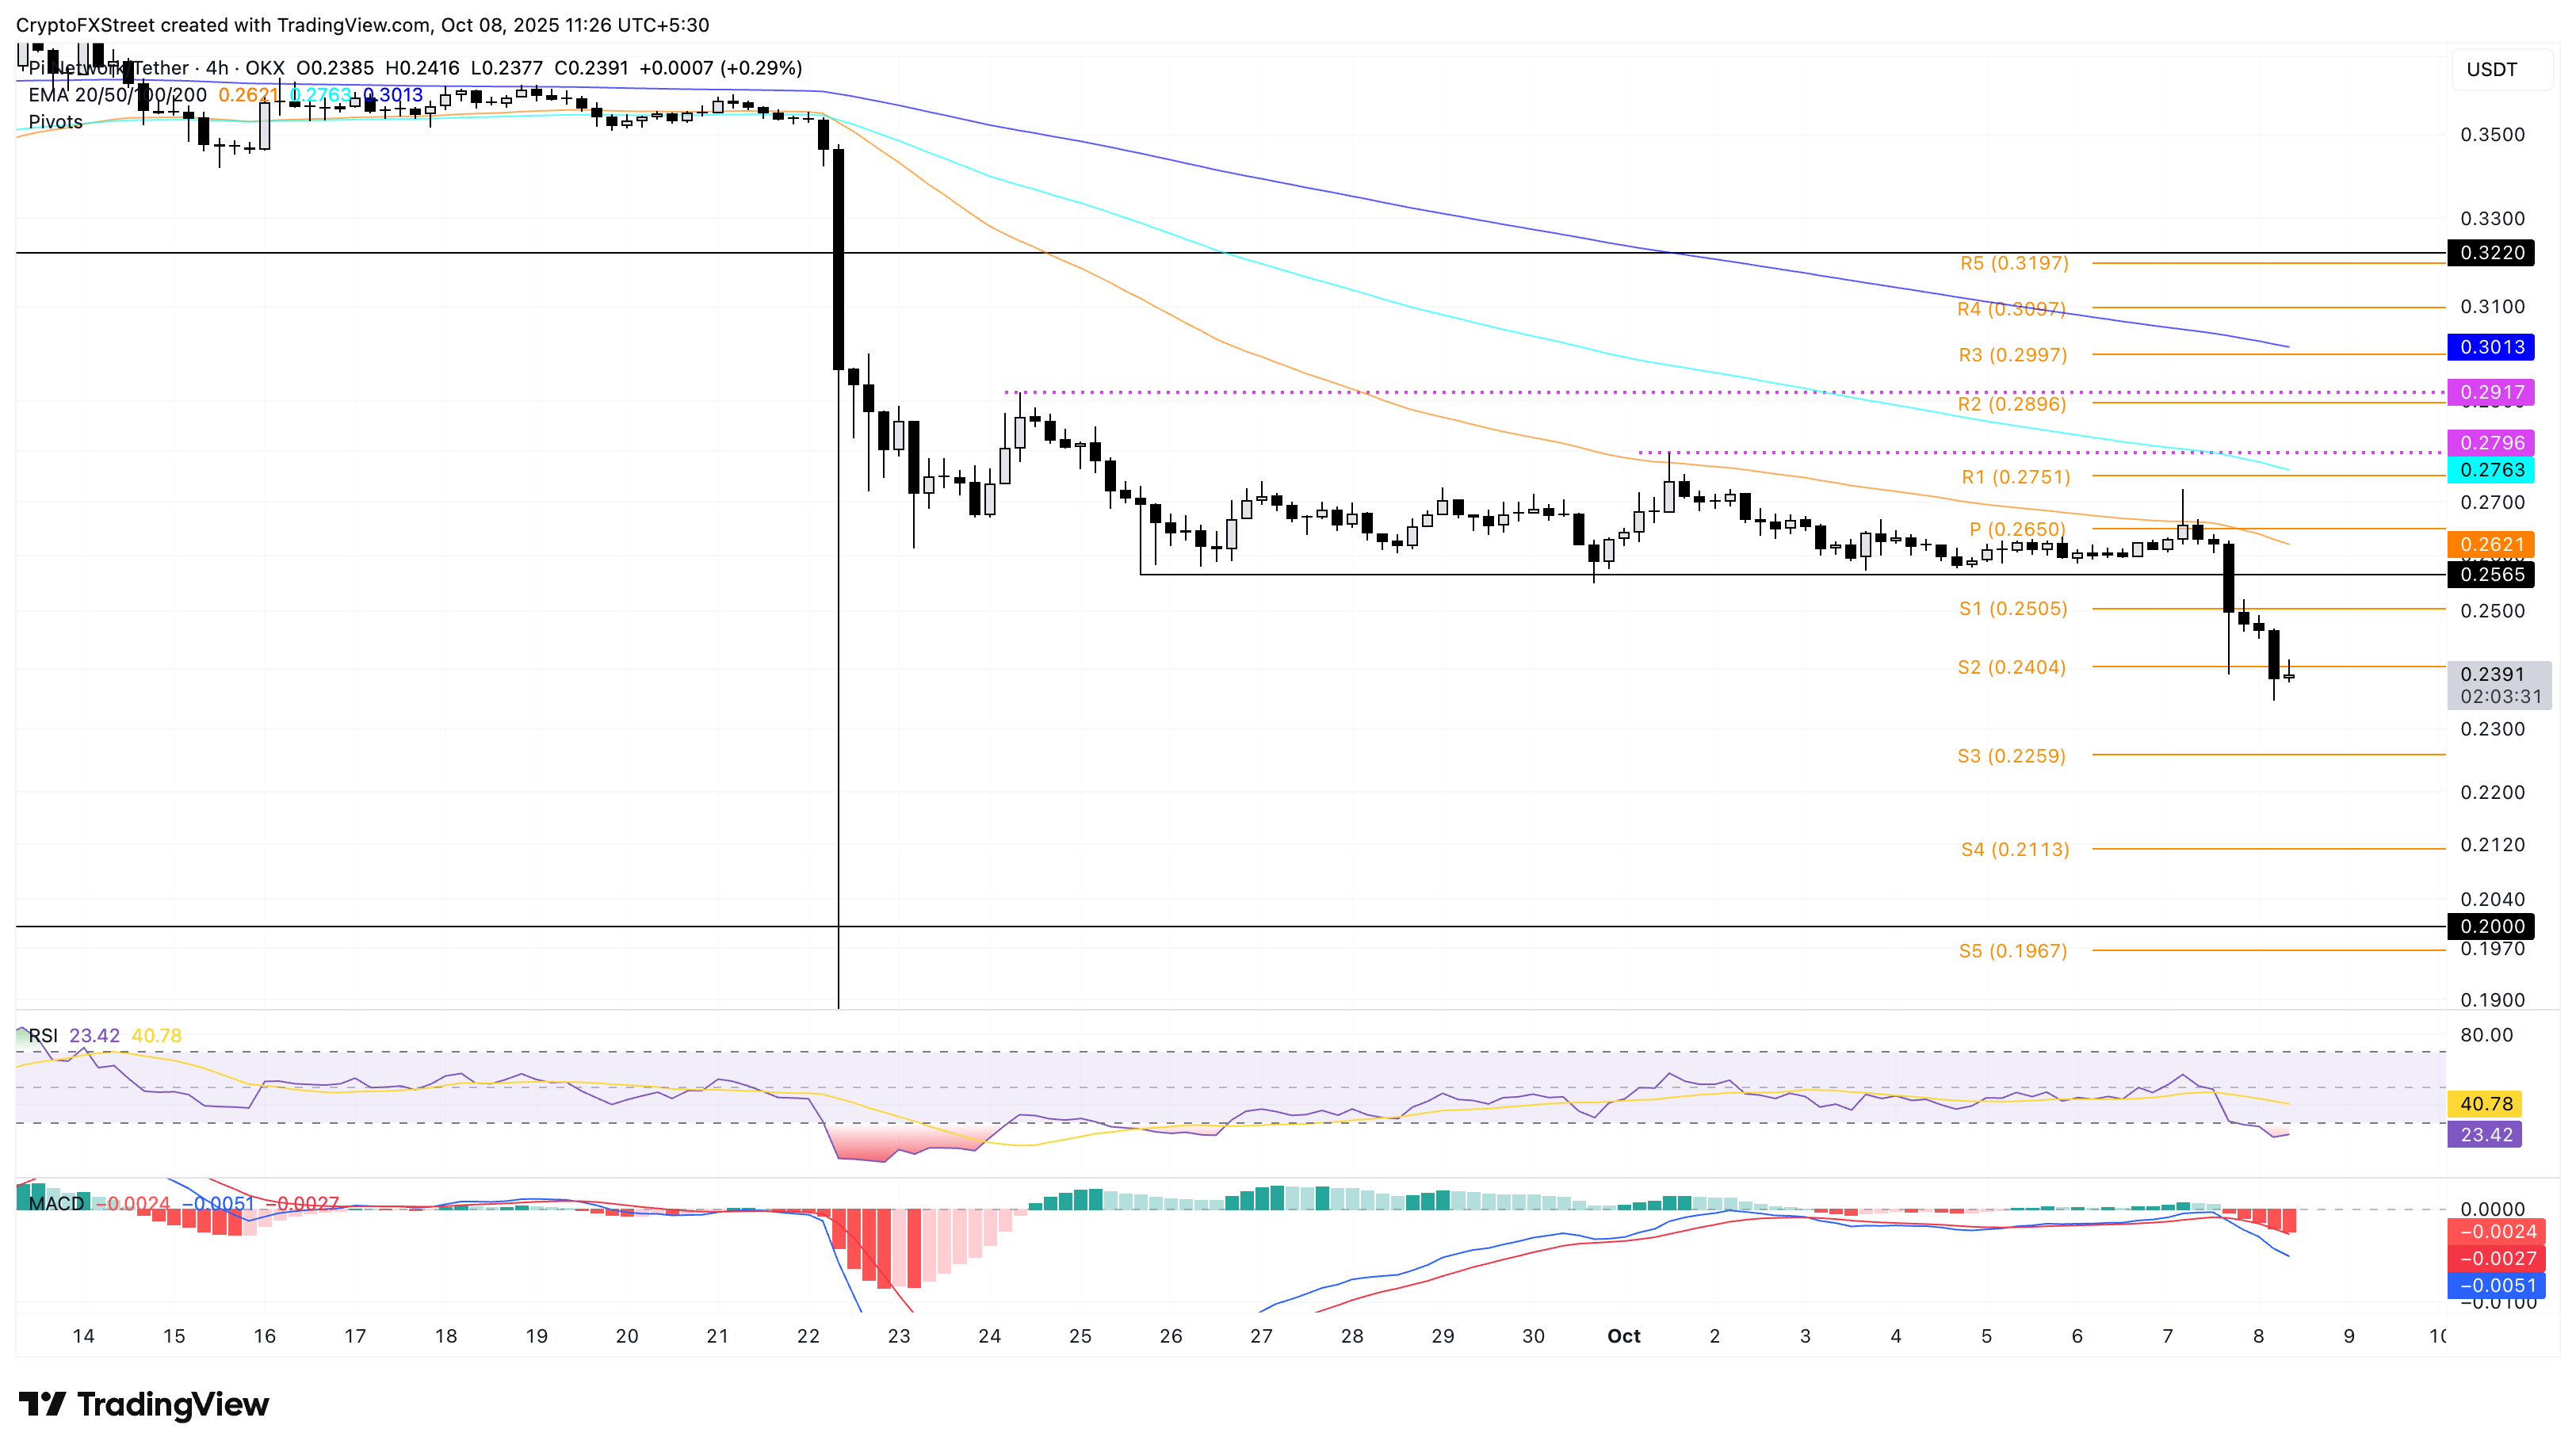
PI/USDT daily price chart.
Looking up, a bounce back in PI could be limited by the S2 and S1 support-turned-resistance Pivot Point levels at $0.2404 and $0.2505, respectively.
Bitcoin, altcoins, stablecoins FAQs
Bitcoin is the largest cryptocurrency by market capitalization, a virtual currency designed to serve as money. This form of payment cannot be controlled by any one person, group, or entity, which eliminates the need for third-party participation during financial transactions.
Altcoins are any cryptocurrency apart from Bitcoin, but some also regard Ethereum as a non-altcoin because it is from these two cryptocurrencies that forking happens. If this is true, then Litecoin is the first altcoin, forked from the Bitcoin protocol and, therefore, an “improved” version of it.
Stablecoins are cryptocurrencies designed to have a stable price, with their value backed by a reserve of the asset it represents. To achieve this, the value of any one stablecoin is pegged to a commodity or financial instrument, such as the US Dollar (USD), with its supply regulated by an algorithm or demand. The main goal of stablecoins is to provide an on/off-ramp for investors willing to trade and invest in cryptocurrencies. Stablecoins also allow investors to store value since cryptocurrencies, in general, are subject to volatility.
Bitcoin dominance is the ratio of Bitcoin's market capitalization to the total market capitalization of all cryptocurrencies combined. It provides a clear picture of Bitcoin’s interest among investors. A high BTC dominance typically happens before and during a bull run, in which investors resort to investing in relatively stable and high market capitalization cryptocurrency like Bitcoin. A drop in BTC dominance usually means that investors are moving their capital and/or profits to altcoins in a quest for higher returns, which usually triggers an explosion of altcoin rallies.
Bài viết đề xuất


