
Crypto Today: Bitcoin, Ethereum, XRP volatility tests weak hands as crypto liquidations hit $1.7 billion
- Bitcoin slides 4.5% from last week's peak as risk-off sentiment sweeps across the crypto market.
- Ethereum drops below the 50-day EMA, increasing the risk of a further decline to the $4,000 level.
- XRP extends decline below $3.00 as sellers eye the 200-day EMA support.
Bitcoin (BTC) starts the new week on the back foot, as risk-averse sentiment triggers liquidations across the cryptocurrency market. Amidst the sudden increase in volatility, BTC prolongs the decline to slightly above $112,000 at the time of writing on Monday.
Altcoins led by Ethereum (ETH) and Ripple (XRP) are mostly in the red, with the largest smart contracts token, ETH, sliding below the $4,200 level. Meanwhile, XRP extends its down leg significantly below the critical $3.00 level, as supply continues to overshadow demand.
Data spotlight: Bitcoin leads sell-off as crypto liquidations surge
The broad sell-off in the cryptocurrency market has left many leveraged traders counting losses as volatility intensifies. According to CoinGlass data, total liquidations over the past 24 hours have reached $1.7 billion, with long positions accounting for $1.61 billion. The remaining liquidations, approximately $84 million, affected short position holders.
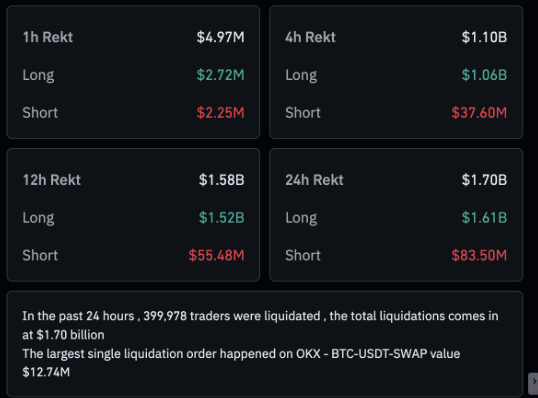
Crypto liquidation heatmap | Source: CoinGlass
Liquidations in Bitcoin totaled approximately $269 million in long positions and $6 million in short positions, reflecting the risk-off sentiment sweeping across the broader cryptocurrency market.
Seller dominance in Bitcoin markets could prolong the correction in the coming days unless investors buy the dip, steadying the tailwind on the asset, which is generally perceived as digital Gold.
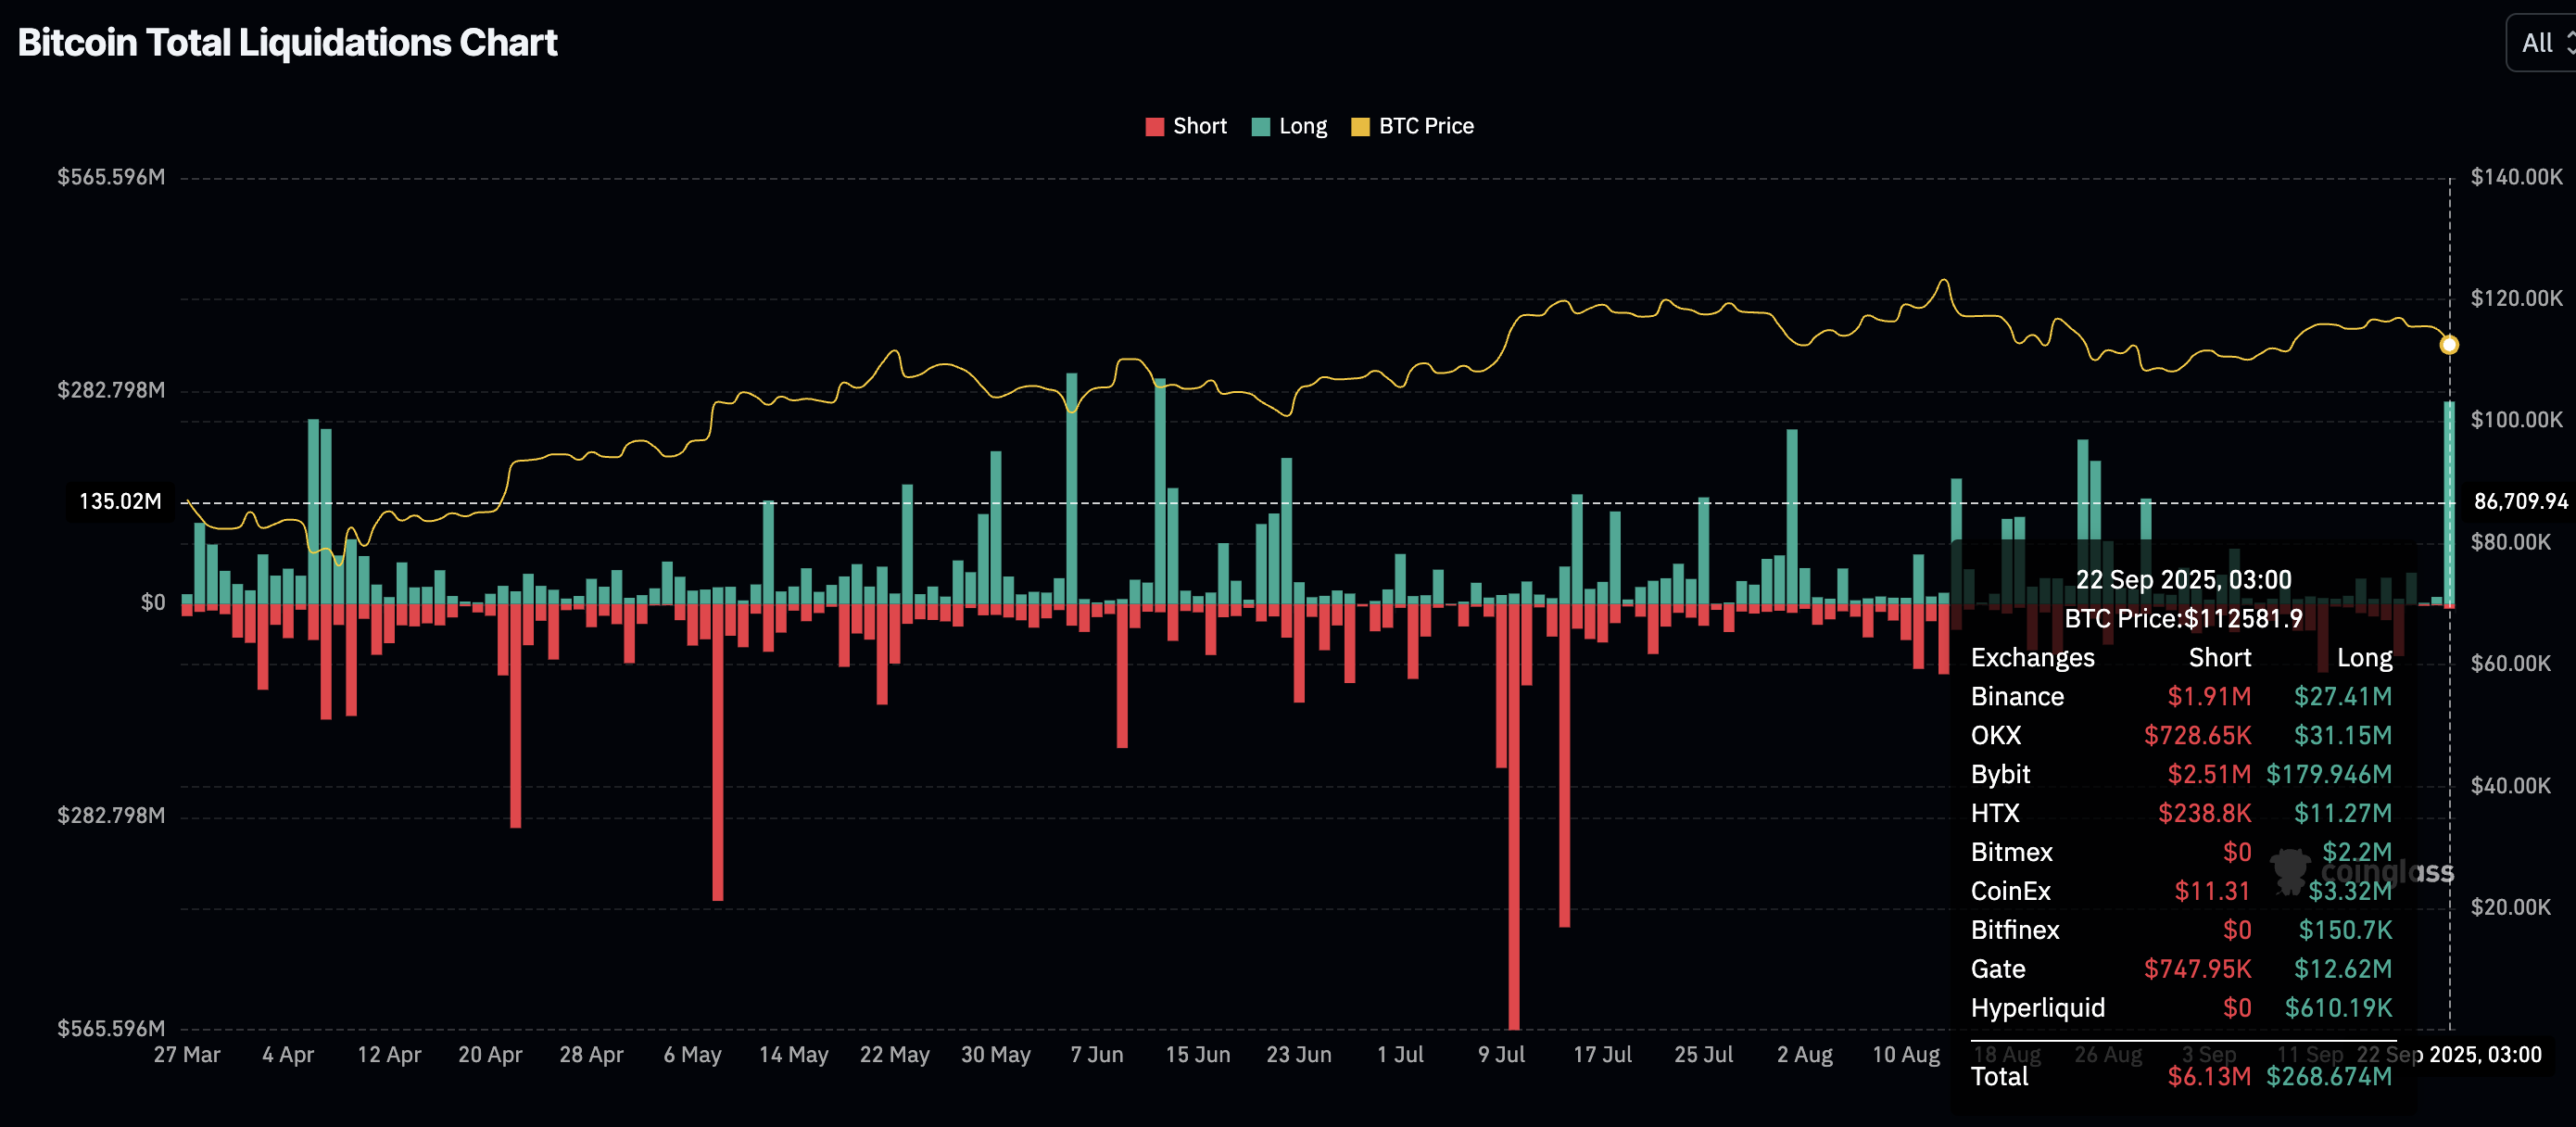
Bitcoin liquidations | Source: CoinGlass
Ethereum traders faced the largest liquidations totalling $466 million in long positions and approximately $18 million in shorts. Interest in Ethereum has improved in the previous week, when its technical outlook signaled bullish sentiment toward its record high of $4,956. As liquidations surge, attention could shift to lower support levels, including $4,000.
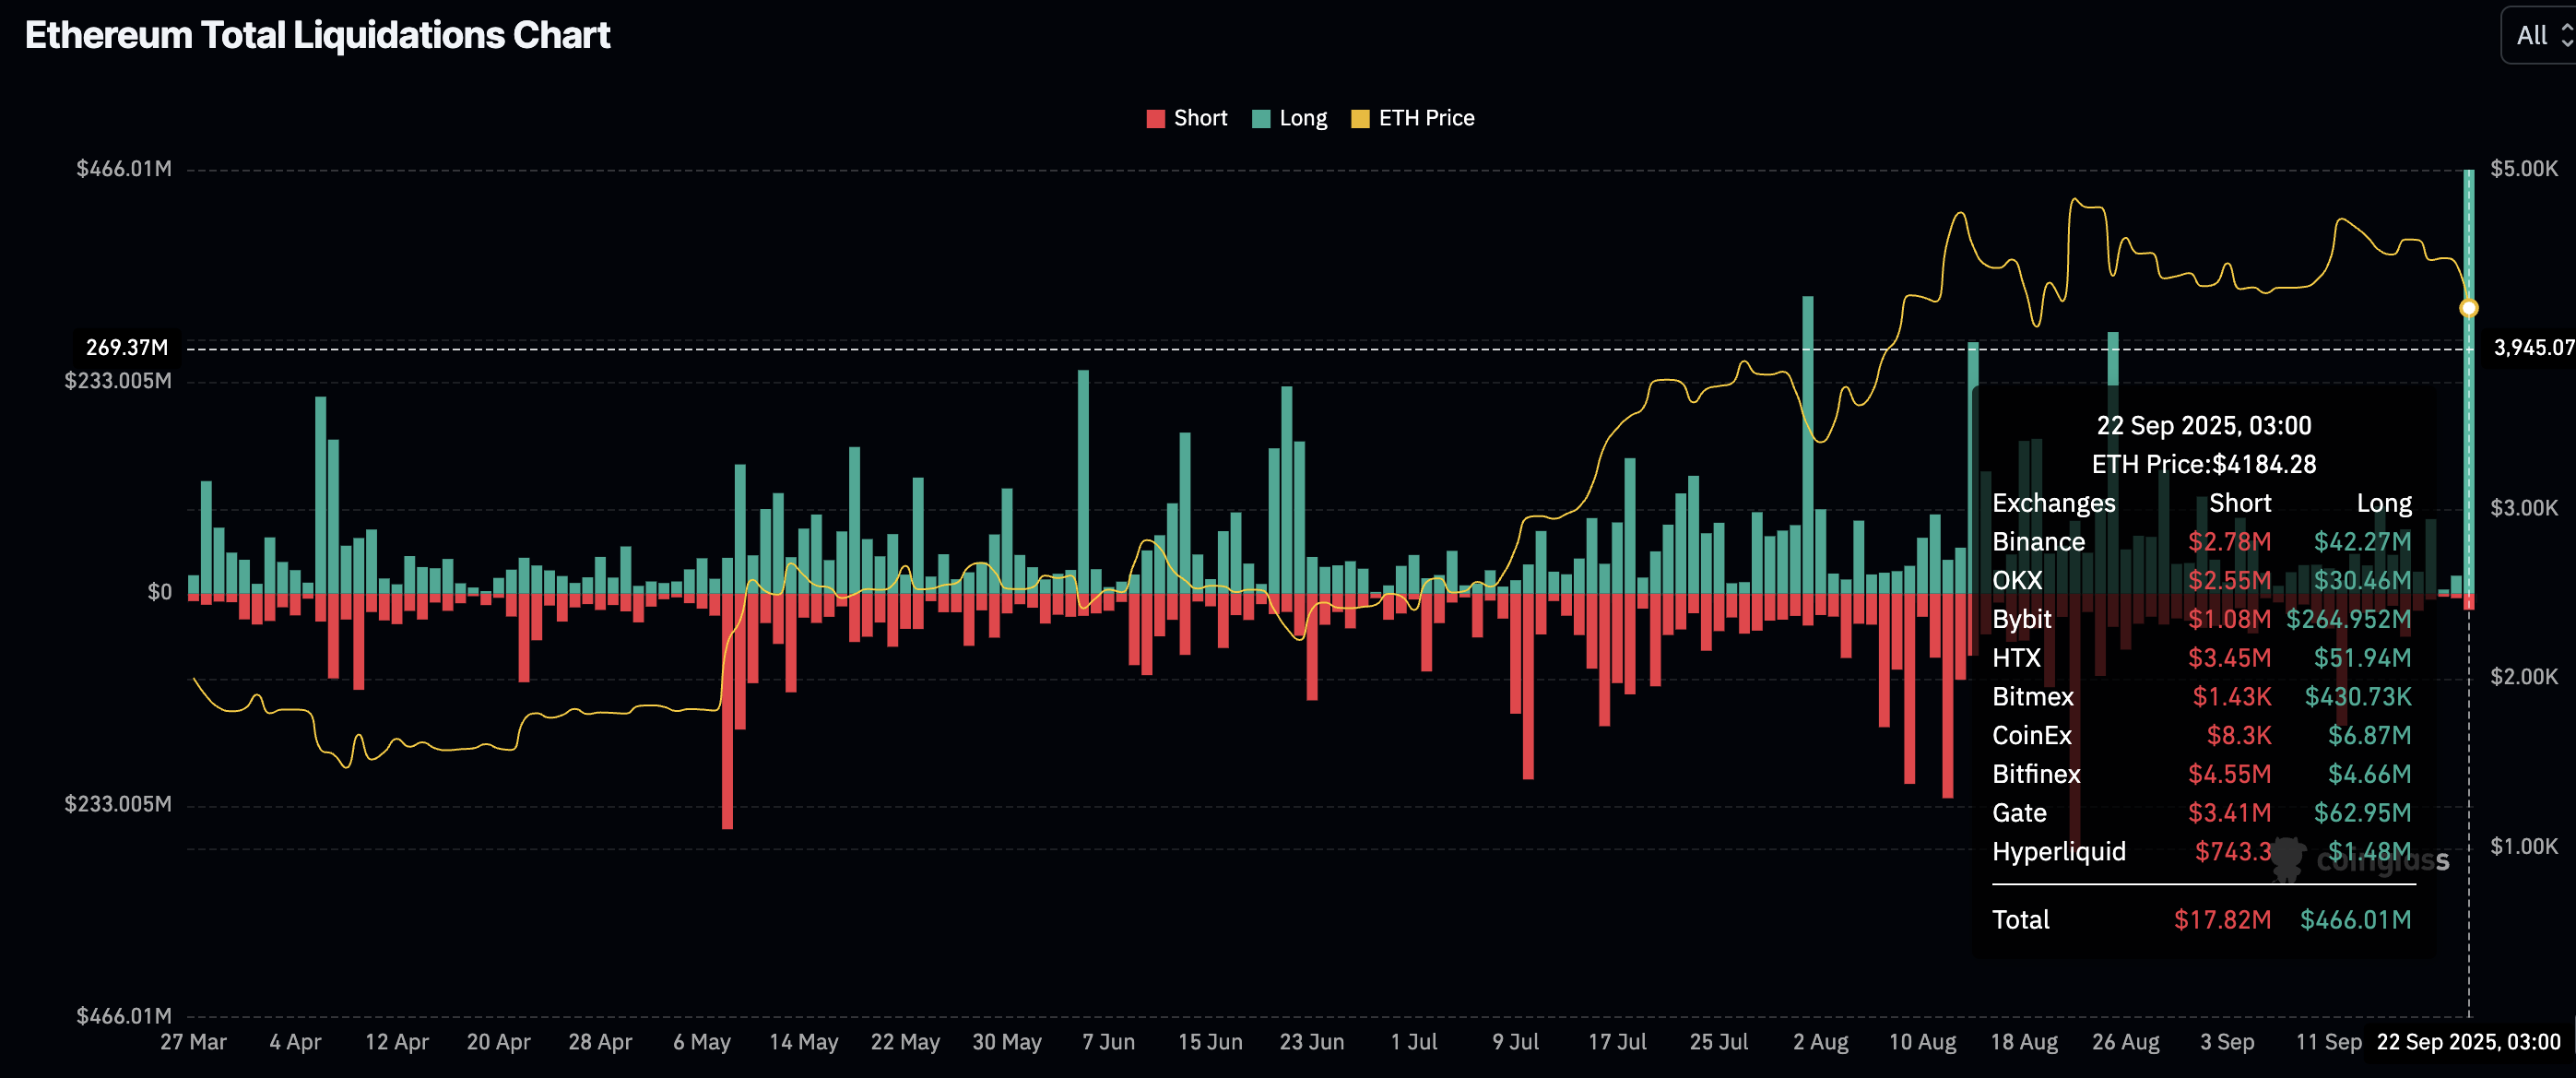
Ethereum liquidations | Source: CoinGlass
XRP traders were not spared the pain, with liquidations swelling to approximately $74 million in long positions and $814,000 in shorts. XRP exhibits weakness after breaking below the $3.00 pivotal level, with downside risks currently pointing toward lower demand areas, such as $2.50.
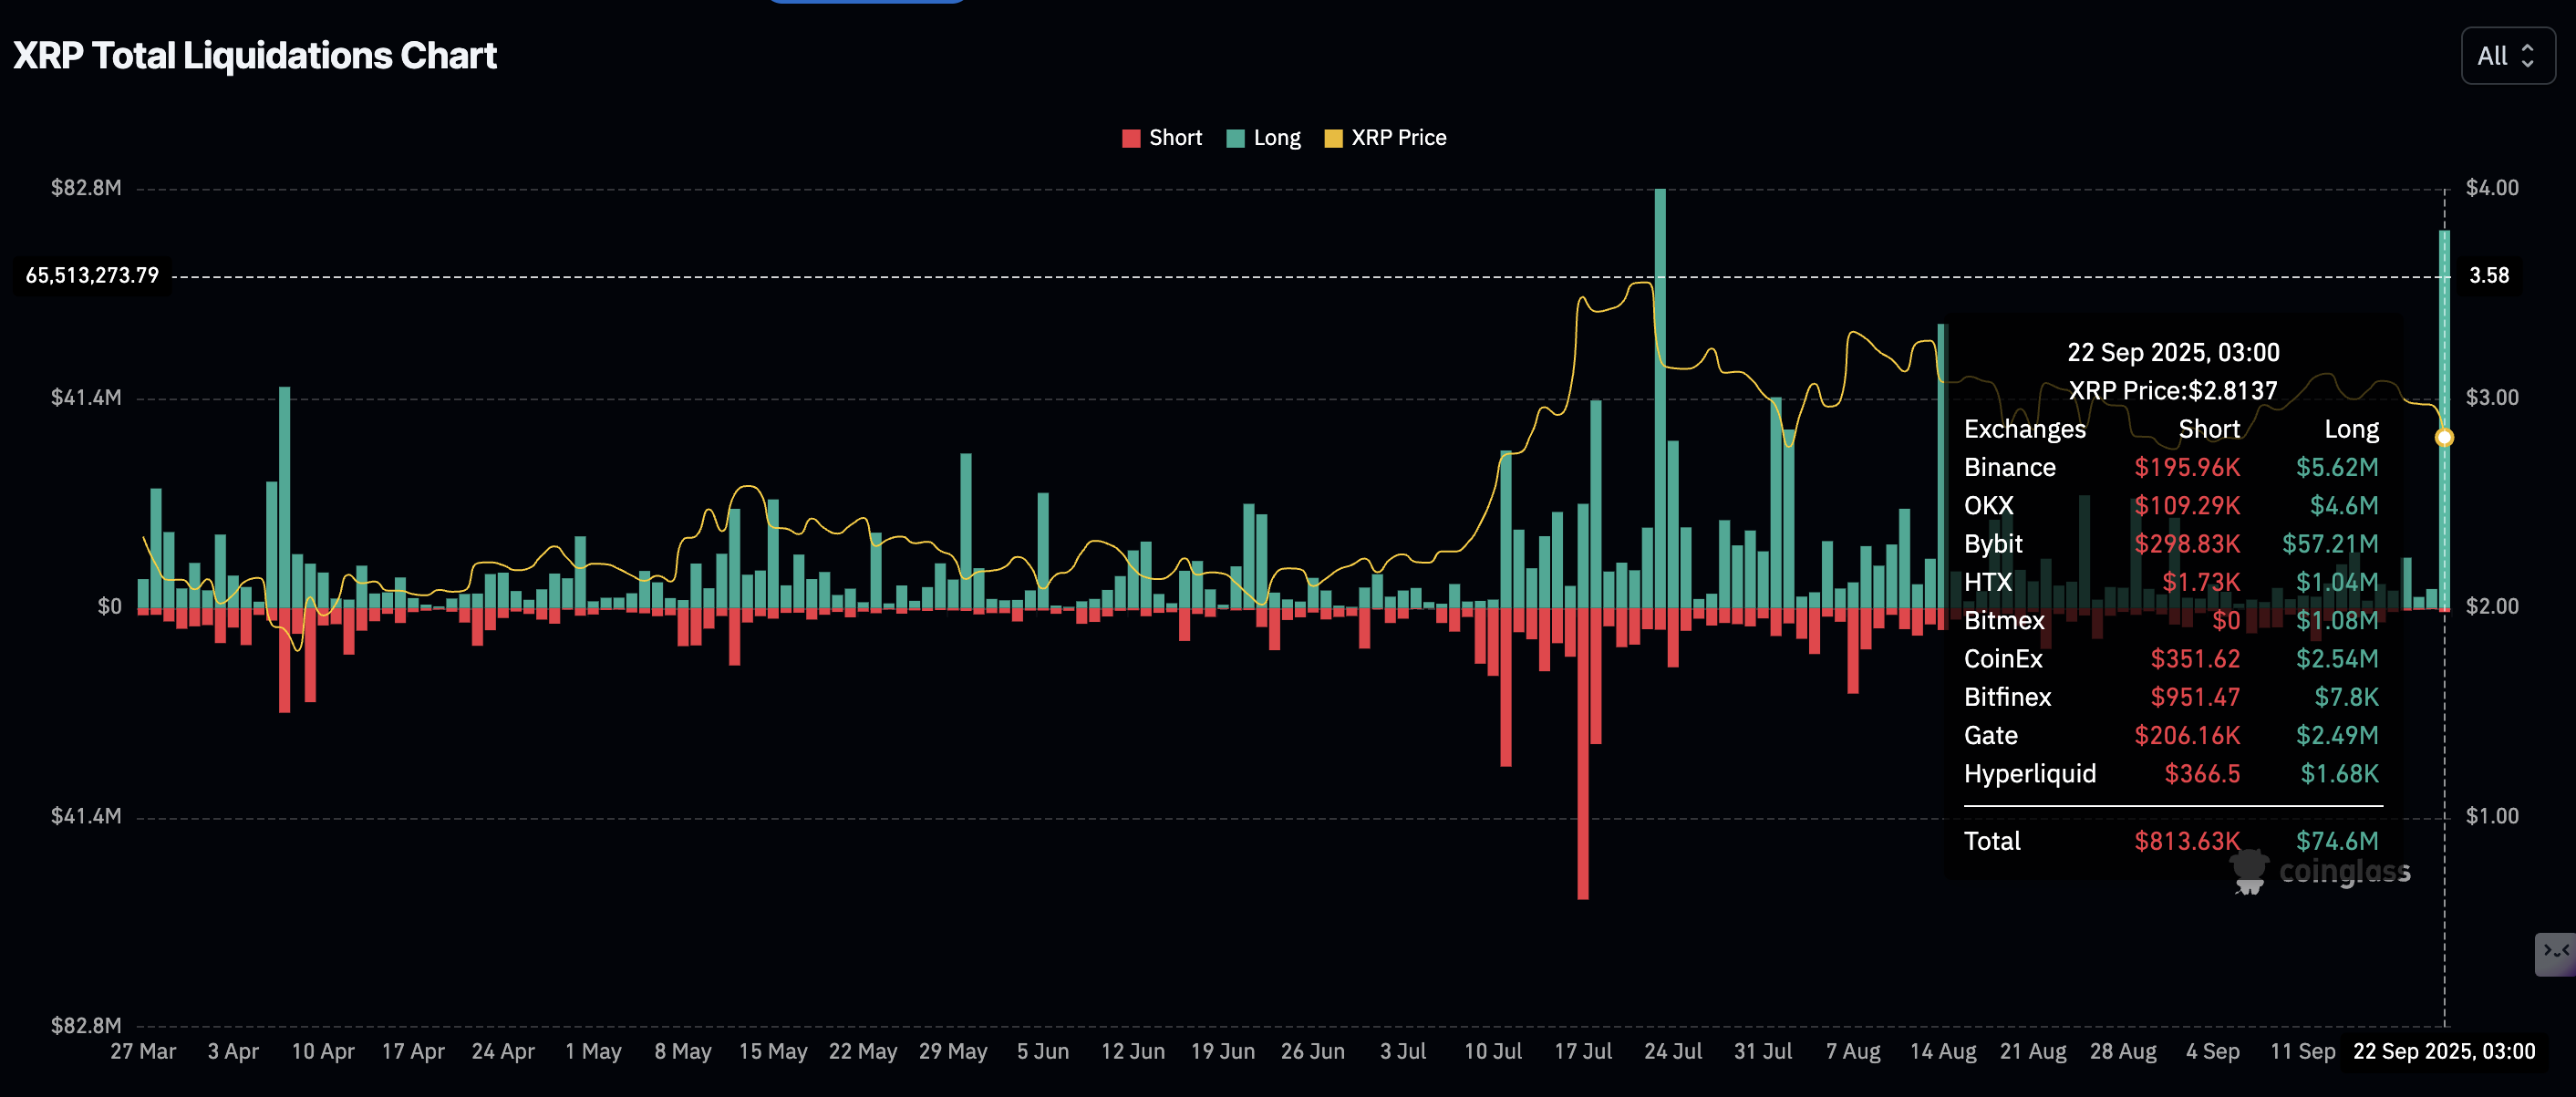
XRP liquidations | Source: CoinGlass
Chart of the day: How far could Bitcoin decline?
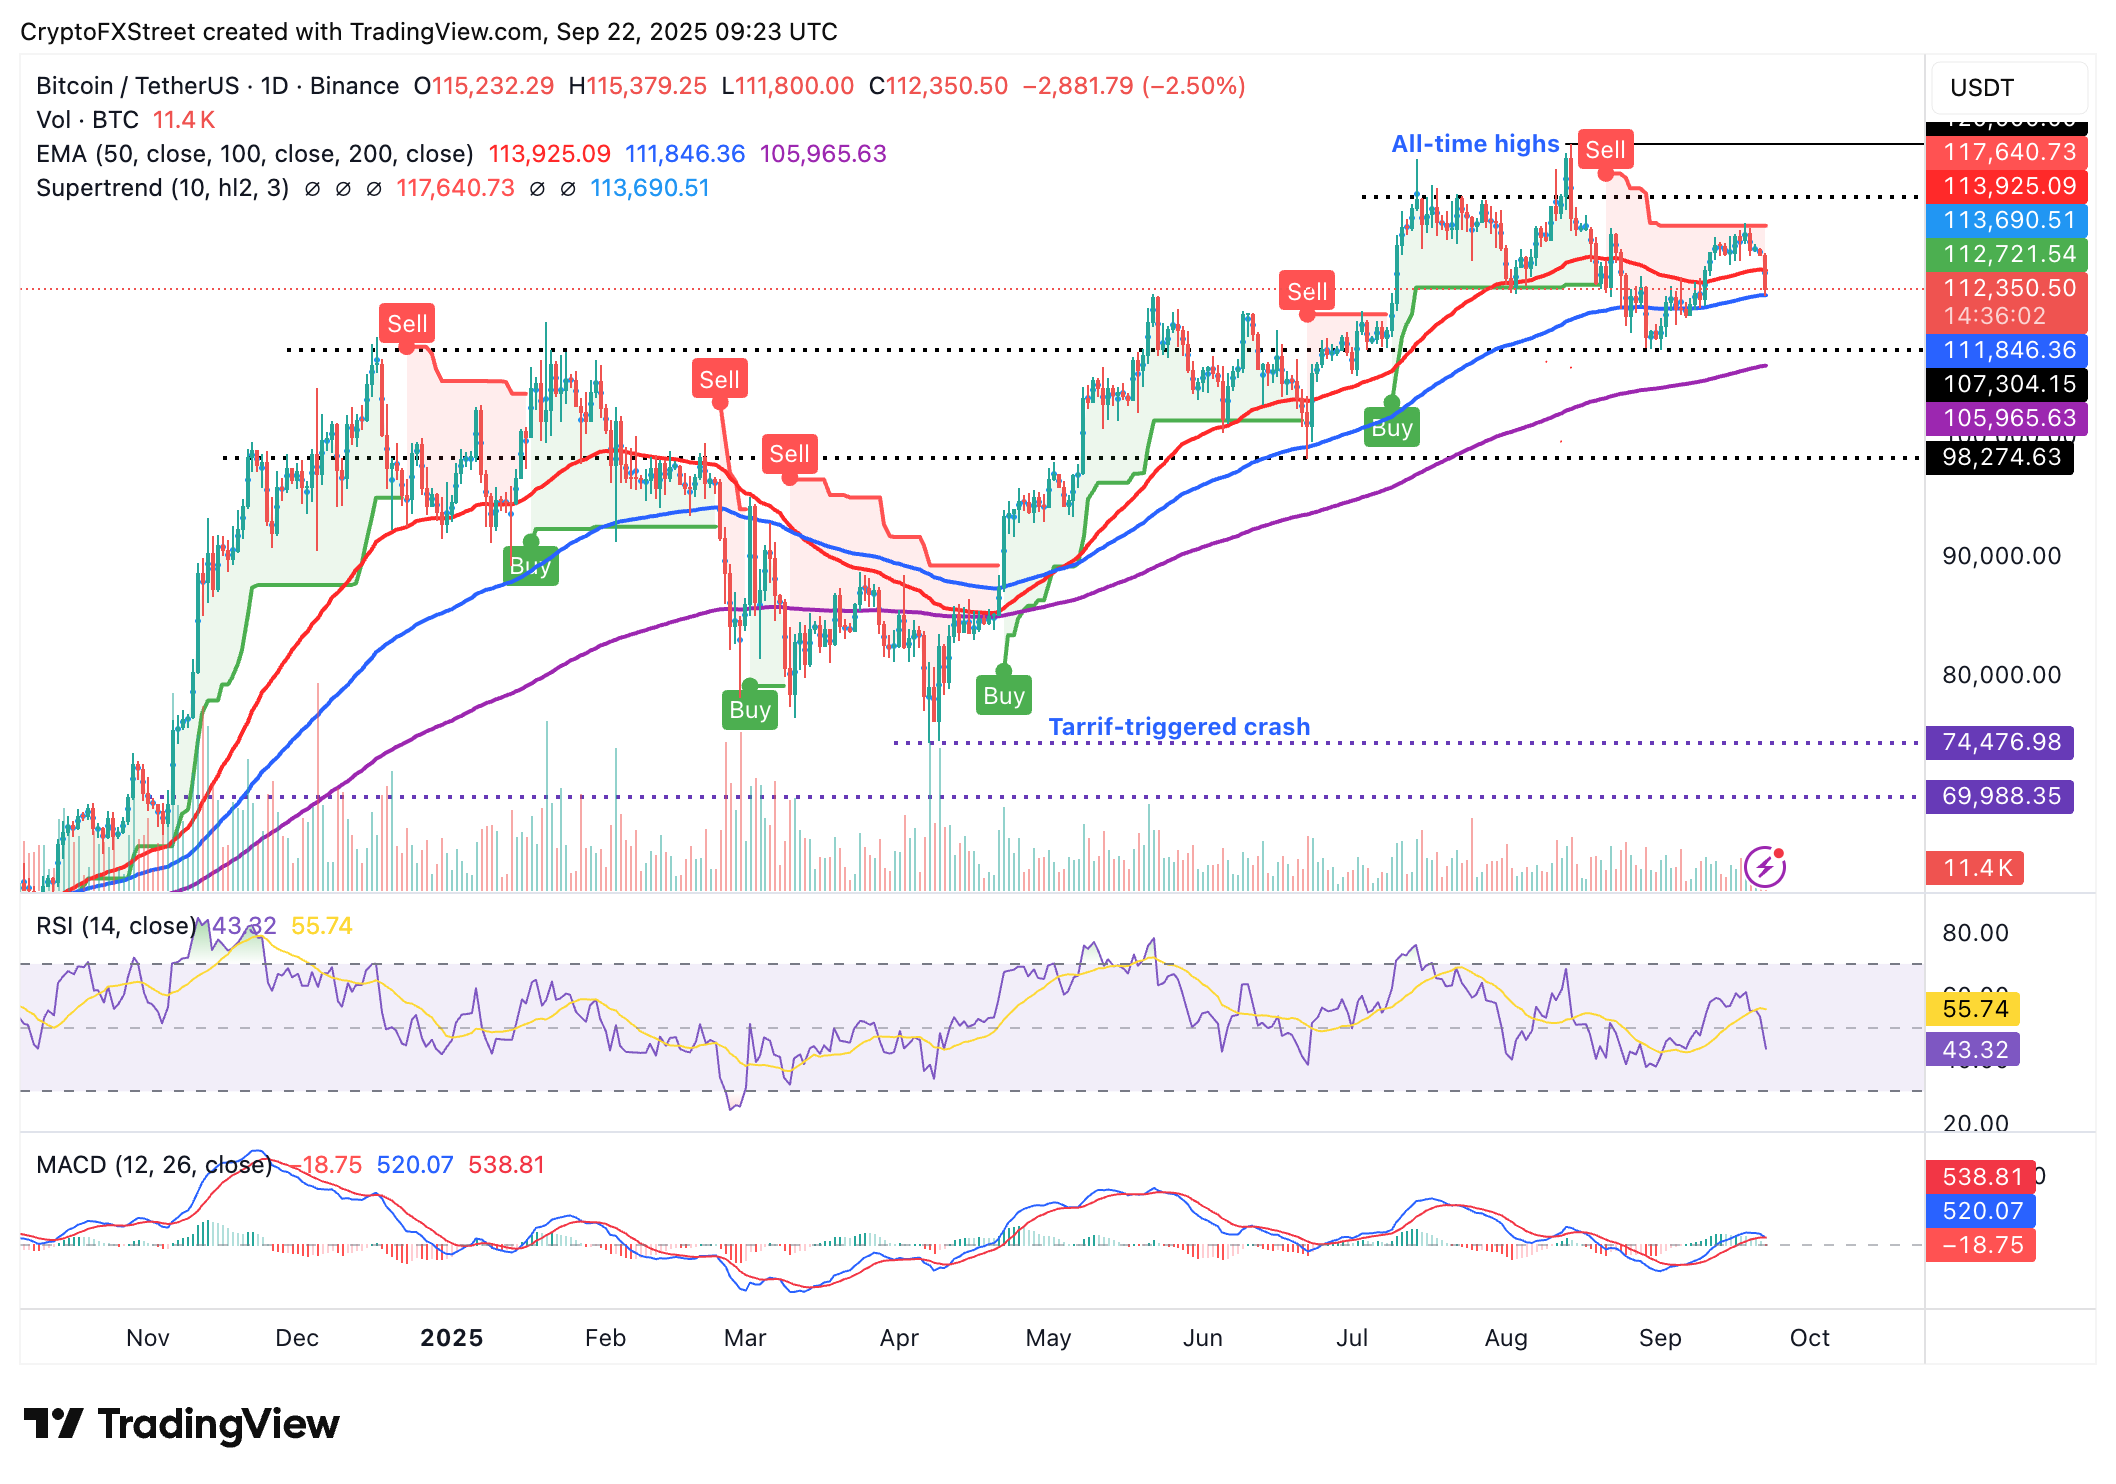
Bitcoin is currently holding slightly above $112,000 at the time of writing on Monday, with the 100-day Exponential Moving Average (EMA) providing support at $111,846.
A sharp decline in the Relative Strength Index (RSI) on the daily chart to 43 from last week's peak of 61 emphasizes the ongoing sell-off. If the RSI continues to drop toward oversold territory, it will signal fading bullish momentum and increase the chances of BTC slipping below the $110,000 round-figure support.
The Moving Average Convergence Divergence (MACD) is on the verge of validating a sell signal on the daily chart, which would occur with the blue line crossing below the red signal line. A sell signal could compel traders to de-risk further, adding pressure to weakening support levels.
Other than the 100-day EMA at $111,846, key tentative support levels include the demand at $107,304, which was previously tested on September 1, and the 200-day EMA at $105,965.
BTC/USDT daily chart
Altcoins update: Ethereum and XRP offer bearish signals
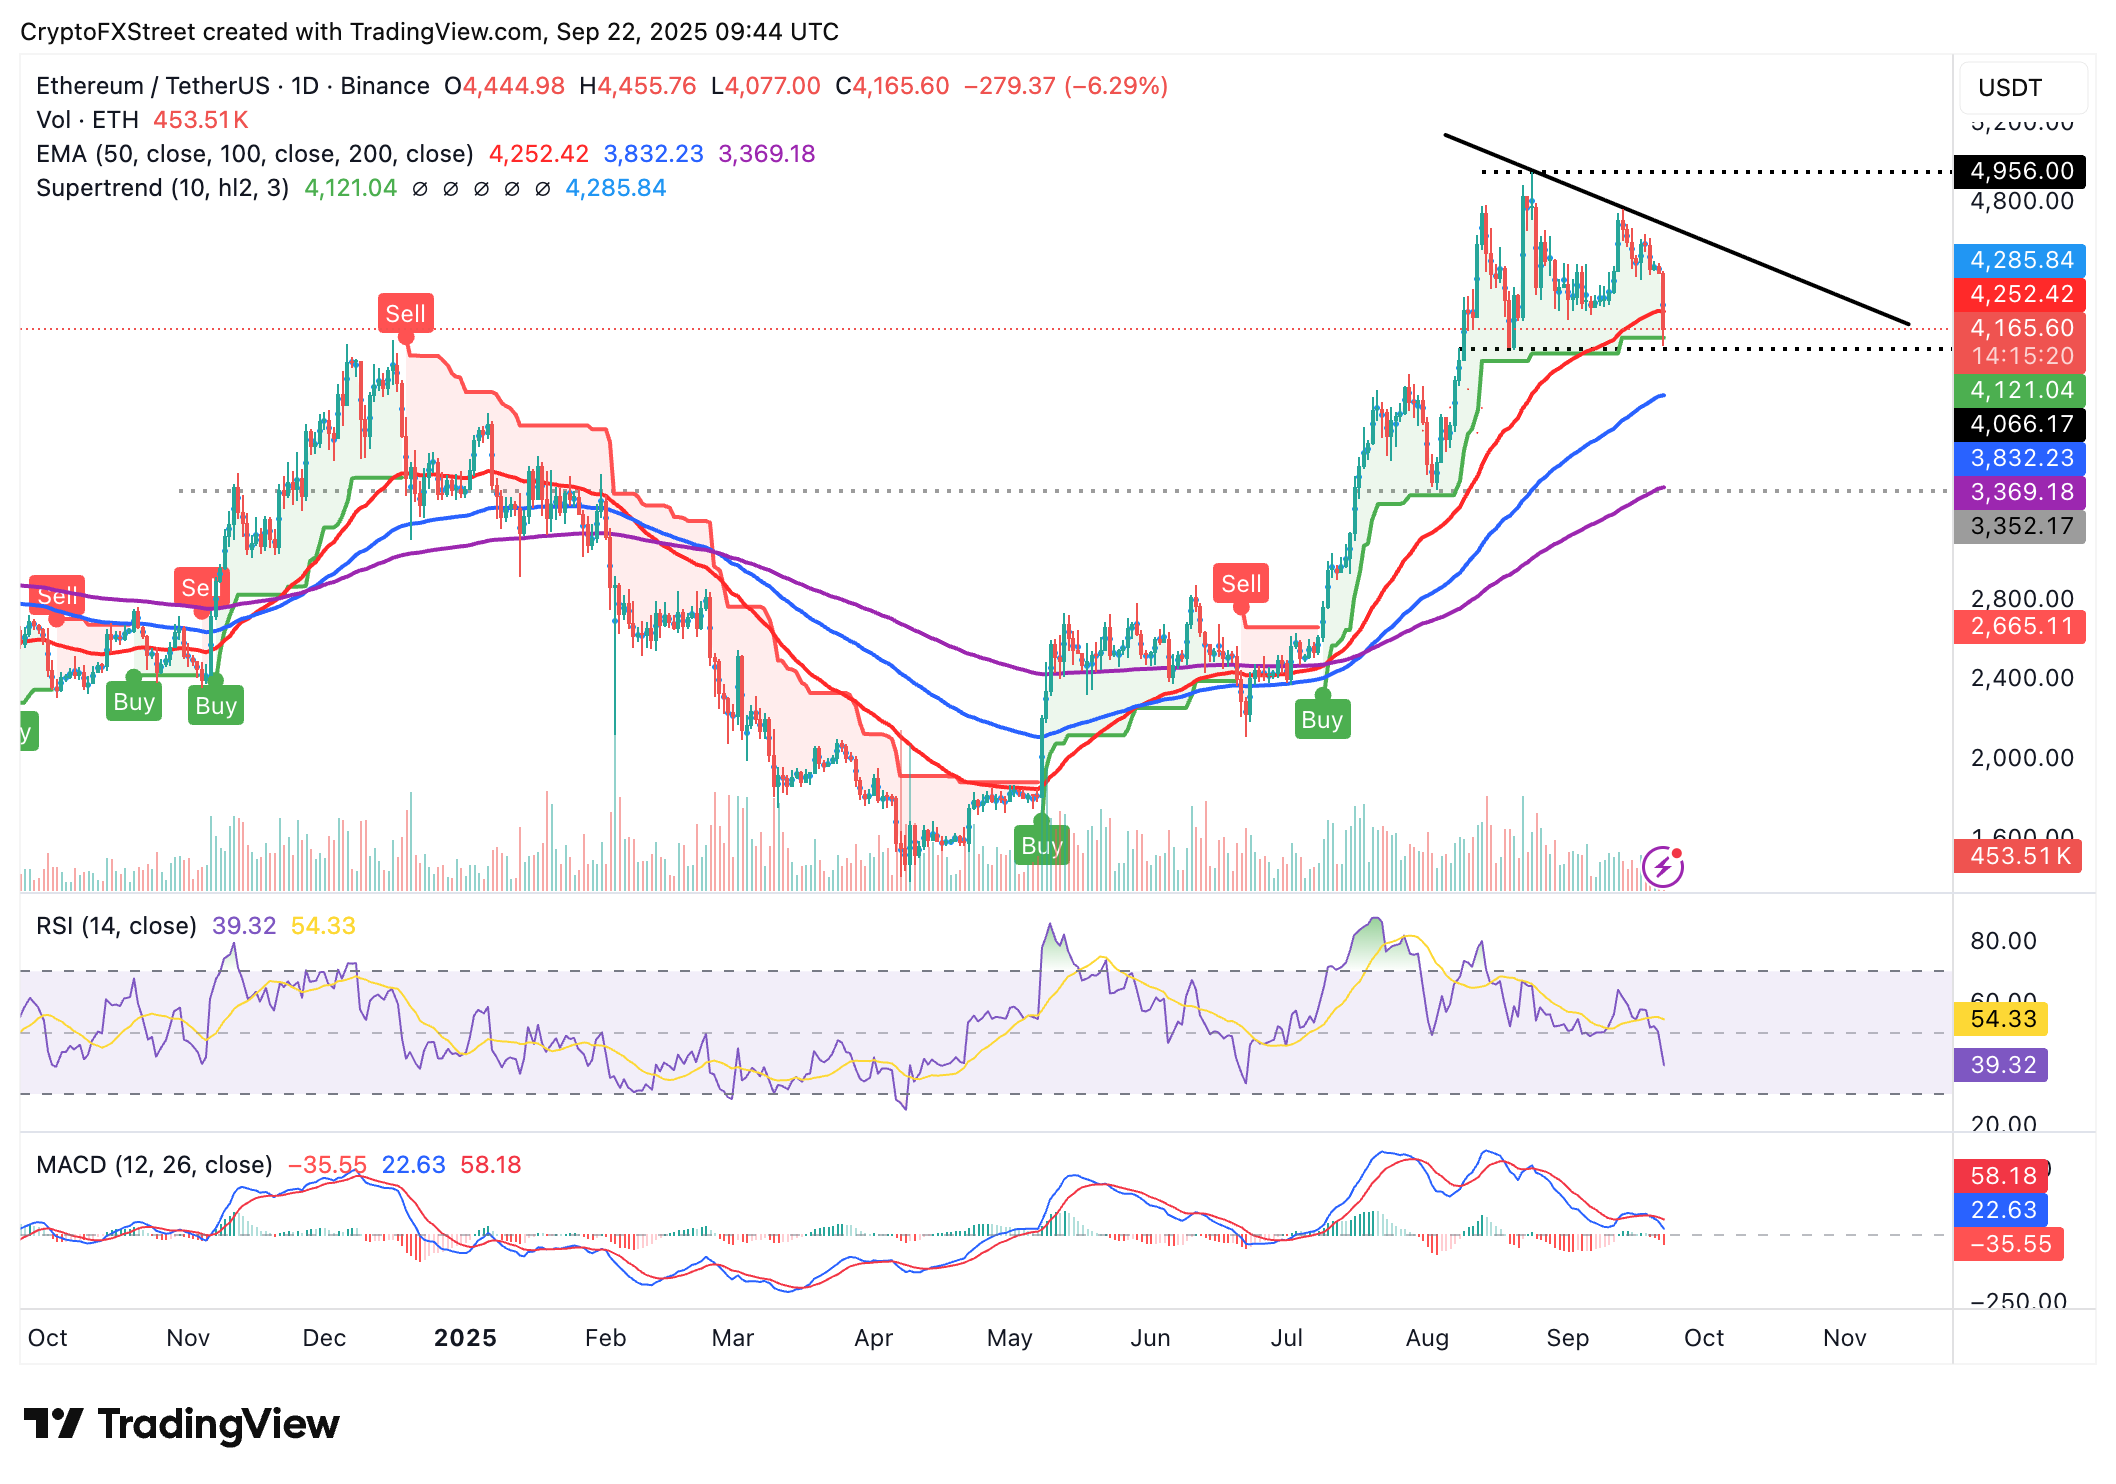
Ethereum trades below the 50-day EMA, which has turned into resistance at $4,252 at time of writing. Meanwhile, key technical signals suggest that the down leg could extend in upcoming sessions, with the price of ETH likely to retest the round-number support at $4,000.
The RSI at 39 is falling toward the oversold region, indicating a stronger bearish grip, while the MACD sell signal on the daily chart shows that bearish momentum is intensifying.
If the wider risk-off dominates this week's trading, the sell-off could bring traders' attention to the 100-day EMA at $3,832 and the 200-day EMA at $3,369. For now, the path of least resistance appears downward, unless investors buy the dip and Ethereum reclaims the 50-day EMA support at $4,252.
ETH/USDT daily chart
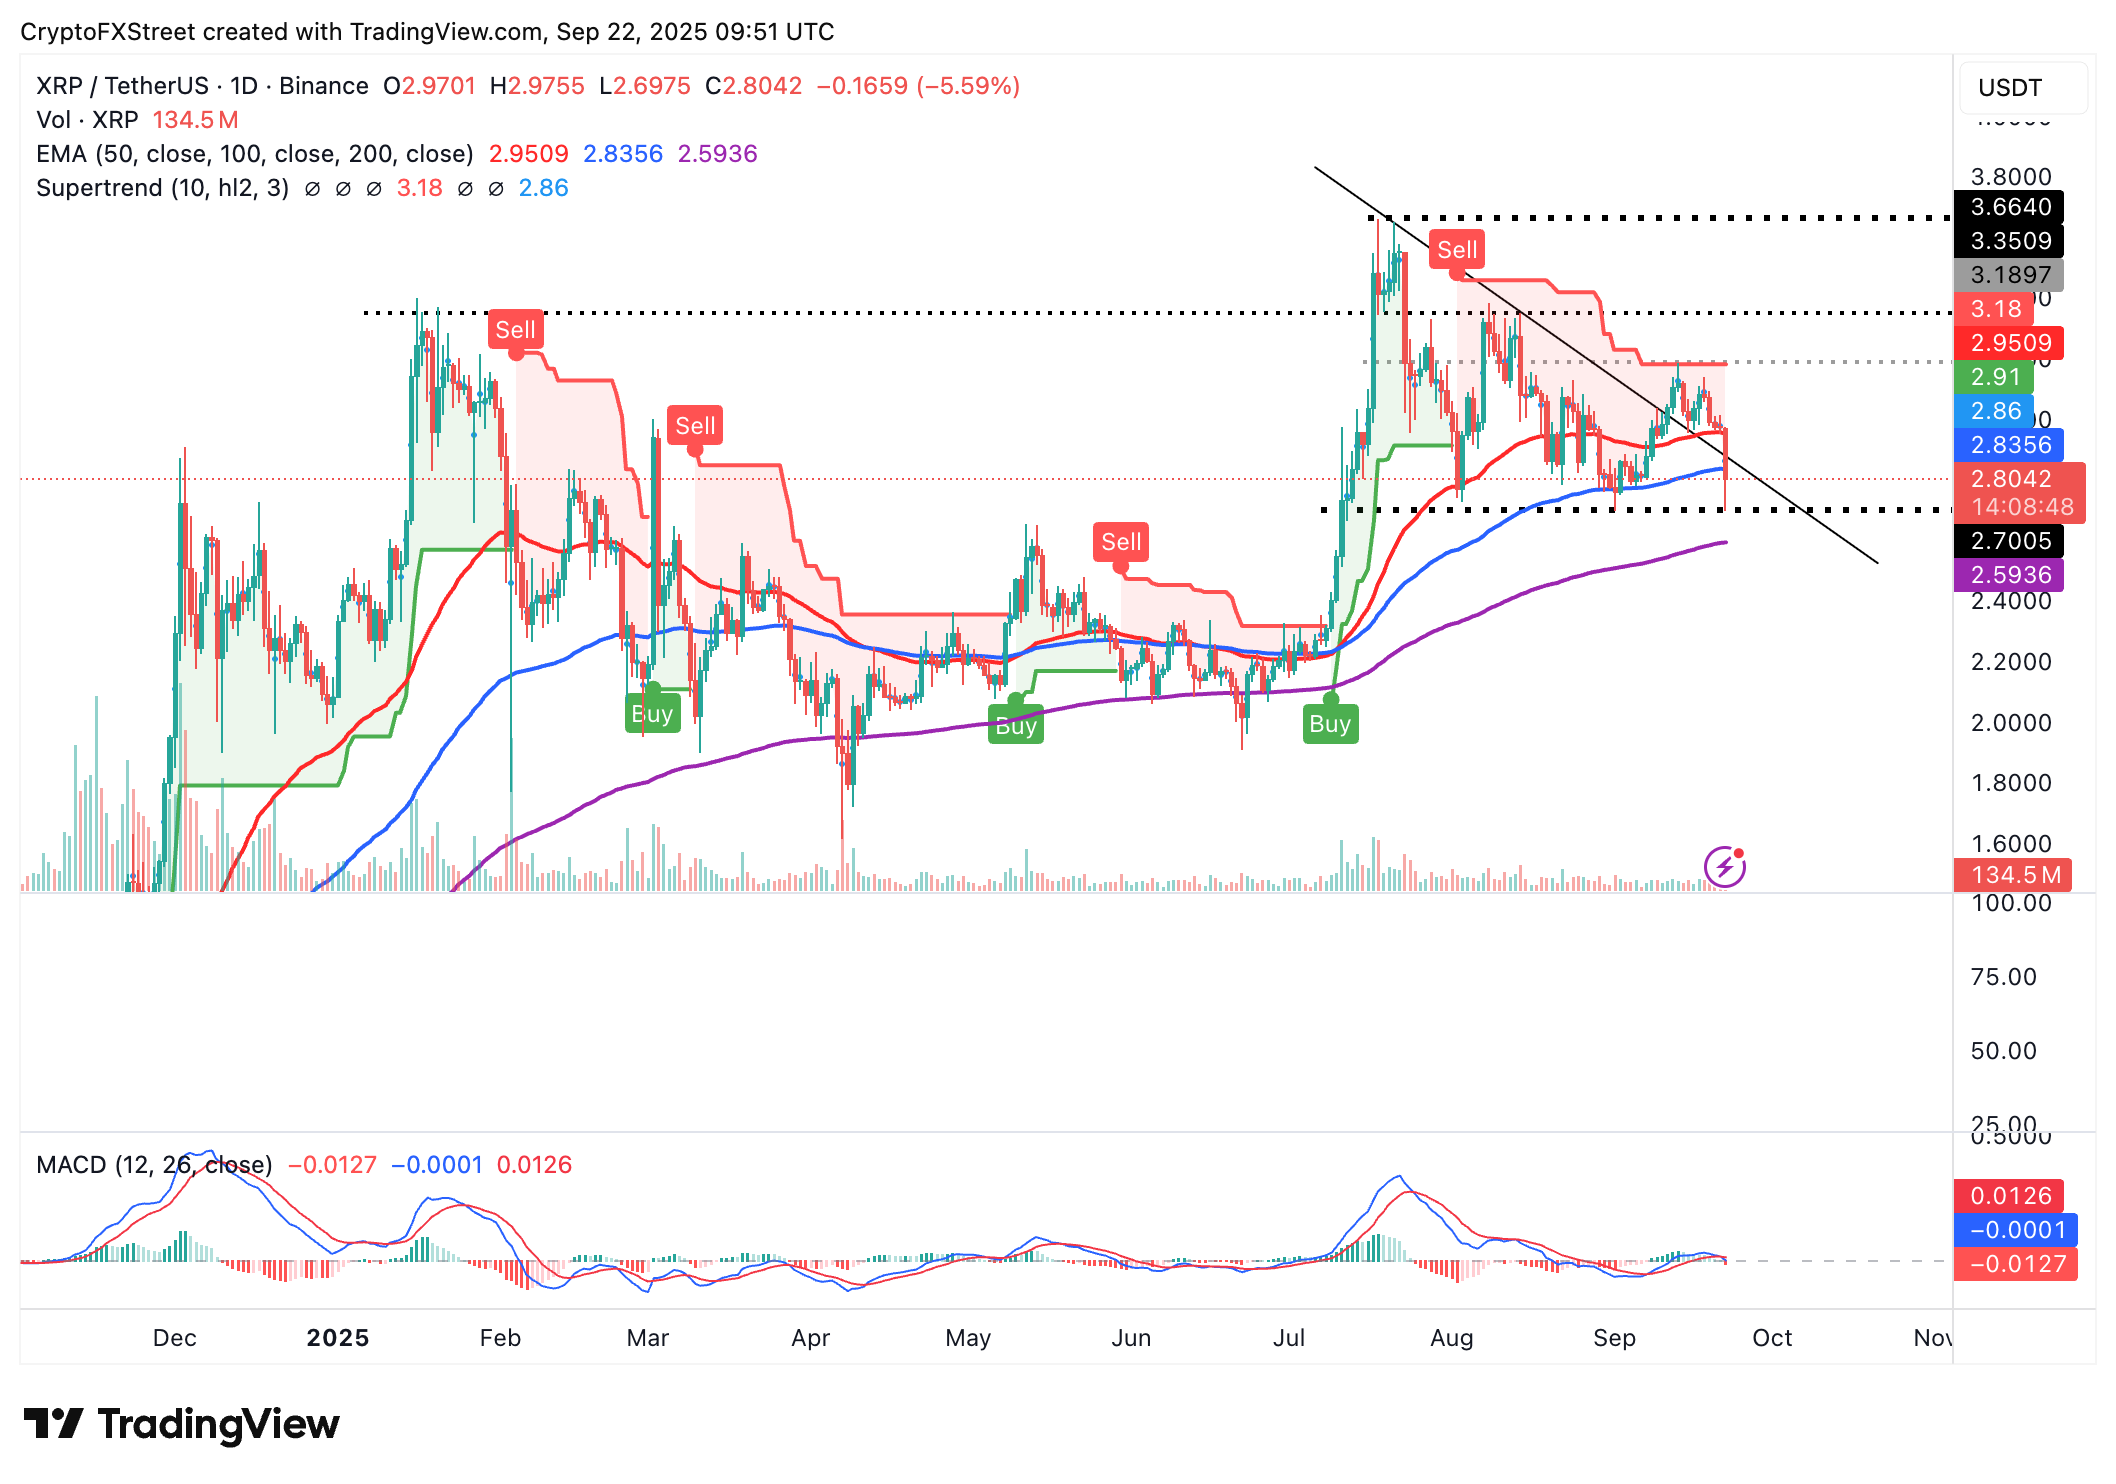
As for XRP, sellers have regained control of the trend, accelerating declines below the $3.00 critical level. The cross-border money remittance token currency holds below the 50-day EMA at $2.95 and the 100-day EMA at $2.83, which provided support last week.
A sell signal from the MACD indicator reinforces the bearish sentiment. If the blue line remains below the red signal line, risk-off sentiment could hold the path of least resistance downward, as investors increasingly de-risk.
XRP/USDT daily chart
If the down leg extends further below the 100-day EMA, the next tentative support lies at $2.70, tested by a candle wick earlier in the day, and the 200-day EMA at $2.59. Still, a reversal above the $3.00 level cannot be ruled out, especially if traders buy the dip, thus fuelling a price recovery.
Bitcoin, altcoins, stablecoins FAQs
Bitcoin is the largest cryptocurrency by market capitalization, a virtual currency designed to serve as money. This form of payment cannot be controlled by any one person, group, or entity, which eliminates the need for third-party participation during financial transactions.
Altcoins are any cryptocurrency apart from Bitcoin, but some also regard Ethereum as a non-altcoin because it is from these two cryptocurrencies that forking happens. If this is true, then Litecoin is the first altcoin, forked from the Bitcoin protocol and, therefore, an “improved” version of it.
Stablecoins are cryptocurrencies designed to have a stable price, with their value backed by a reserve of the asset it represents. To achieve this, the value of any one stablecoin is pegged to a commodity or financial instrument, such as the US Dollar (USD), with its supply regulated by an algorithm or demand. The main goal of stablecoins is to provide an on/off-ramp for investors willing to trade and invest in cryptocurrencies. Stablecoins also allow investors to store value since cryptocurrencies, in general, are subject to volatility.
Bitcoin dominance is the ratio of Bitcoin's market capitalization to the total market capitalization of all cryptocurrencies combined. It provides a clear picture of Bitcoin’s interest among investors. A high BTC dominance typically happens before and during a bull run, in which investors resort to investing in relatively stable and high market capitalization cryptocurrency like Bitcoin. A drop in BTC dominance usually means that investors are moving their capital and/or profits to altcoins in a quest for higher returns, which usually triggers an explosion of altcoin rallies.
Bài viết đề xuất


