
Bitcoin Weekly Forecast: BTC extends recovery as market readies for Fed rate cut
- Bitcoin price steadies around $115,000 on Friday, extending its two-week recovery since early September.
- Institutional inflows of $1.70 billion, alongside fresh BTC purchases by Metaplanet and MicroStrategy, support Bitcoin’s recovery.
- Markets fully price in a Fed rate reduction next week, with slight chances of a 50bps cut.
Bitcoin (BTC) steadies around $115,000 at the time of writing on Friday, having recovered nearly 4%. This recovery is further fueled by strong institutional inflows and renewed corporate accumulation this week. Market optimism is further supported by growing expectations of a Federal Reserve (Fed) rate cut next week, with traders even assigning a small probability to a larger 50-basis-point (bps) move.
Risk-on sentiment fuels BTC recovery
Bitcoin price started the week on a positive note, extending its recovery by nearly 4%, briefly trading around $115,000 on Friday. This recovery was further supported by the US macroeconomic data released this week.
On Wednesday, the US Producer Price Index (PPI) declined to 2.6% on a yearly basis in August, from 3.1% in the previous month. The core PPI, which excludes food and energy prices, came in at 2.8% YoY compared to 3.4% in July. The lack of producer price pressures, despite import tariffs, could be seen as a sign of softening domestic demand against the backdrop of a struggling US labor market.
This, in turn, reaffirms market expectations that the US Federal Reserve (Fed) will cut interest rates at its policy meeting next week, boosting risk-on sentiment. The S&P 500 and Nasdaq posted record highs at Wednesday's close. Meanwhile, riskier assets such as BTC reached $114,331 during the same day.
The positive tone around the crypto and equities markets further emerged on Thursday after the US Bureau of Labor Statistics (BLS) reported that the headline Consumer Price Index (CPI) rose by 0.4%MoM in August from 0.2% in July, with the annual inflation rate at 2.9% from 2.7% recorded in July. Meanwhile, the core CPI, which excludes volatile food and energy prices, increased at a steady 0.3% for the month and 3.1% on a yearly basis in August, matching the previous month's print and consensus estimate.
The higher-than-expected US consumer inflation reading, however, was overshadowed by a rise in US weekly Initial Jobless Claims to 263K, the highest level since October 2021, providing further evidence of a softening labor market, which in turn supports the case for more aggressive policy easing by the Federal Reserve.
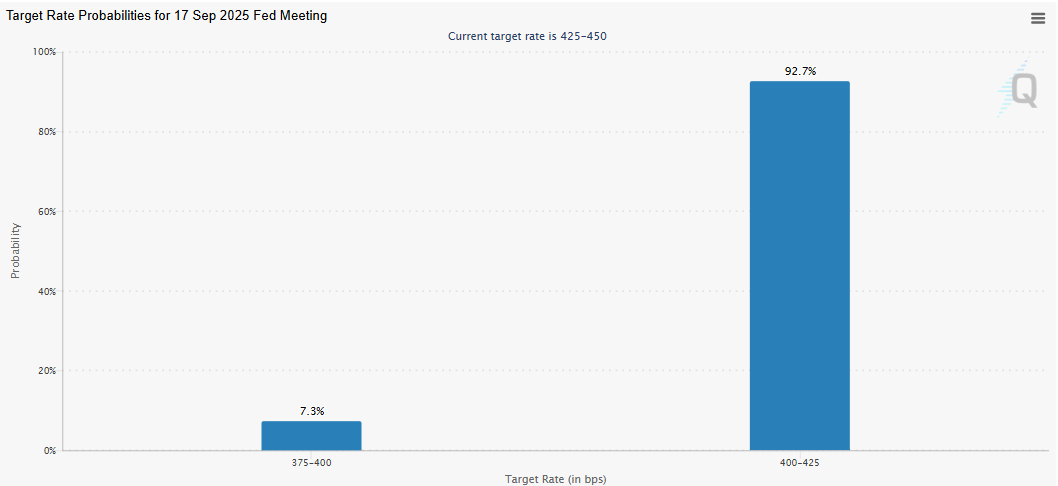
Market participants have now almost fully priced in three rate cuts for the rest of the year. The CME Group FedWatch tool shows a 92.7% possibility of a 25-basis-point (bps) interest rate cut and a 7.3% chance of a jumbo 50 bps cut at the Fed's September meeting.
Expectations regarding the central banks monetary easing pace may weigh on the US Dollar (USD) and boost risk-on sentiment, supporting a recovery in riskier assets, such as BTC.
Institutional and corporate demand strengthens
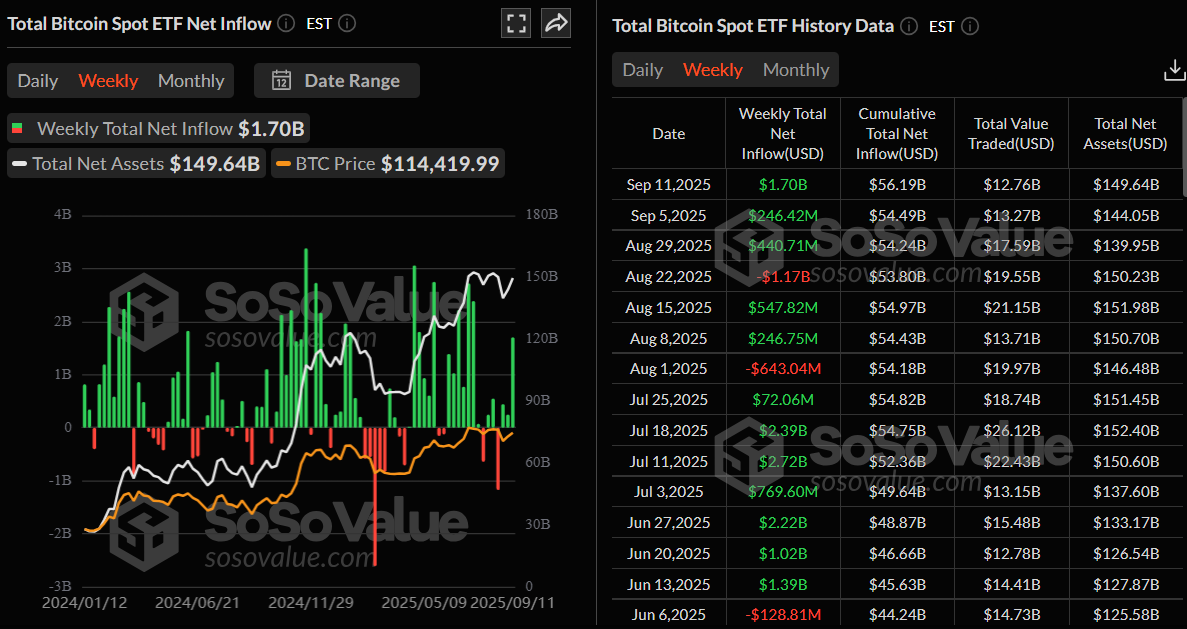
Bitcoin price recovery has been supported by institutional and corporate investors so far this week. According to SoSoValue data, as shown below, Bitcoin spot Exchange Traded Funds (ETFs) recorded a total of $1.70 billion in inflows as of Thursday, marking its third consecutive week of positive flows. Moreover, this week's inflow was the highest weekly flow since mid-July, signaling renewed institutional demand. If this inflow continues and intensifies, BTC could experience further price recovery.
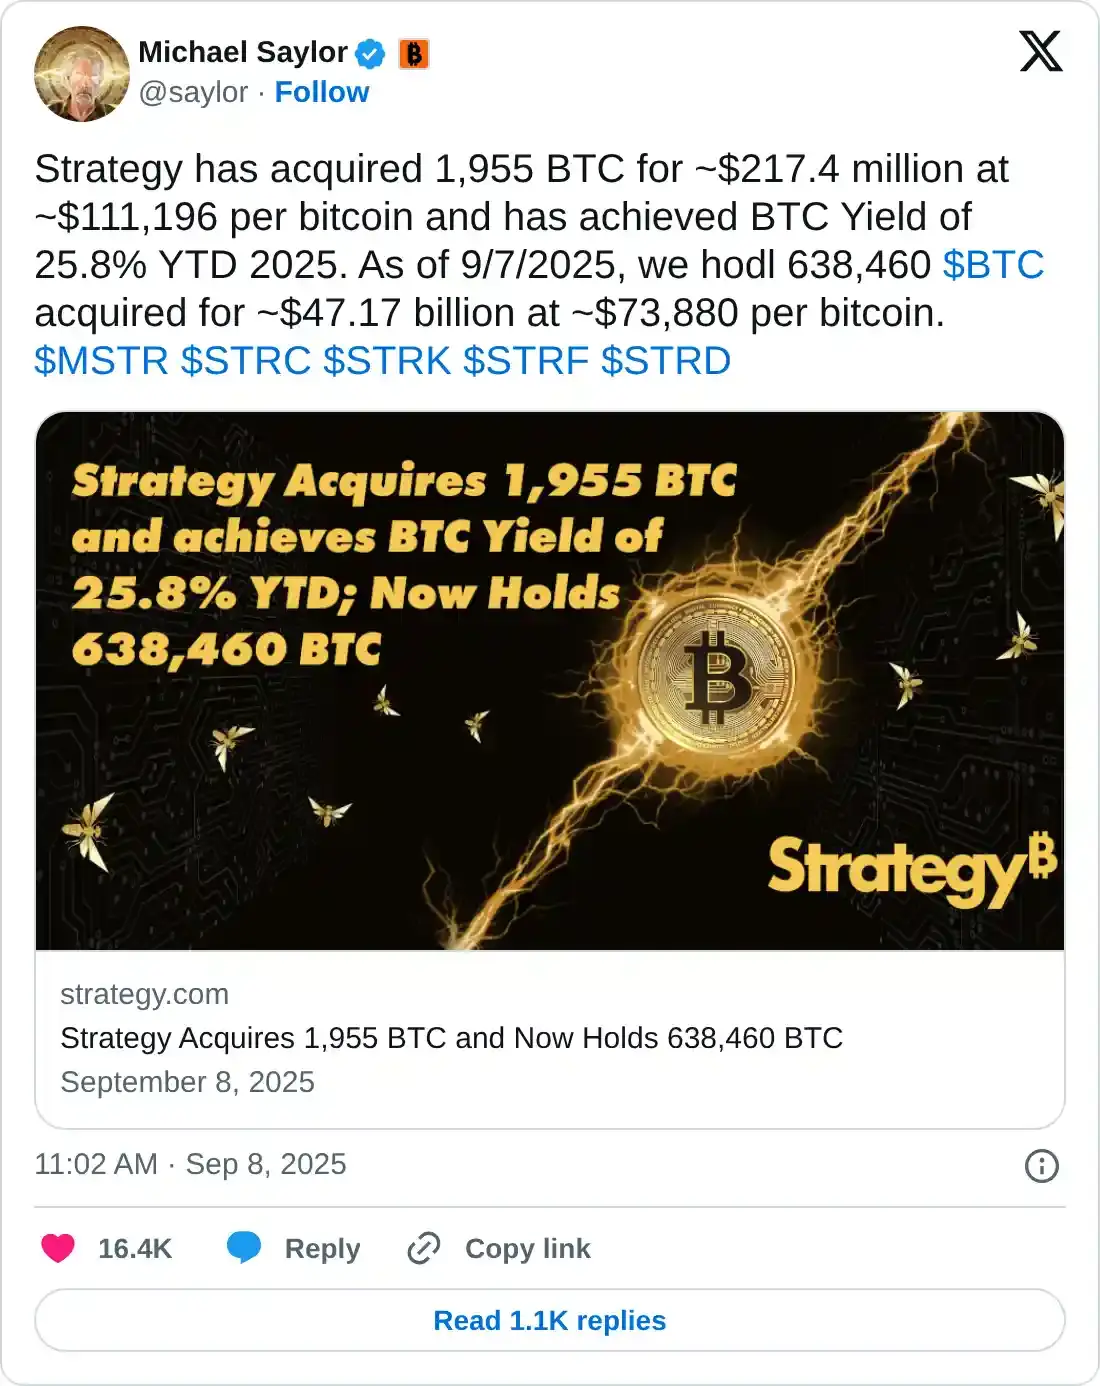
On the corporate front, Strategy co-founder Michael Saylor announced on Monday that his firm has acquired 1,955 BTC for $217.4 million, bringing the total to 638,460 BTC. On the same day, Japanese investment firm Metaplanet purchased an additional 136 BTC, bringing the firm’s total holdings to 20,136 BTC.
Later on Tuesday, Hong Kong-based technology service company QMMM Holdings (QMMM) announced plans to establish a digital asset treasury focused on Bitcoin, Ethereum (ETH) and Solana (SOL), with an initial investment of up to $100 million.
On-chain metrics signal dry powder for buying Bitcoin
CryptoQuant data shows that Binance recorded its highest net stablecoin inflow of over $6.2 billion on Monday. Additionally, Binance’s available stablecoin reserves have also reached a new all-time high, now close to $39 billion.
Since stablecoins are generally considered a form of dry powder for buying crypto, rising reserves suggest that traders and investors are holding more liquidity on Binance, ready to deploy. In short, high stablecoin reserves on Binance signal strong market liquidity and potential buying power, which often supports BTC’s price action.
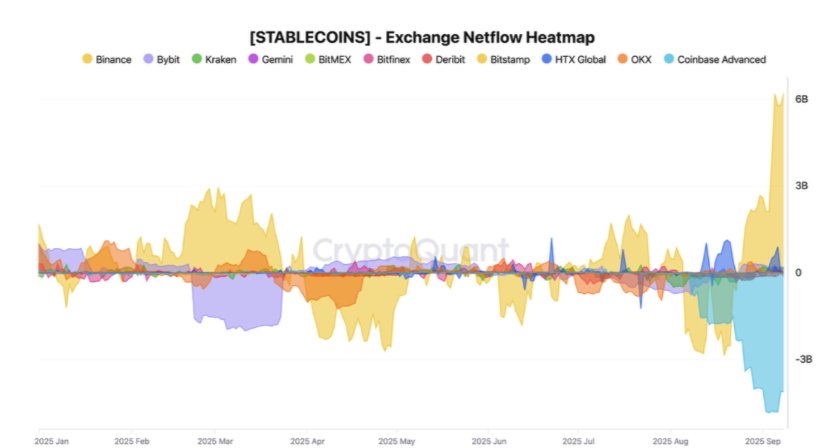
Stablecoin Exchange netflow chart. Source: CryptoQuant
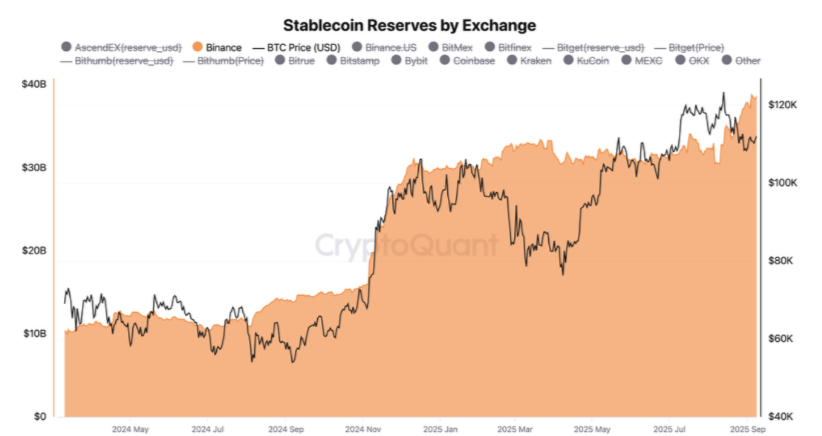
Stablecoin reserve on the Binance exchange chart. Source: CryptoQuant
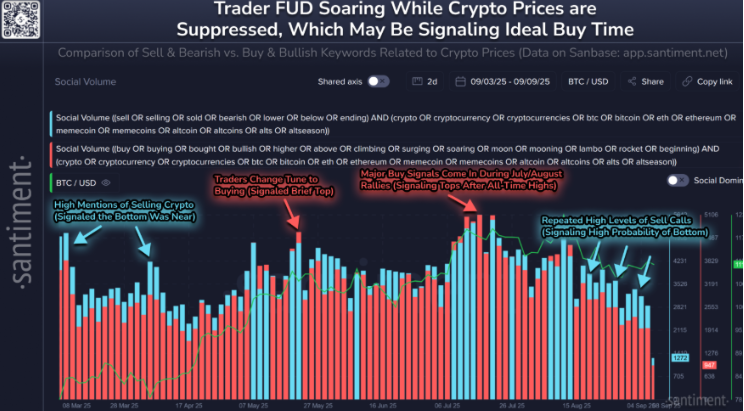
Apart from dry powder for buying crypto, Santiment data below shows that traders’ Fear, Uncertainty and Doubt (FUD) soars while crypto prices are suppressed, with expectations of Bitcoin falling back below $100,000 and altcoins undergoing a retracement period. Historically, the price has moved in the opposite direction of the crowd’s expectations, highlighting the current condition as a high probability of a bottom.
Some signs of concern
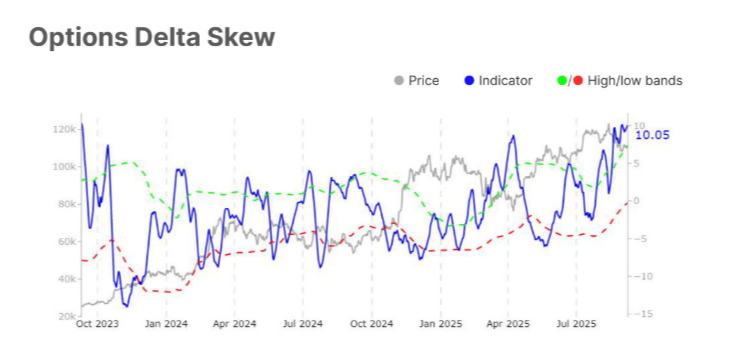
Glassnode’s weekly report highlighted that BTC is showing fragile stabilization above the $111,000 short-term holder cost basis, with improving momentum and reduced sell pressure in spot and futures markets. Meanwhile, options activity reflects lighter participation and persistent demand for downside protection.
"Traders should remain cautious, with sentiment leaning slightly bearish but with scope for short-term bounce-backs if demand re-emerges more decisively," the report said.
The options market open interest declined, showing lighter engagement, while volatility spreads narrowed, suggesting calmer expectations. Still, the fact that the 25-delta skew remained elevated indicates persistent demand for downside protection and defensive hedging, the report noted.
Will BTC reach the $120K mark?
Bitcoin’s weekly chart shows that it has extended its recovery by nearly 4% so far this week, following a rebound from its July weekly low of $107,429 in the previous week.
If the support level at $107,429 continues to hold, BTC could extend the recovery toward its key psychological level at $120,000.
The Relative Strength Index (RSI) on the weekly chart stands at 59, above its neutral level of 50, and is pointing upward, which indicates that bullish momentum is gaining traction. However, traders should be cautious, as the Moving Average Convergence Divergence (MACD) indicator on the same chart showed a bearish crossover in early September that remains in effect, providing a sell signal and suggesting a weakening of momentum.
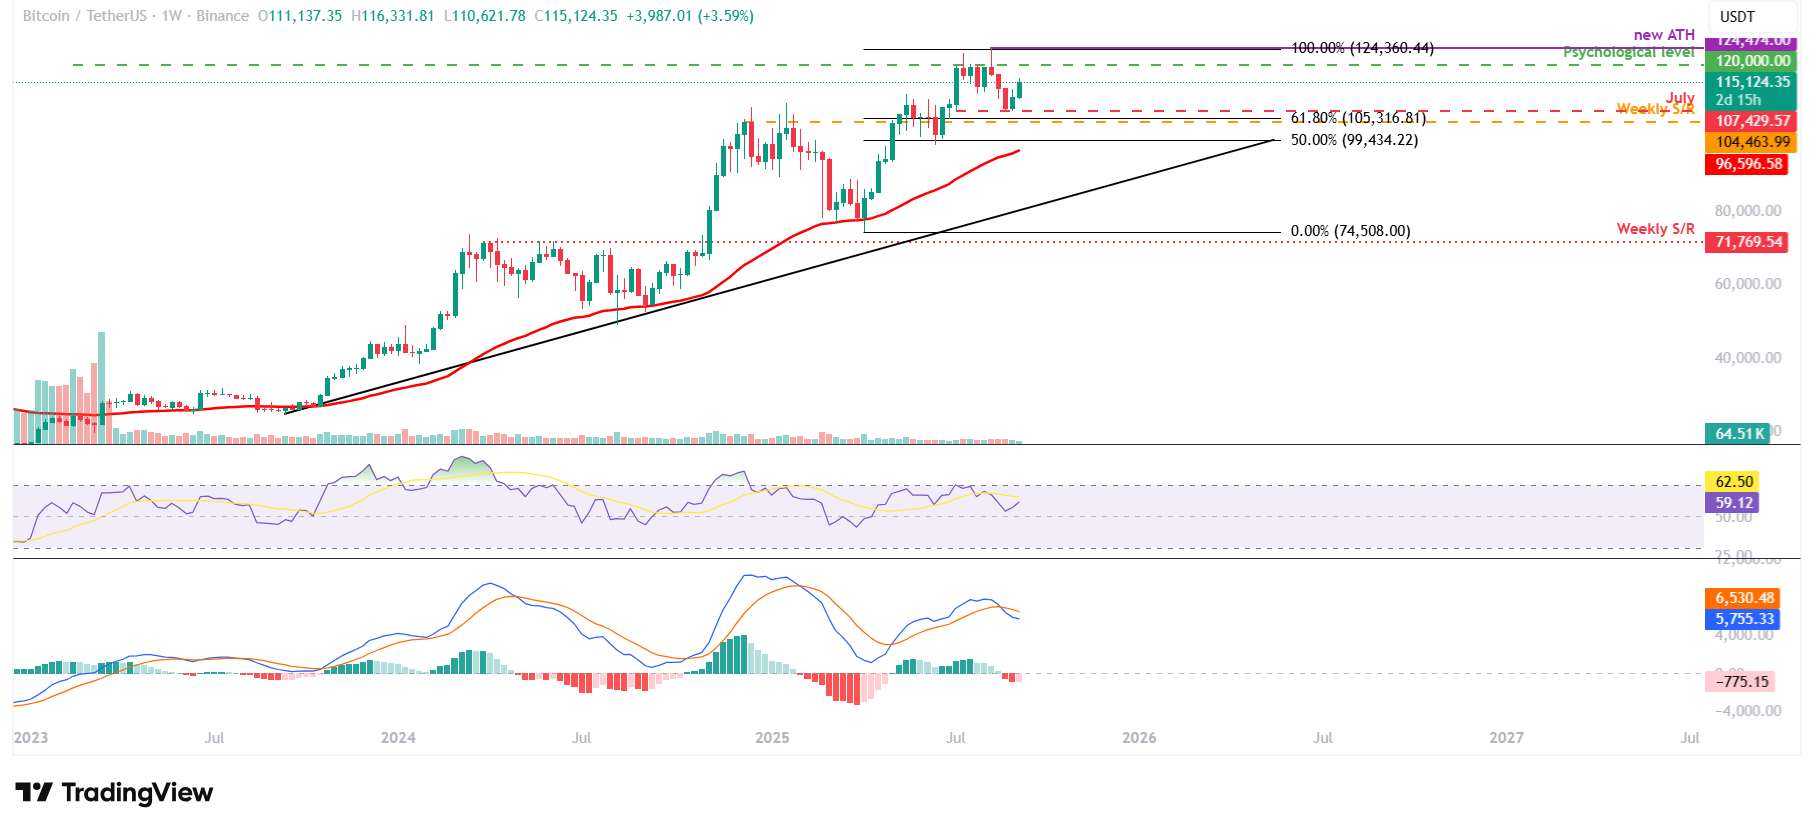
BTC/USDT weekly chart
On the daily chart, Bitcoin price kicked off the week with modest gains, initially facing rejection at the 50-day Exponential Moving Average (EMA) at $113,112 before regaining momentum midweek. It rallied over 2% on Wednesday to close above this key level and extended its advance the following day. At the time of writing on Friday, it faces slight rejection at the daily level at $116,000.
If BTC closes above the daily resistance at $116,000, it could extend gains toward its key psychological level at $120,000.
The RSI on the daily chart reads 56, which is above its neutral level of 50, showing that bullish momentum is gaining traction. The MACD indicator displayed a bullish crossover on Saturday, which remains in effect, indicating sustained bullish momentum and an upward trend ahead.
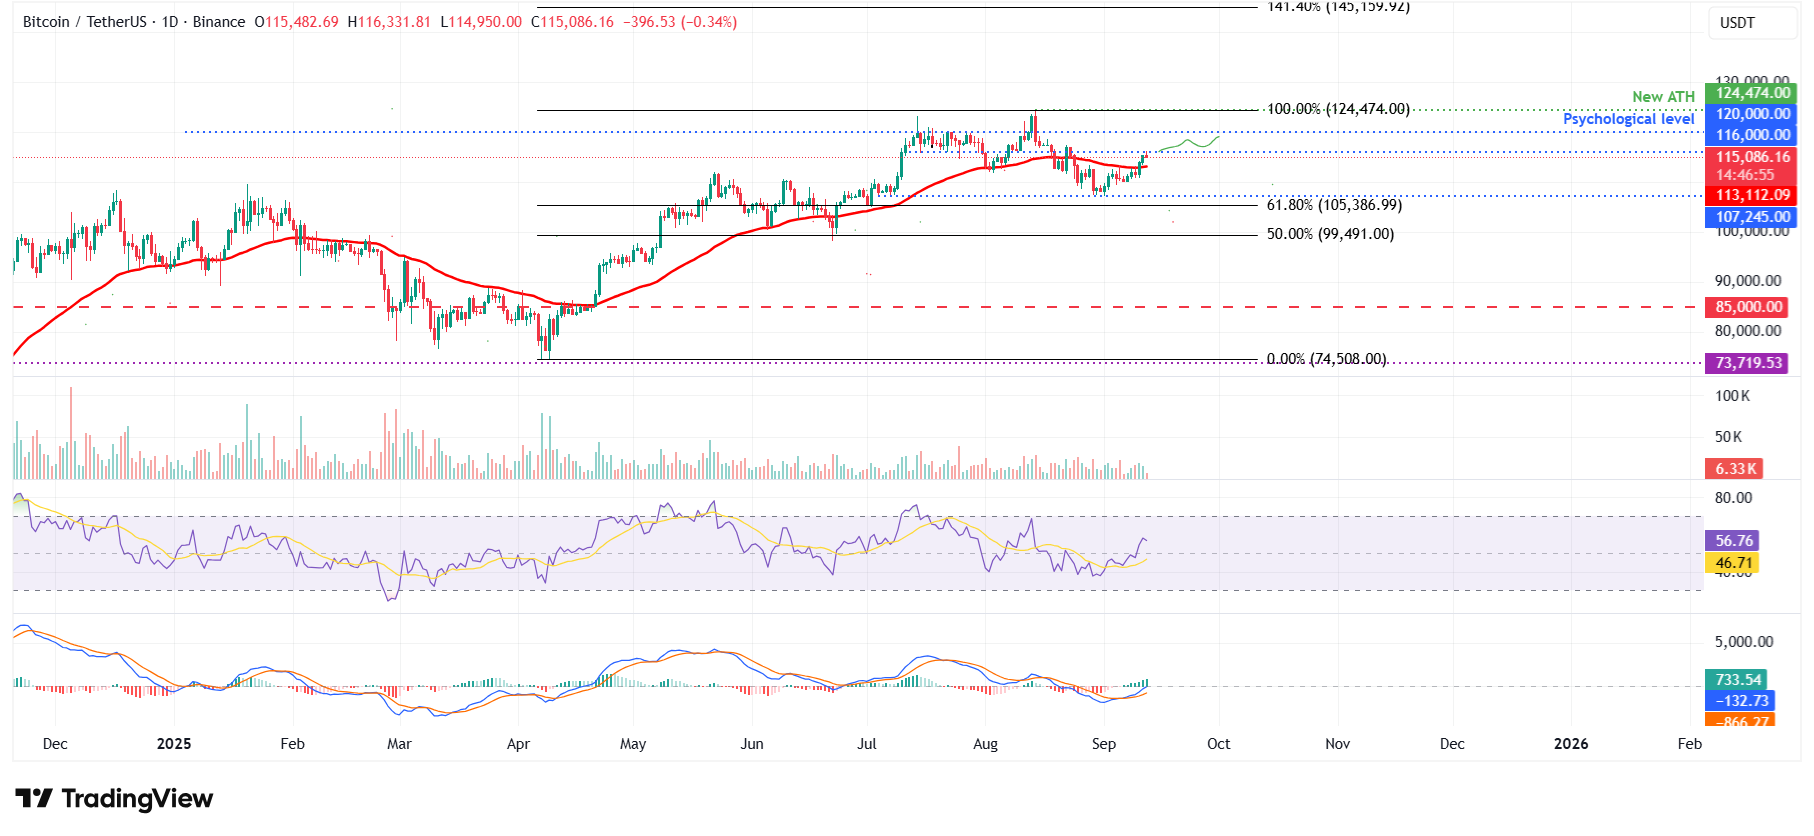
BTC/USDT daily chart
On the contrary, if BTC faces a correction from the daily resistance at $116,000, it could extend the decline toward its 50-day EMA at $113,112.
Cryptocurrency metrics FAQs
The developer or creator of each cryptocurrency decides on the total number of tokens that can be minted or issued. Only a certain number of these assets can be minted by mining, staking or other mechanisms. This is defined by the algorithm of the underlying blockchain technology. On the other hand, circulating supply can also be decreased via actions such as burning tokens, or mistakenly sending assets to addresses of other incompatible blockchains.
Market capitalization is the result of multiplying the circulating supply of a certain asset by the asset’s current market value.
Trading volume refers to the total number of tokens for a specific asset that has been transacted or exchanged between buyers and sellers within set trading hours, for example, 24 hours. It is used to gauge market sentiment, this metric combines all volumes on centralized exchanges and decentralized exchanges. Increasing trading volume often denotes the demand for a certain asset as more people are buying and selling the cryptocurrency.
Funding rates are a concept designed to encourage traders to take positions and ensure perpetual contract prices match spot markets. It defines a mechanism by exchanges to ensure that future prices and index prices periodic payments regularly converge. When the funding rate is positive, the price of the perpetual contract is higher than the mark price. This means traders who are bullish and have opened long positions pay traders who are in short positions. On the other hand, a negative funding rate means perpetual prices are below the mark price, and hence traders with short positions pay traders who have opened long positions.
Bài viết đề xuất


