
Top Crypto Gainers: Ethena, Conflux, Stellar signal bullish reversal with double-digit gains
- Ethena posts double-digit gains as bullish momentum holds amid a golden cross.
- Conflux bounces within a consolidation range, with bulls targeting a breakout rally.
- Stellar edges higher by nearly 3%, advancing over 8% gains from Sunday.
Ethena (ENA), Conflux (CFX), and Stellar (XLM) edge higher at press time on Monday, adding gains over the Sunday rise to outpace the broader cryptocurrency market in the last 24 hours. The technical outlook suggests that the residual bullish momentum could catalyze a bullish reversal in the altcoins emerging as front-runners.
Ethena targets further gains amid a Golden Cross
Ethena held above the $0.50 psychological level with a nearly 14% surge on Sunday. At the time of writing on Monday, ENA edges higher by over 2%, advancing towards the previous week’s high at $0.66, as the Relative Strength Index (RSI) reads 62 on the daily chart, suggesting significant bullish momentum.
The 50-day and 200-day Exponential Moving Averages (EMAs) mark a Golden Cross, indicating short-term recovery outpacing the longer-term trend. Still, investors should temper their bullish expectations as the Moving Average Convergence Divergence (MACD) crossed below its signal line on Saturday, flashing a sell signal. A reversal in the average lines, offsetting the recent crossover with a resurgence of green histogram bars, would trigger a buy signal.
A decisive close above the weekly high at $0.66 could extend the bullish run to $0.79, last tested on February 1.
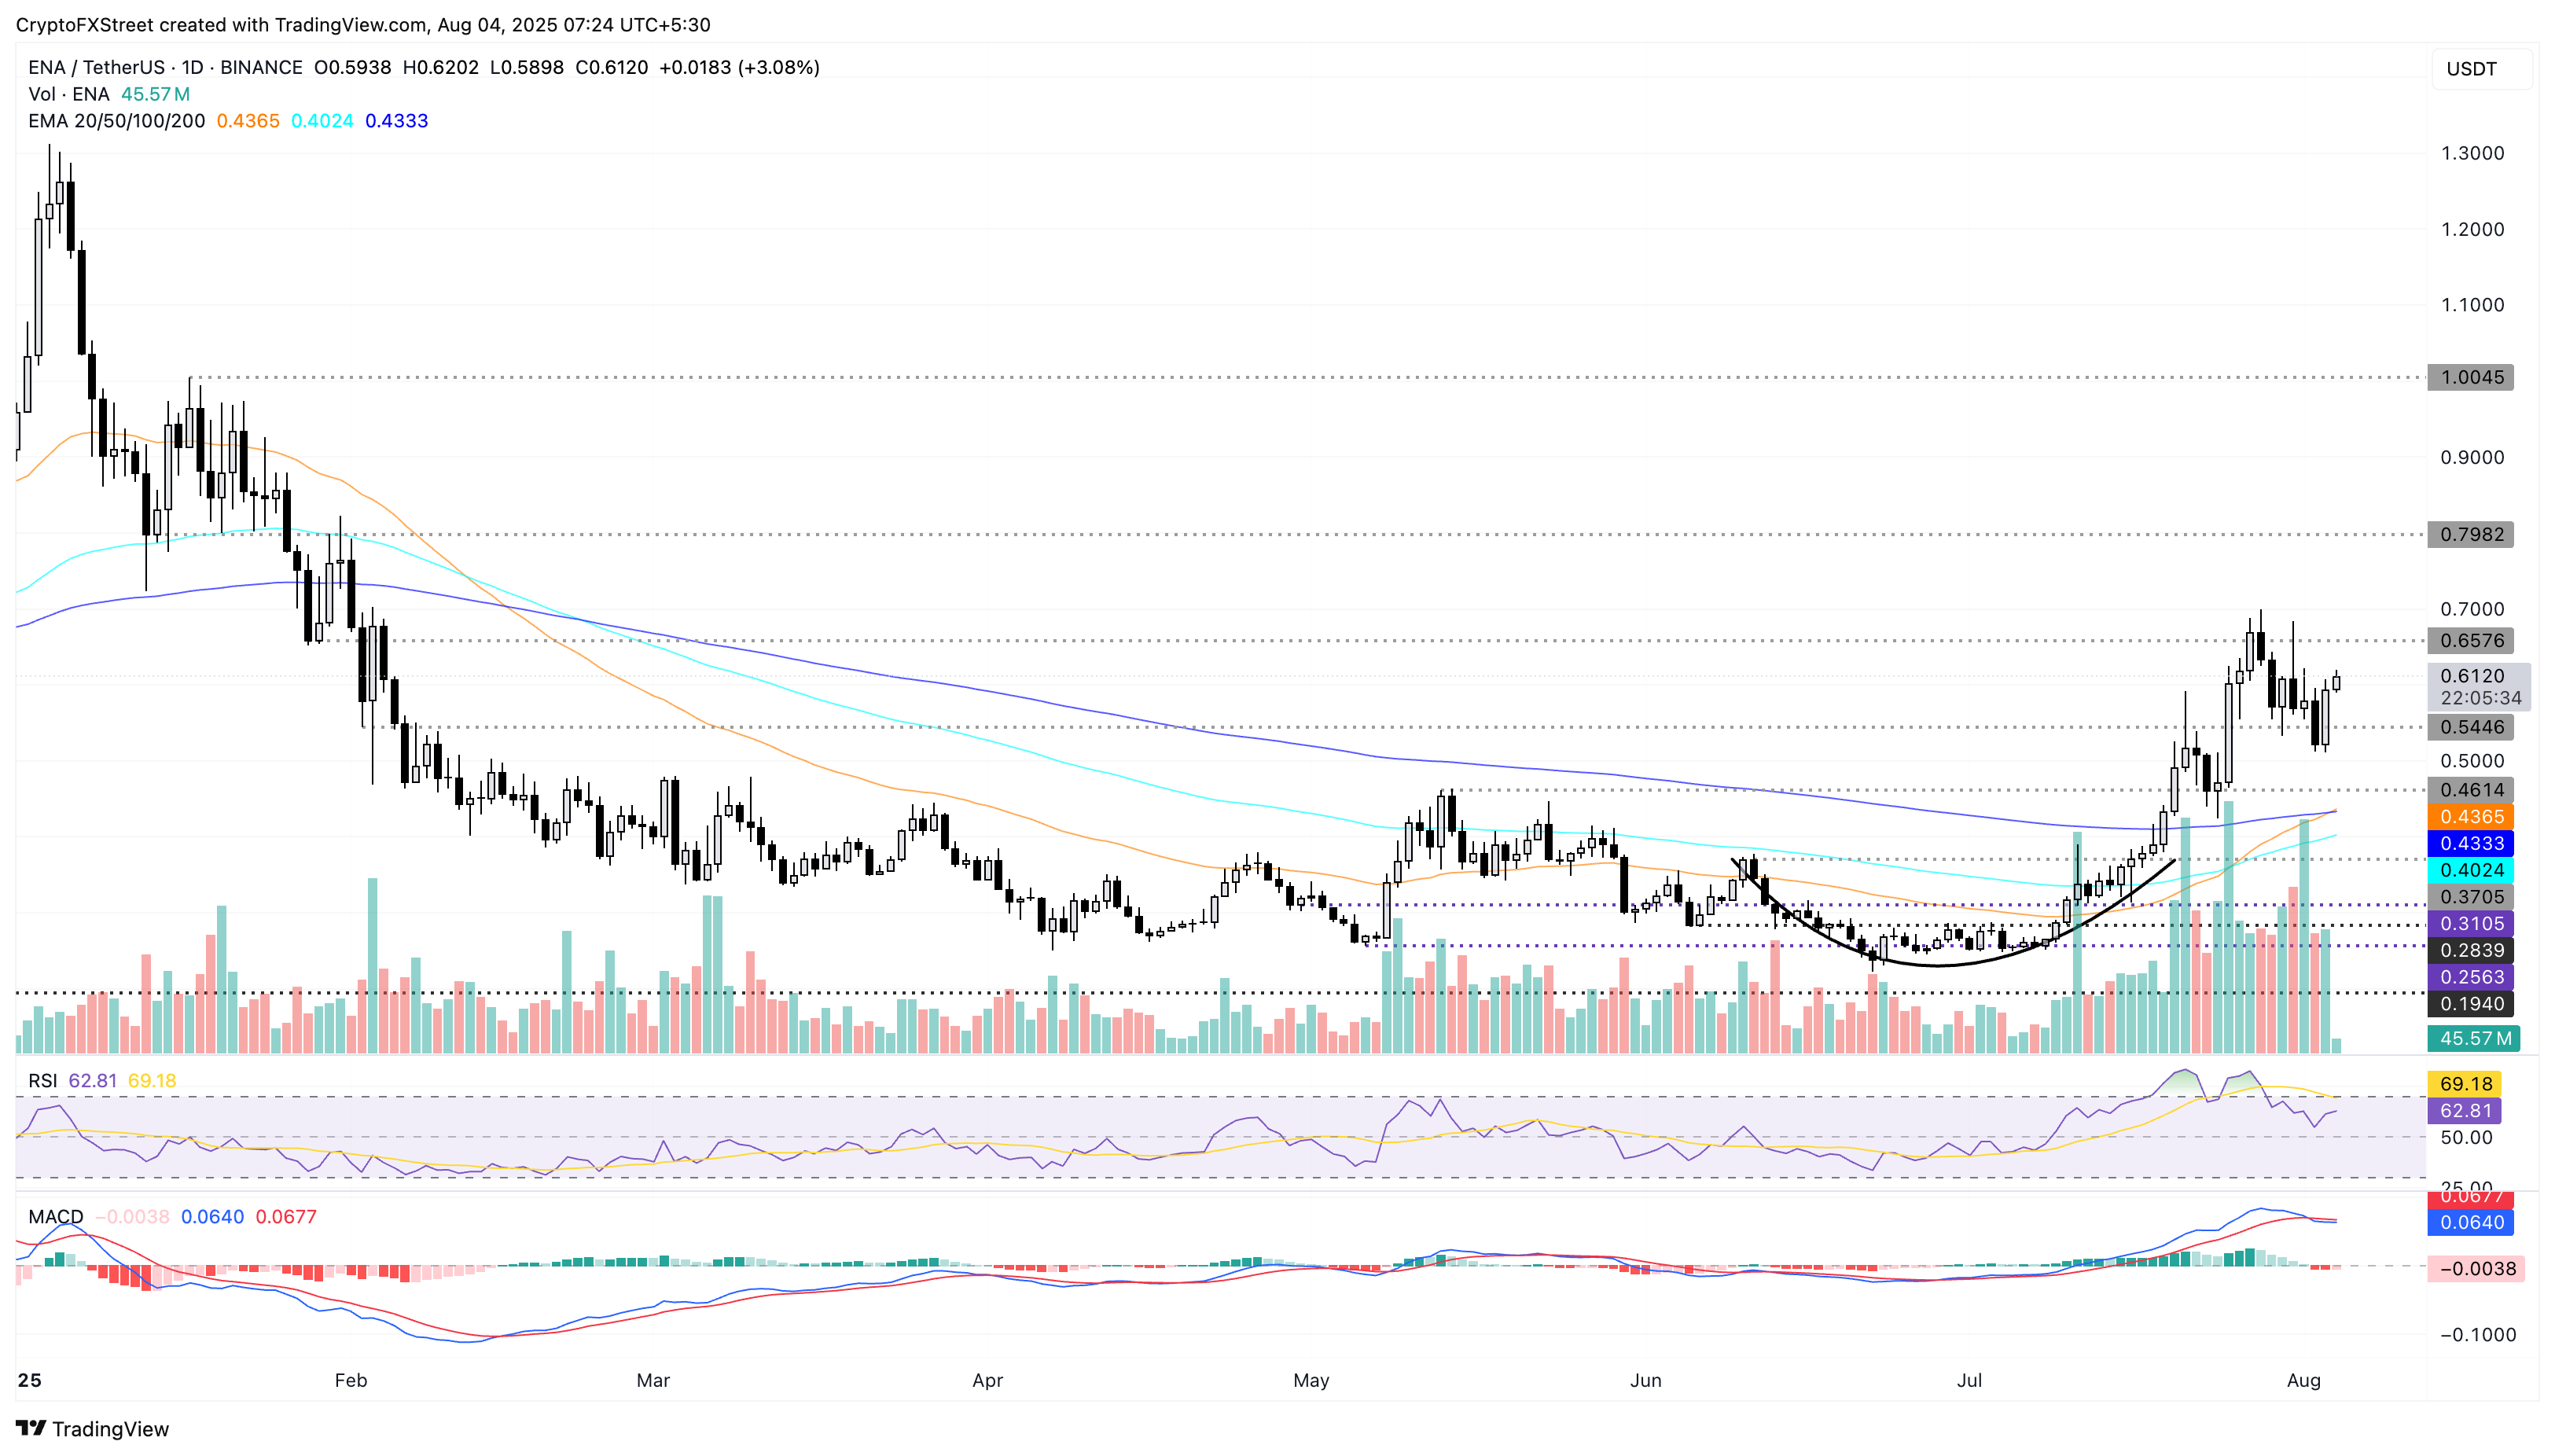
ENA/USDT daily price chart.
On the other hand, if ENA breaks under overhead pressure, it could retest the $0.48 support floor, last tested on July 24.
Conflux eyes range breakout to extend gains
Conflux gained over 15% on Sunday as it bounced off the 50% retracement level at $0.1847, drawn from $0.5500 on March 24 to $0.0620 on April 17. CFX edges lower by over 1% at press time on Monday, maintaining a sideways trend below the 61.8% Fibonacci level at $0.2390.
A decisive close above this level could extend the rally to the 78.6% Fibonacci level at $0.3448.
The MACD converges with its signal line on the same chart, giving mixed signals, while the RSI reads 65, indicating a hold on bullish momentum.
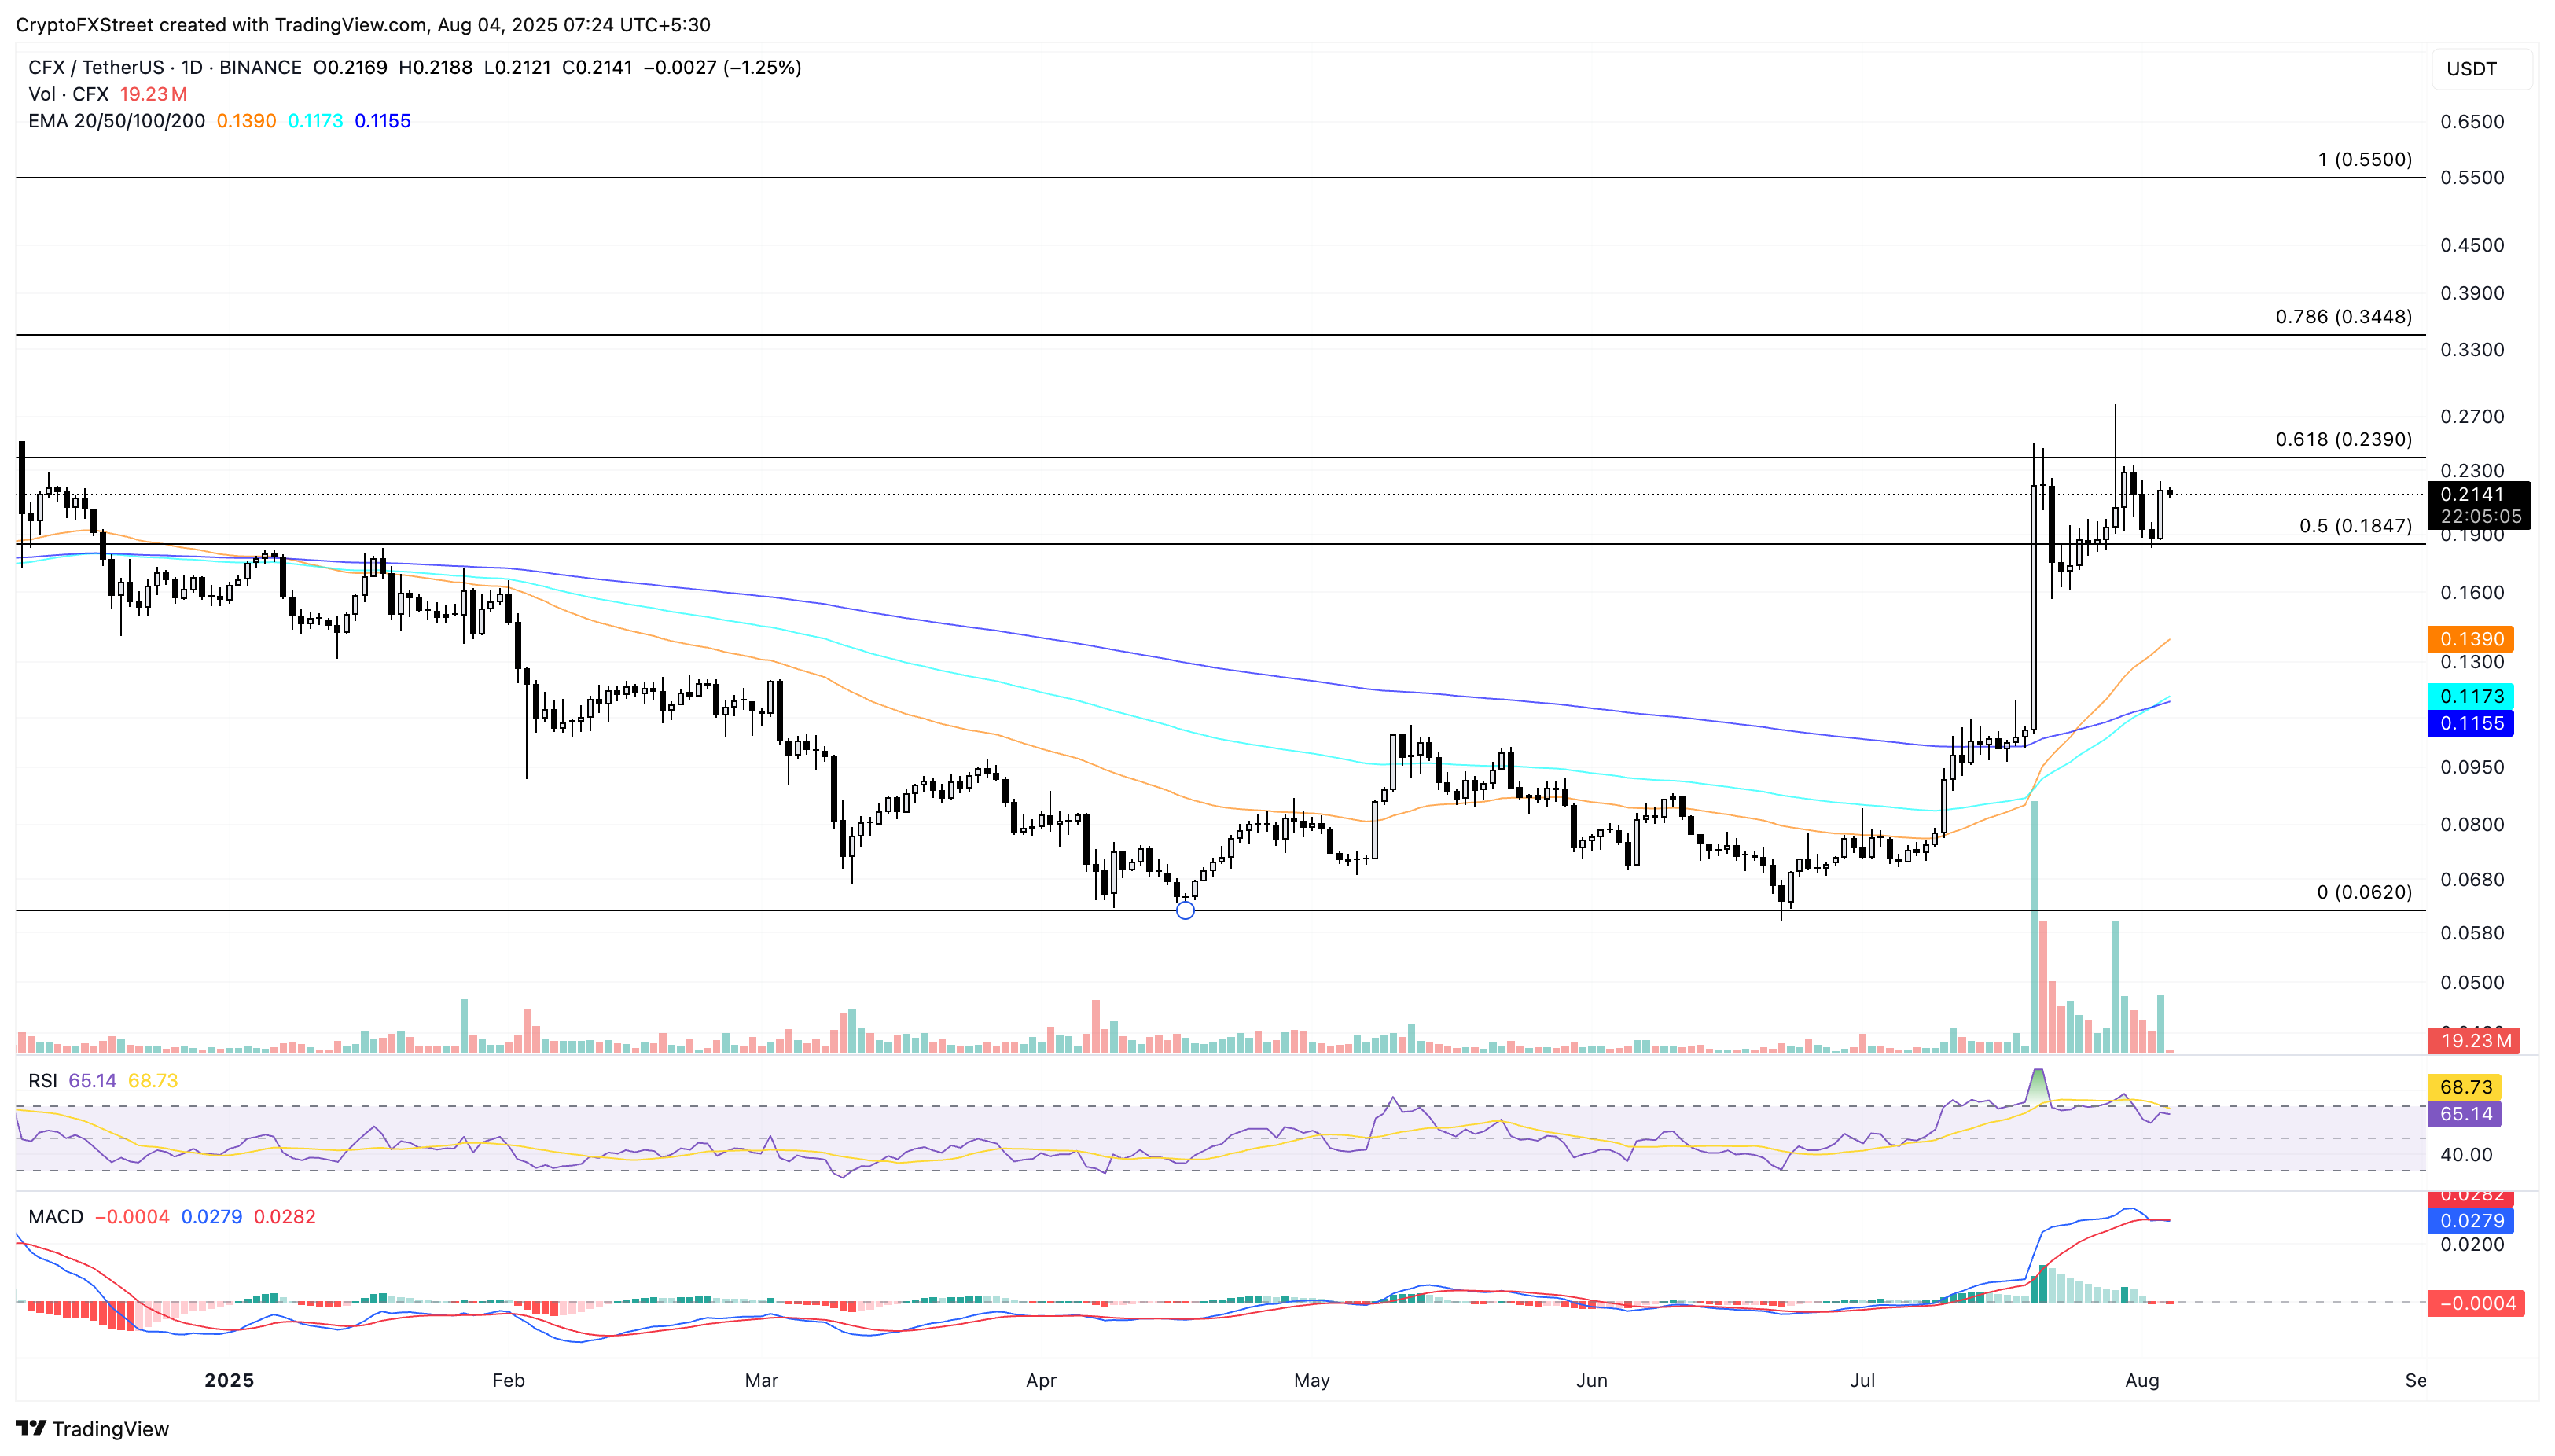
CFX/USDT daily price chart.
On the downside, a reversal in CFX could retest the $0.1847 support floor.
Stellar bounces off the 50-day EMA, targets $0.45
Stellar holds above the 50-day EMA with a nearly 9% jump, creating a bullish engulfing candle. XLM extends the reversal by 3% at press time on Monday, surpassing the 61.8% Fibonacci level at $0.3930, drawn from $0.5607 on December 1 to $0.2212 on April 8.
Investors could consider an extended run to $0.4595, aligning with the 78.6% Fibonacci level, as the RSI at 54 resurfaces above the halfway line while the MACD upticks closer to its signal line, suggesting a trend reversal.
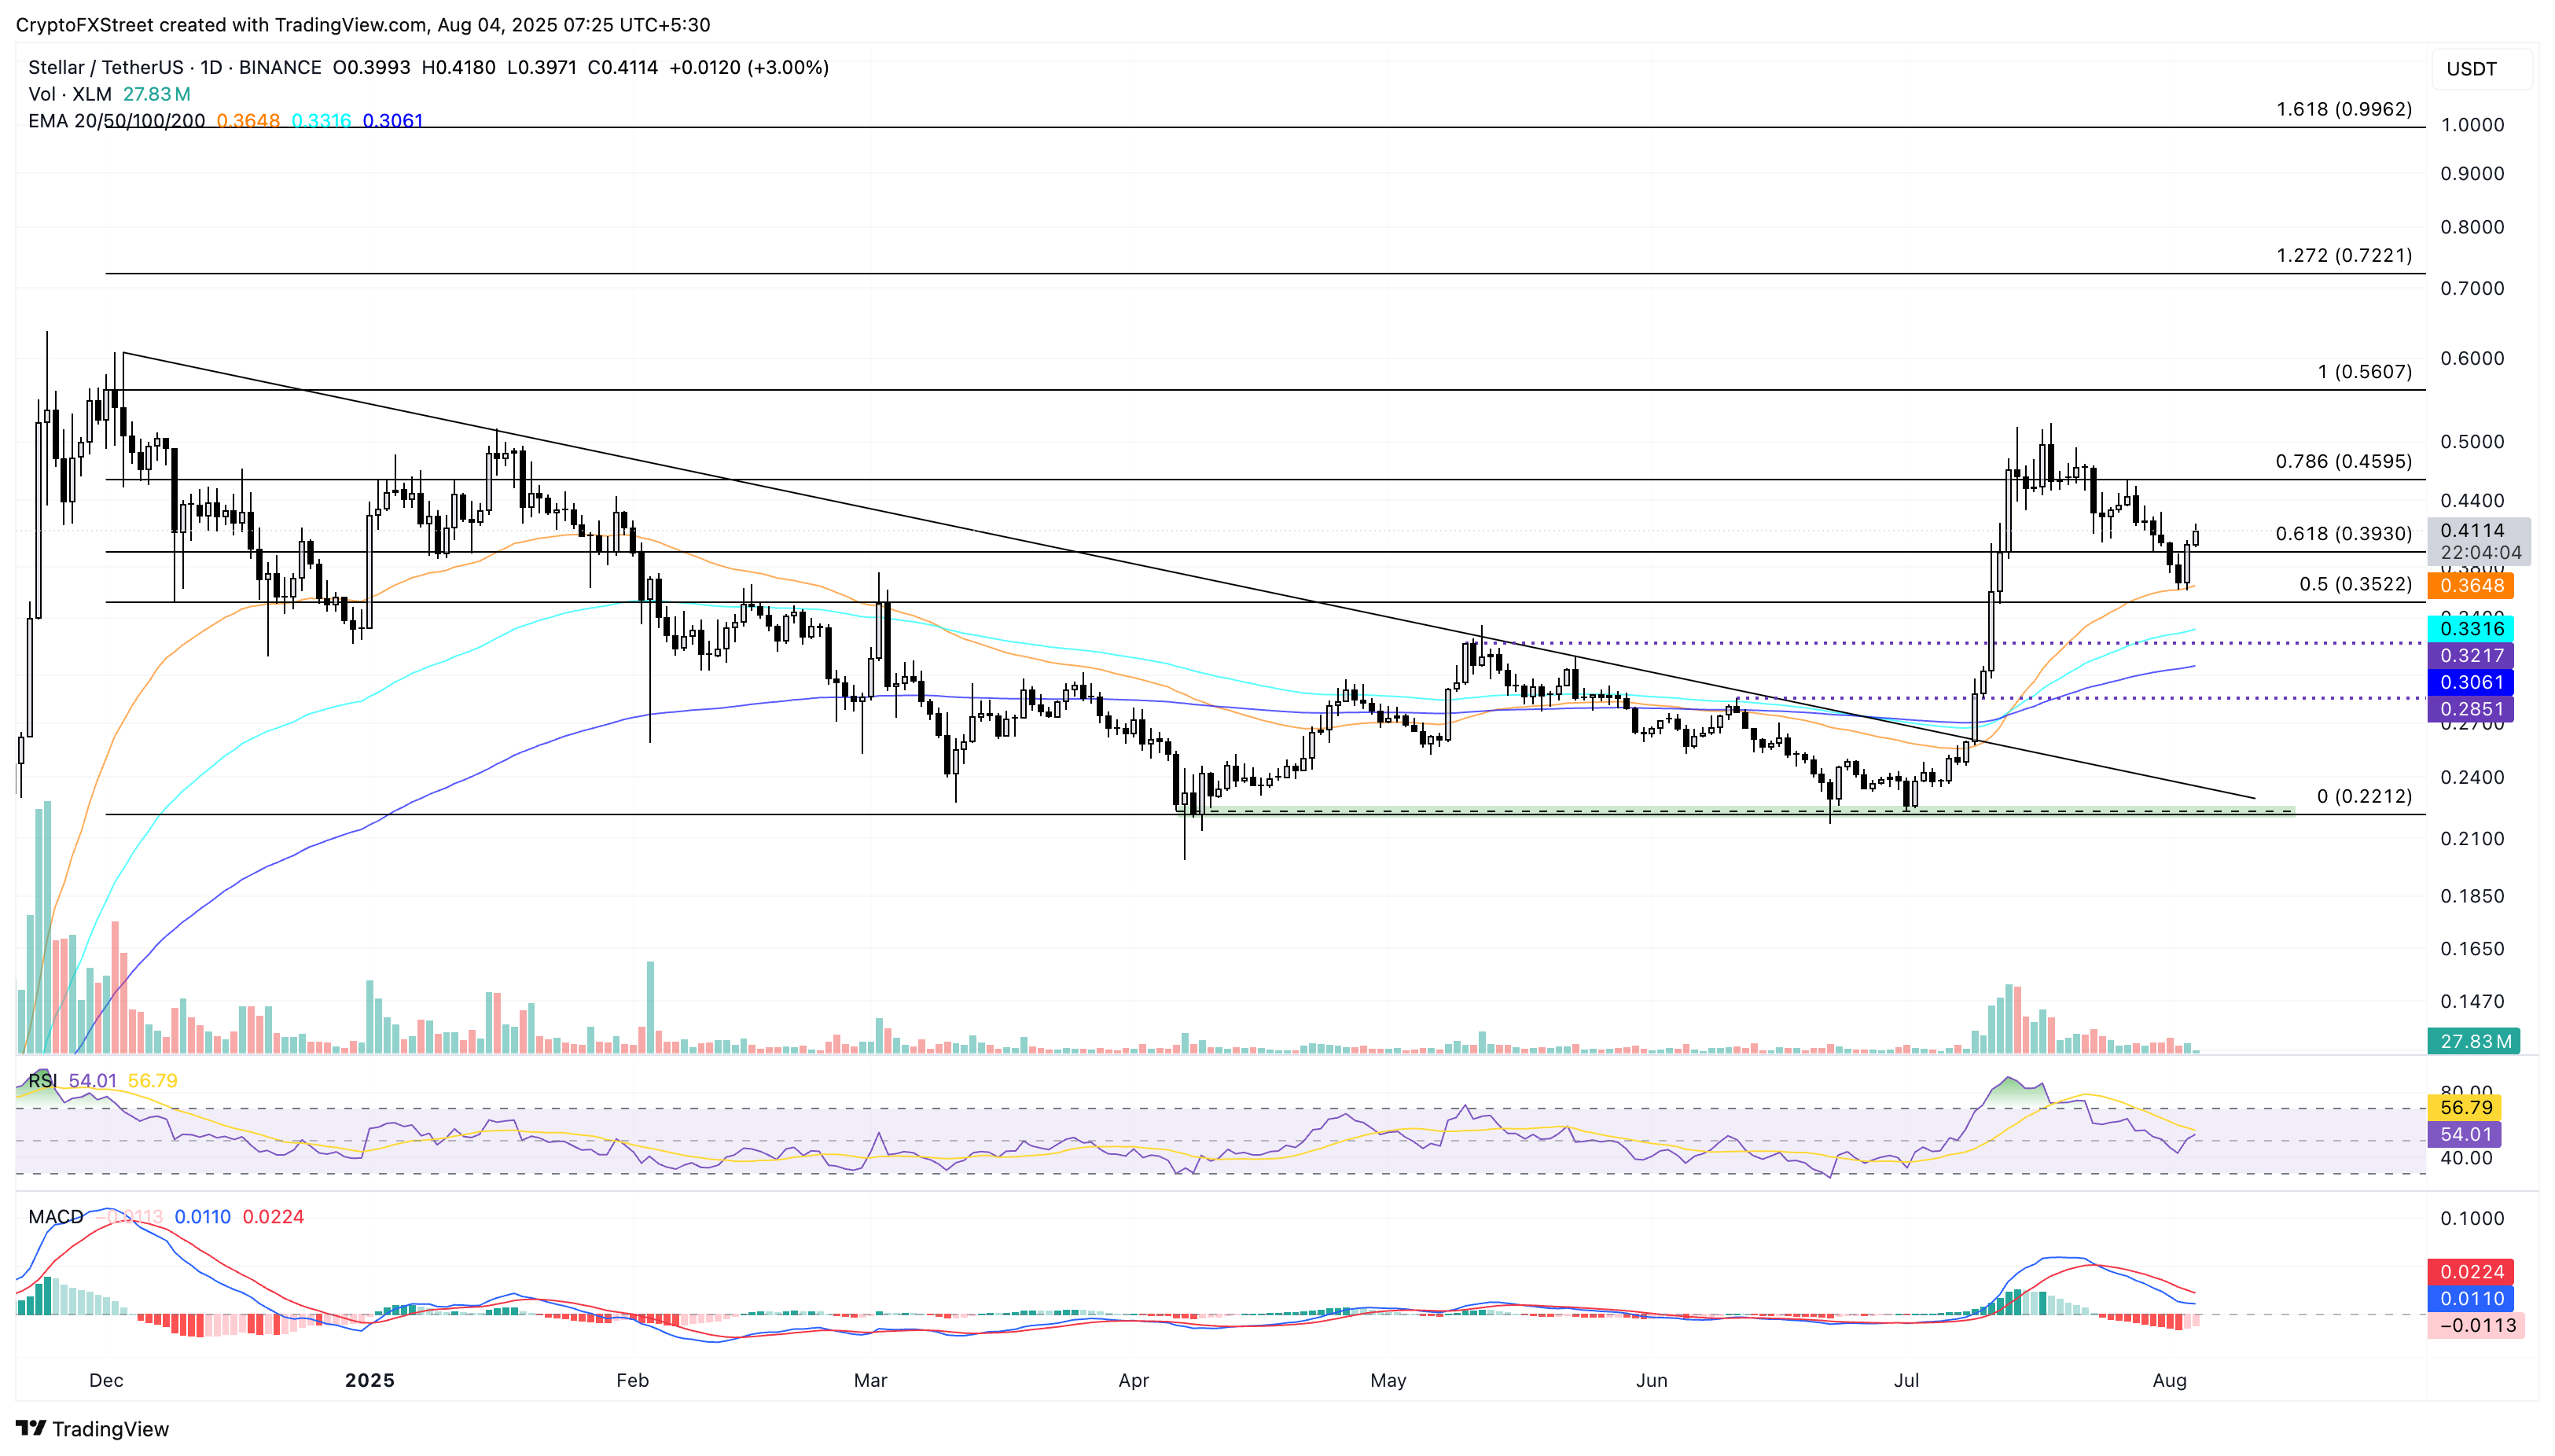
XLM/USDT daily price chart.
On the contrary, a reversal could retest the 50-day EMA at $0.3648.
Bài viết đề xuất


