
Breaking: Bitcoin rallies closer to $120,000 milestone, setting a new high
- Bitcoin price reaches a fresh all-time high of $119,999 on Monday, inching closer to a major psychological milestone.
- Bullish momentum remains intact, supported by positive technical indicators and sustained buying pressure.
- The next possible target for BTC is at $132,372, its 127.20% Fibonacci level.
Bitcoin (BTC) breaks above the key milestone level on Friday, setting a new all-time high of $119,999, with no signs of slowing. The technical outlook supports further gains as momentum indicators remain robust and price action firmly in price discovery mode, with the next potential target above $130,000.
Bitcoin’s next stop $130,000
Bitcoin entered price discovery on July 9, since then the king crypto has rallied towards the $120,000 target, a key psychological milestone for traders. Early on Monday during the Asian trading session, BTC climbed to a peak of $119,999, a new all-time high and the closest that the asset has rallied to the milestone.
The two key momentum indicators on the daily timeframe show an underlying bullish momentum in Bitcoin, further gains in BTC are likely. The Relative Strength Index (RSI) reads 76, and Moving Average Convergence Divergence (MACD) flashes green histogram bars above the neutral line.
The BTC/USDT daily price chart shows that the next price target is $132,372, the 127.20% Fibonacci retracement level of Bitcoin's rally from April's low of $74,508 to the new all-time high of $119,999.
BTC is currently 10% away from the next potential bullish target.
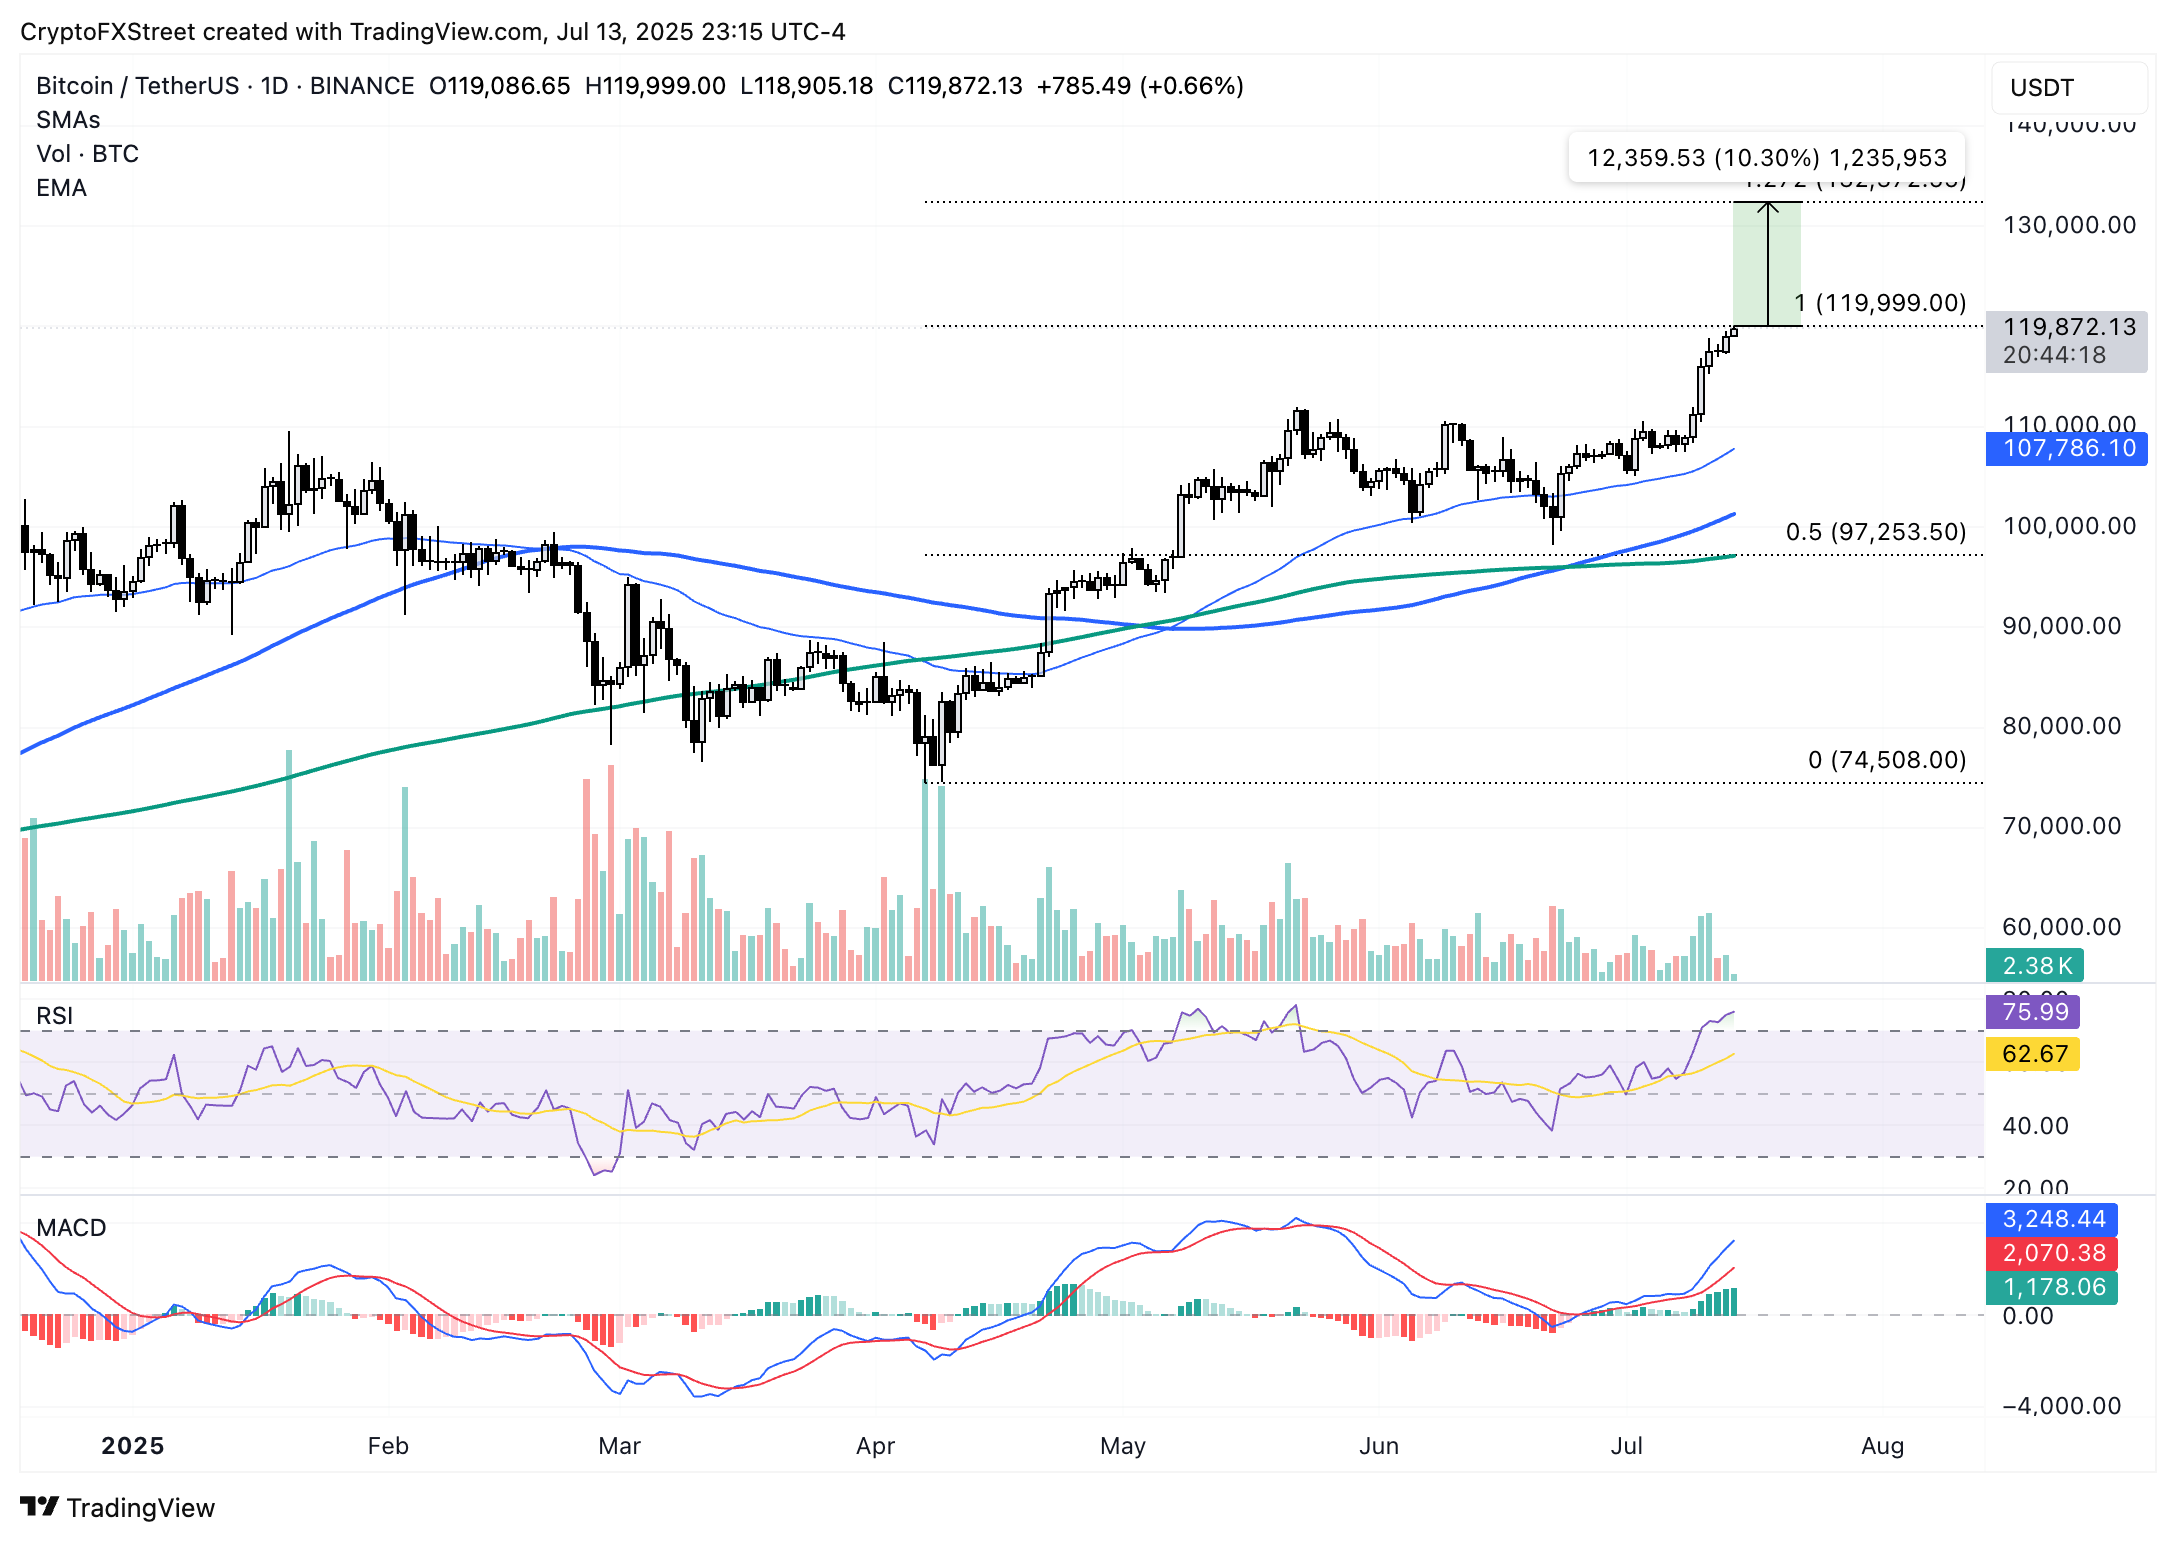
BTC/USDT daily chart
However, if BTC faces a correction, it could extend the decline to find support around the lower boundary of a Fair Value Gap (FVG) at $115,222.
Derivatives market data shows that $76 million in shorts were liquidated in the last 24 hours as BTC rallies towards the new peak, the long/short ratio, considered an indicator of derivatives traders inclination towards bullish/ bearish bets exceeds 1. Meaning, more derivatives traders are bullish on Bitcoin and expect further gains in the king crypto.
Bài viết đề xuất


