
Bitcoin Price Forecast: BTC consolidates amid US-China trade truce extension expectations, US-EU trade deal
- Bitcoin price has been consolidating within the $116,000 to $120,000 range for the last 13 days.
- Macro developments, such as a possible extension of the US-China trade truce and US-EU trade deal, fail to spark immediate momentum in BTC.
- Market participants await the upcoming Fed interest rate decision, which could bring volatility to the market.
Bitcoin (BTC) has been trading in a range-bound market structure between $116,000 and $120,000 for nearly two weeks, signaling indecision among traders. Despite major macroeconomic developments, the US and China are likely to agree to extend the trade truce and a fresh trade agreement between the US and the European Union, failed to spark immediate momentum for the largest cryptocurrency by market capitalization. The Federal Reserve’s (Fed) upcoming interest rate decision this week is looming, and markets are bracing for potential volatility that could break BTC out of its current range.
The US and European Union deal brings some optimism to the market
A trade deal between the European Union (EU) and the US was finally struck on Sunday, just ahead of fresh US-China tariff talks, according to the BBC report.
The report highlighted that the EU now faces a 15% US tariff, rather than 30% that had been threatened previously.
“But it is still a major climbdown as the rate is a lot higher than before Trump’s so-called Liberation Day in April and not as good as the UK’s 10% rate,” said the BBC’s report.
Meanwhile, US President Donald Trump’s personal involvement was crucial in closing the deal, similar to other recent trade agreements with Japan and the UK, as seen in the previous week. Moreover, US and Chinese officials are meeting again and an extension of the trade truce is expected, adding to the trade optimism ahead of the August 1 deadline.
These trade deals and ongoing talks have boosted investors’ confidence in riskier assets. Still, BTC has continued to consolidate in the $116,000 to $120,000 range for nearly two weeks, while other major altcoins have recovered, such as Ethereum, which has reached a new year-to-date high of $3,941 so far on Monday.
Fed interest rate could bring directional bias for BTC
Bitcoin has continued to move within a range of $116,000 and $120,000 for the last 13 days, following a new all-time high of $123,218 reached on July 14. This price consolidation could come to an end as market participants await the Federal Reserve’s (Fed) interest rate decision due this Wednesday, which may provide a directional bias in either direction, depending on the announcement.
So far, the markets do not expect an interest rate cut from the US Federal Reserve (Fed) in July, despite US President Donald Trump’s continuous push for lower borrowing costs. Trump has been personally attacking Fed Chair Jerome Powell over his stance on holding rates and has repeatedly called for the central bank chief’s resignation.
Moreover, last week’s macroeconomic data indicated a still resilient US labor market, reinforcing the view that the Federal Reserve will hold interest rates steady at the upcoming monetary policy meeting this week. However, any signs of a dovish stance by the Fed could trigger a risk-on sentiment, which supports the price rally in cryptos such as Bitcoin.
Bitcoin institutional demand remains strong
Despite the largest cryptocurrency by market capitalization trading sideways, the institutional demand remained positive. According to the SoSoValue data, as shown below, US spot Bitcoin ETFs recorded a mild weekly inflow of $72.06 million last week, marking the seventh consecutive week of flows since mid-June. However, these inflow values are low compared to the inflow seen in the last few weeks. For BTC price to trade higher, the demand for this inflow should intensify.
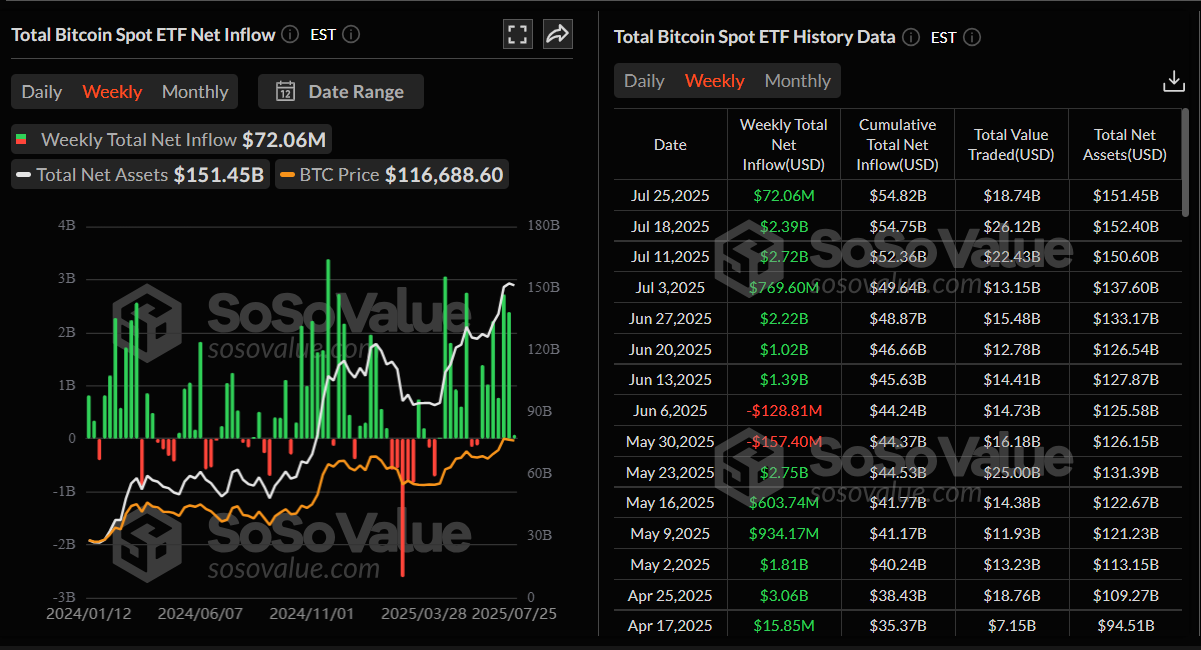
Total Bitcoin Spot ETFs weekly chart. Source: SoSoValue
Bitcoin Price Forecast: BTC consolidates for nearly two weeks
Bitcoin price has been consolidating in the $116,000 to $120,000 range for the last 13 days, following a new all-time high of $123,218 reached on July 14. At the time of writing on Monday, it trades slightly down, trading at around $118,700.
If BTC falls below $116,000 on a daily basis, it could extend the decline to retest the 50-day Exponential Moving Average (EMA) at $112,321.
The Relative Strength Index (RSI) indicator on the daily chart reads 61, which is above its neutral level of 50 but points downward, indicating fading bullish momentum. Moreover, the Moving Average Convergence Divergence (MACD) indicator showed a bearish crossover on Wednesday, giving sell signals and indicating a potential downward trend.

BTC/USDT daily chart
On the other hand, if BTC closes above $120,000 on a daily basis, it could extend the recovery toward the fresh all-time high at $123,218.
Bitcoin, altcoins, stablecoins FAQs
Bitcoin is the largest cryptocurrency by market capitalization, a virtual currency designed to serve as money. This form of payment cannot be controlled by any one person, group, or entity, which eliminates the need for third-party participation during financial transactions.
Altcoins are any cryptocurrency apart from Bitcoin, but some also regard Ethereum as a non-altcoin because it is from these two cryptocurrencies that forking happens. If this is true, then Litecoin is the first altcoin, forked from the Bitcoin protocol and, therefore, an “improved” version of it.
Stablecoins are cryptocurrencies designed to have a stable price, with their value backed by a reserve of the asset it represents. To achieve this, the value of any one stablecoin is pegged to a commodity or financial instrument, such as the US Dollar (USD), with its supply regulated by an algorithm or demand. The main goal of stablecoins is to provide an on/off-ramp for investors willing to trade and invest in cryptocurrencies. Stablecoins also allow investors to store value since cryptocurrencies, in general, are subject to volatility.
Bitcoin dominance is the ratio of Bitcoin's market capitalization to the total market capitalization of all cryptocurrencies combined. It provides a clear picture of Bitcoin’s interest among investors. A high BTC dominance typically happens before and during a bull run, in which investors resort to investing in relatively stable and high market capitalization cryptocurrency like Bitcoin. A drop in BTC dominance usually means that investors are moving their capital and/or profits to altcoins in a quest for higher returns, which usually triggers an explosion of altcoin rallies.
Bài viết đề xuất


