
Ethena Price Forecast: ENA records double-digit gains amid Upbit listing, Coinbase partnership
- Etena extends the trendline breakout rally with its fourth consecutive positive day amid resurfacing bullish momentum.
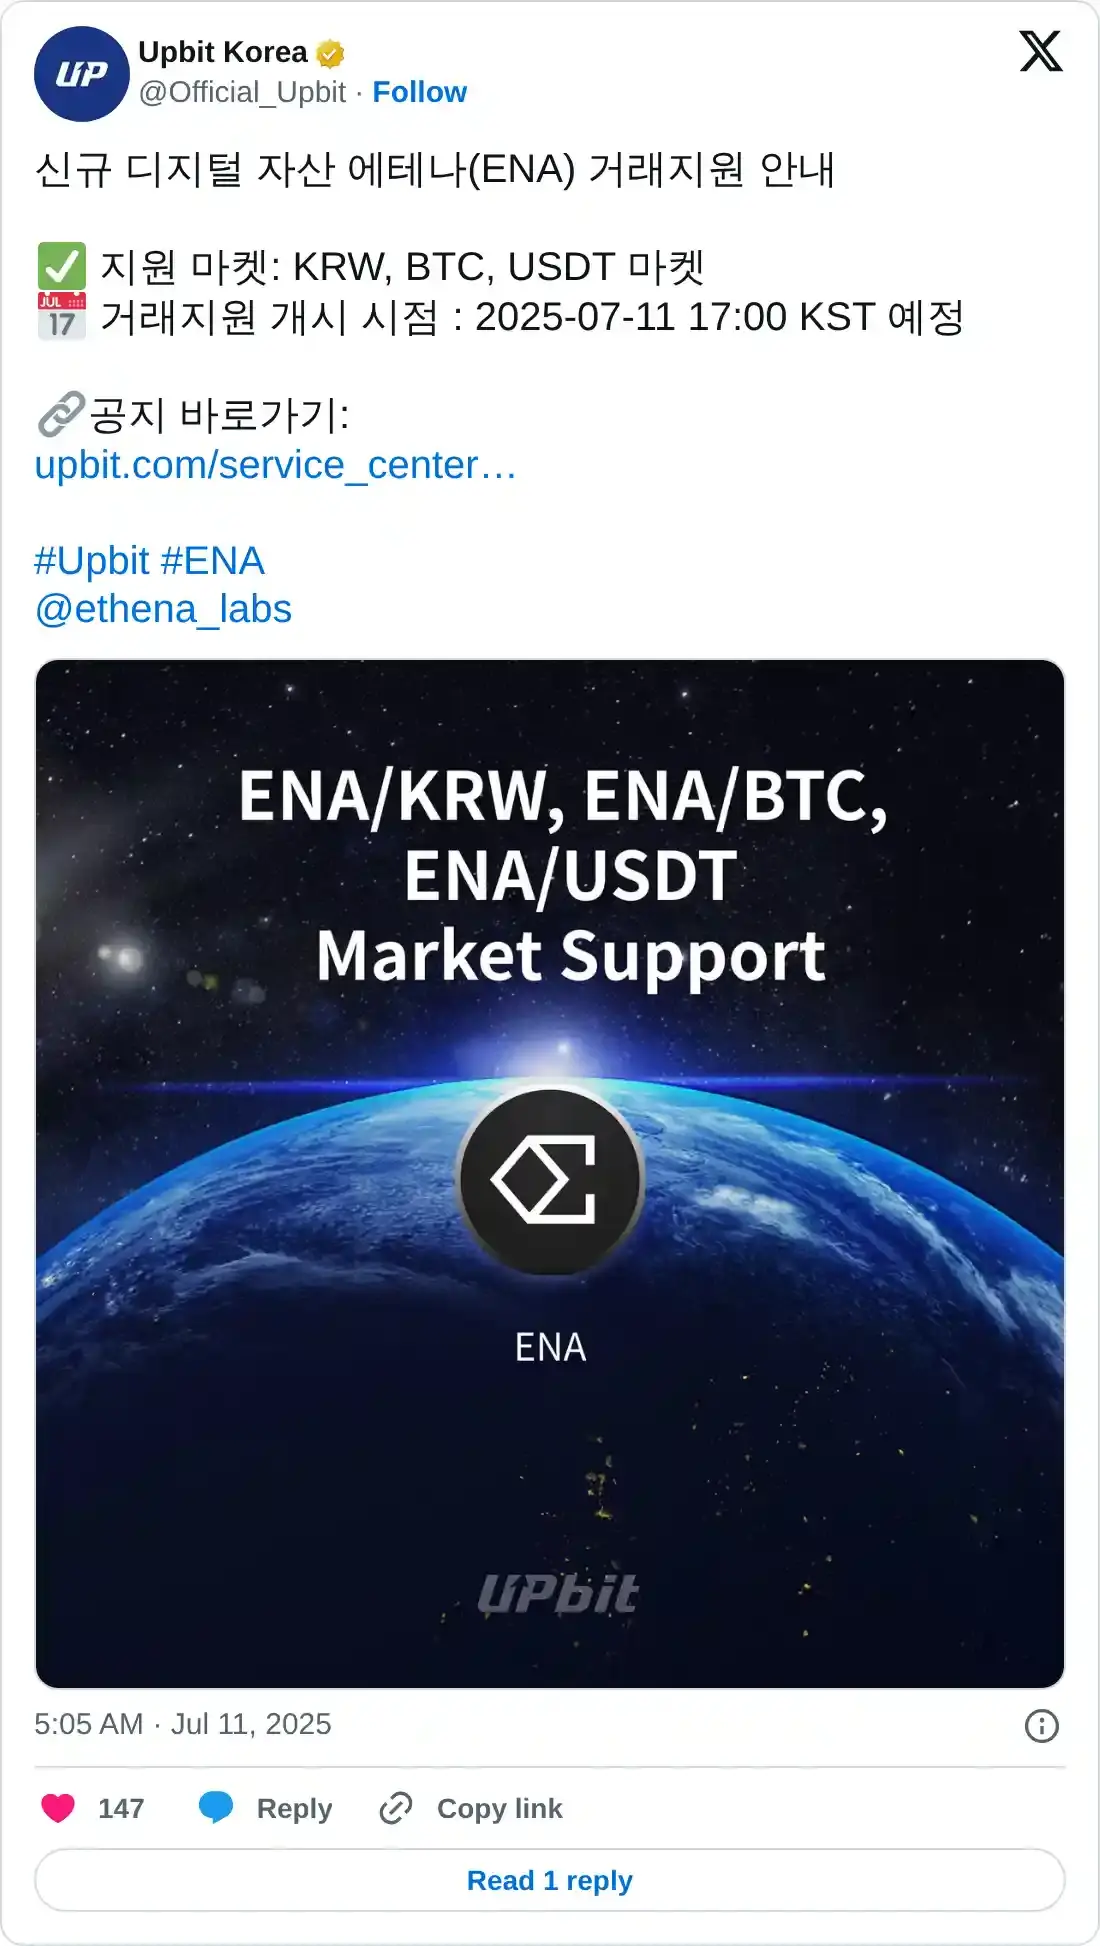
- Upbit announces the listing of Ethena’s ENA, opening the gates to Korean markets.
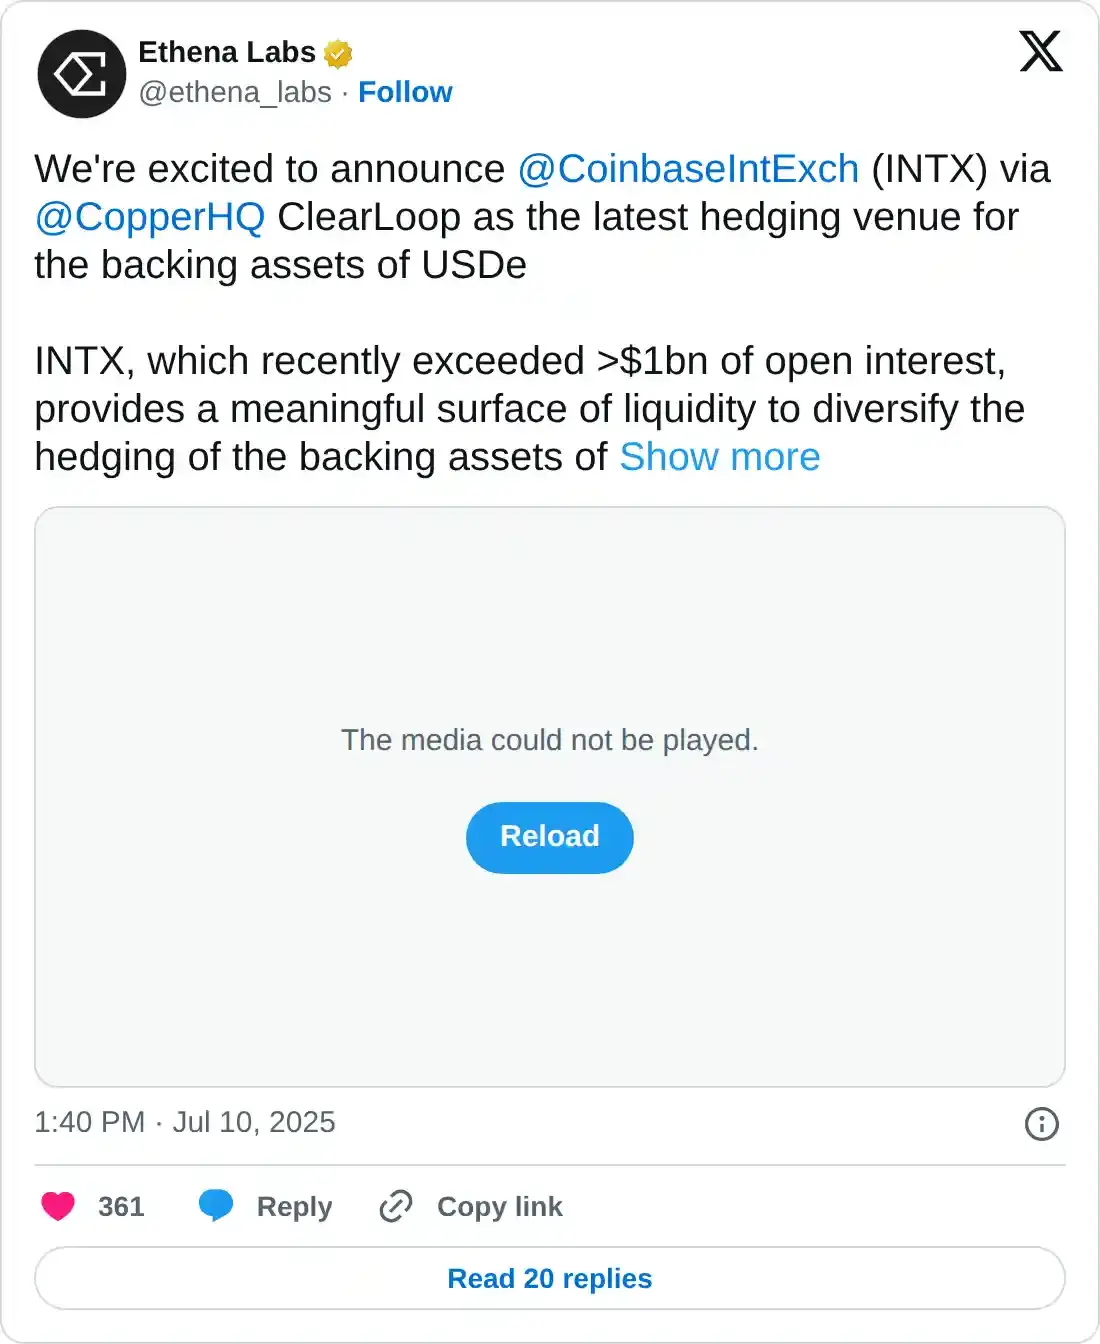
- Ethena Labs announces Coinbase International Exchange via Copper Clearloop as the latest hedging venue for assets backing its stablecoin, USDe.
Ethena (ENA) edges higher by 20% at press time on Friday, printing its fourth consecutive bullish day. The surge in buying pressure could be triggered by the increased volumes from the Korean market after the Upbit listing on Friday.
Furthermore, Ethena Labs’ announcement of a new hedging venue for its stablecoin, USDe, on Coinbase International Exchange (INTX) via Copper Clearloop fuels the bullish sentiment.
Upbit’s listing of Ethena’s ENA sparks trading volume by 300%
South Korea’s largest crypto exchange, Upbit, announced the listing of Ethena’s ENA against three pairs: Korean Won (KRW), Bitcoin (BTC), and Tether’s USD-pegged stablecoin (USDT). Trading began on Friday at 17:00 Korean Standard Time.
CoinMarketCap data shows Ethena’s trading volume soared by 300% in the last 24 hours, reaching $1 billion amid the listing gains. As the heightened volumes support the bullish run in ENA, it increases the possibility of extended gains ahead.
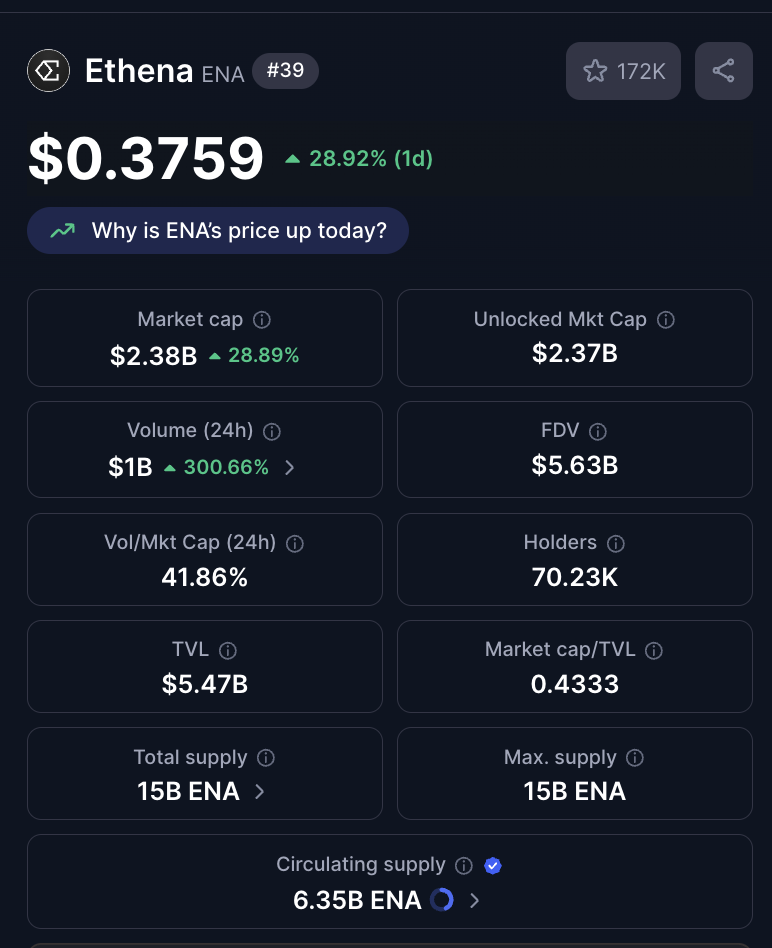
Ethena market data. Source: CoinMarketCap
New hedging venue for assets backing Ethena’s stablecoin
Coinbase International Exchange (INTX) announced the integration of Copper Clearloop, a collateral management for digital assets, on Thursday, enabling off-exchange trade settlement for institutions. Ethena Labs announces the partnership as a new avenue to hedge the assets backing its stablecoin, USDe.
The settlement will occur every hour, 365 days a year, to reduce counterparty risk. Ethena Labs adds INTX to the list of hedging venues alongside Binance, Bybit, OKX, Deribit, and Bitget.
Ethena’s trendline breakout rally targets the 200-day EMA
Ethena extends the bullish run above the 100-day Exponential Moving Average (EMA) at $0.3363 and the $0.3800 round figure, marking the highest price in over a month. The sudden recovery in ENA exceeds the six-month resistance trendline formed by joining the peaks of January 17 and May 13.
The uptrend targets the 200-day EMA at $0.4143 as the immediate dynamic resistance. Sidelined investors seeking entry opportunities could target a positive close above the 200-day EMA, with the next resistance level at $0.4614, the high of May 13.
The Relative Strength Index (RSI) reads 70, showing a parabolic rise to the overbought boundary, which suggests increased buying pressure.
The Moving Average Convergence/Divergence (MACD) indicator displays the MACD and signal lines crossing above the zero level, indicating a bullish shift in trend. A rising trend of the green histogram bars highlights increased bullish momentum.
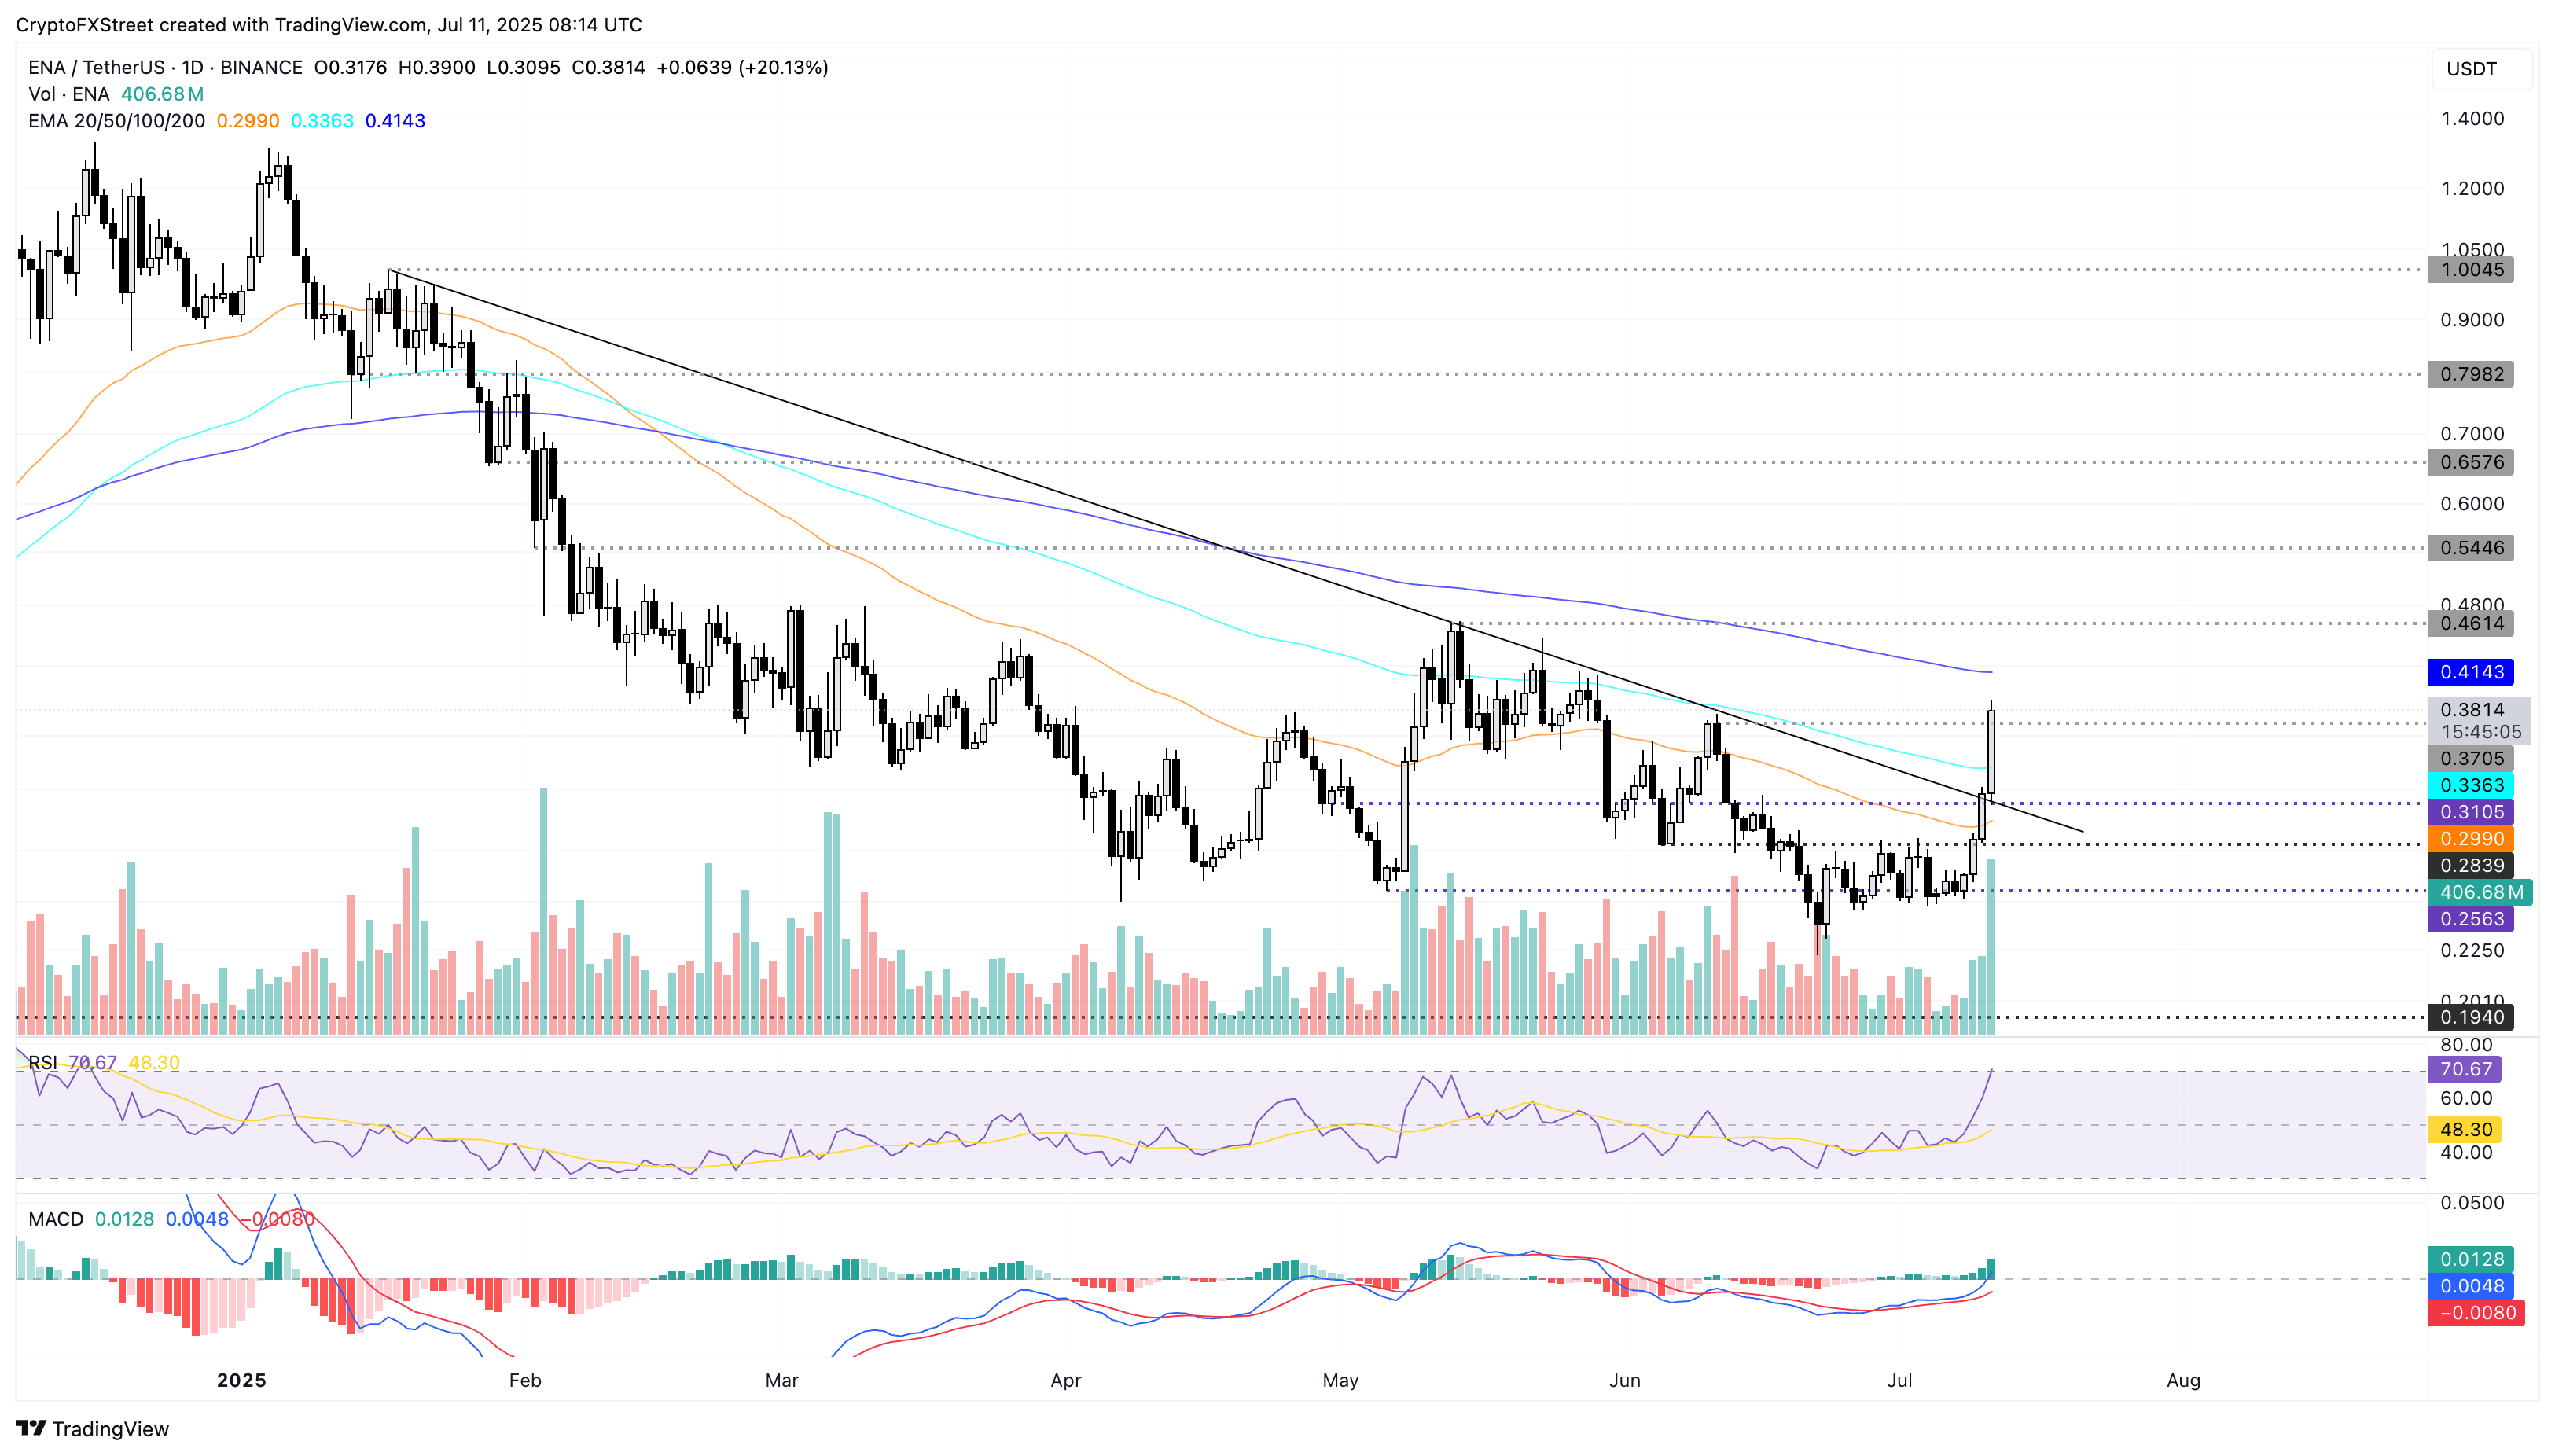
ENA/USDT daily price chart.
However, if ENA loses momentum, a close below the 100-day EMA could extend the decline towards the $0.3000 round figure. A close below the 50-day EMA at $0.2990 would invalidate the trendline breakout.
Bài viết đề xuất


