
Sei Price Forecast: SEI bulls take control as Circle’s native USDC stablecoin and CCTP join its network
- Sei price extends its gains by 8% on Friday after surging nearly 25% so far this week.
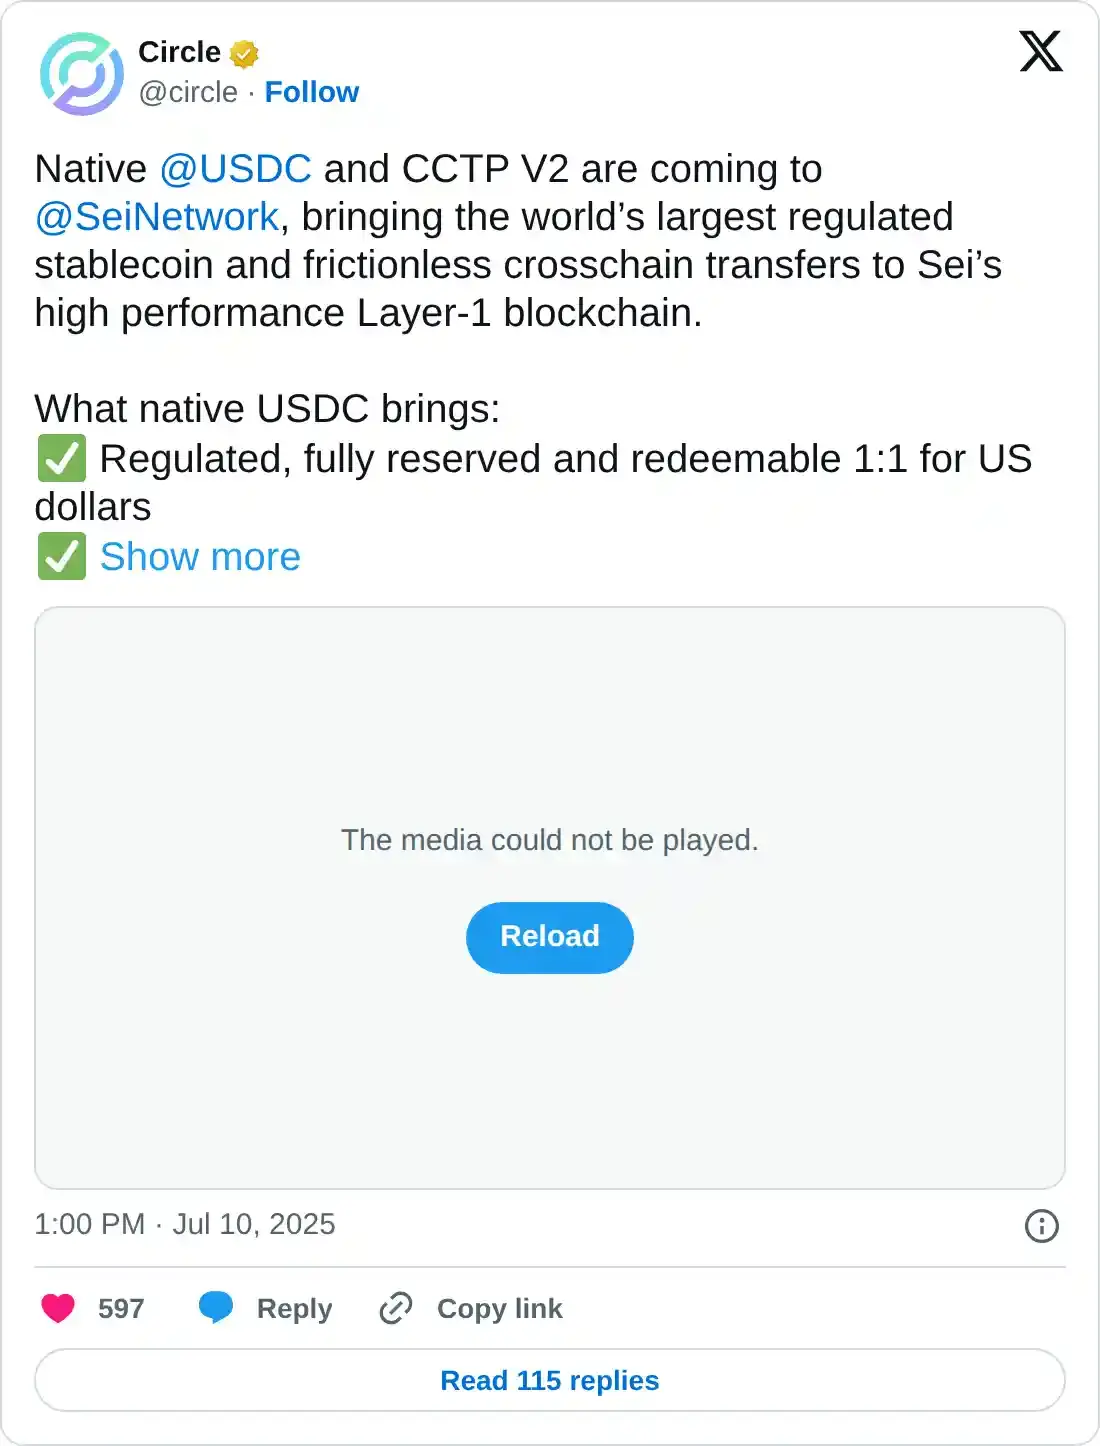
- Circle announced on Thursday that its native USDC stablecoin and CCTP V2 are arriving soon on the Sei network.
- Onchain and derivatives data support further rally as SEI’s TVL and Open Interest reach record levels.
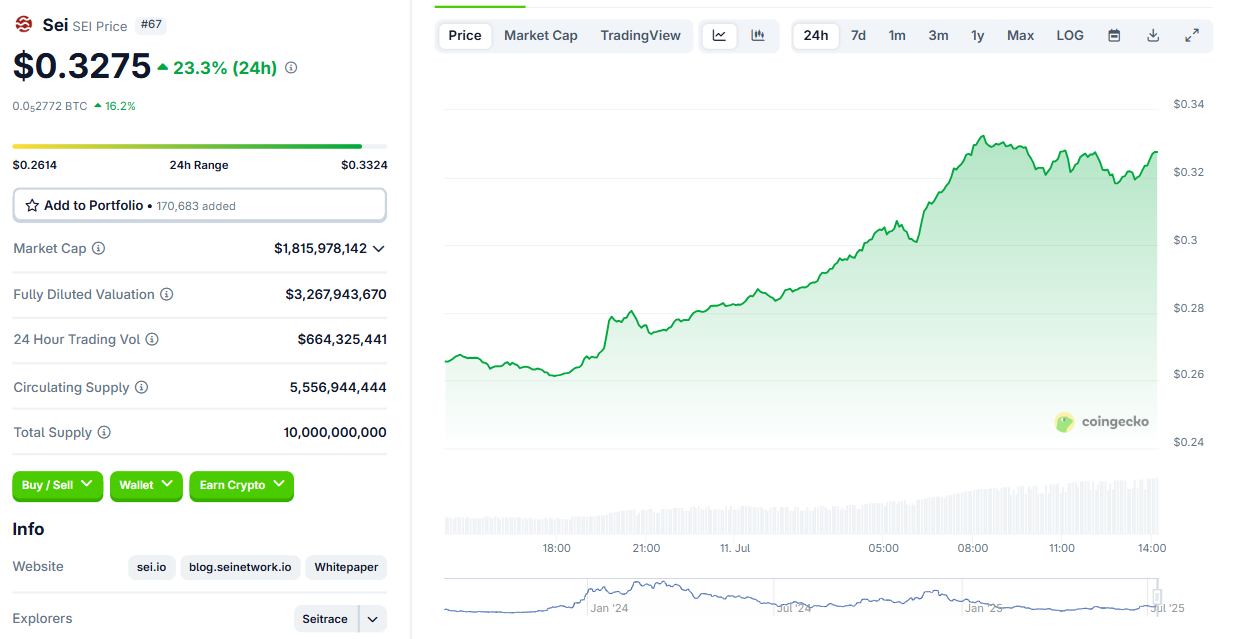
Sei (SEI) continues to extend its gains by nearly 8%, around $0.326 at the time of writing on Friday, after surging nearly 25% so far this week. The main reason for this ongoing rally is the announcement by Circle on Thursday that native USDC stablecoin and Cross-Chain Transfer Protocol (CCTP) V2 will soon be available on the Sei network, sparking renewed investor interest. Additionally, onchain and derivatives data hints at rally continuation as SEI’s both Open Interest (OI) and Total Value Locked (TVL) hit record highs.
Why is SEI rallying?
Sei price has experienced a significant rally, surging nearly 25% so far this week. In the last 24 hours, SEI rallied 23%, as shown in the CoinGecko chart below.
The main reason for this price surge is Thursday's announcement by Circle that native USDC stablecoin and Cross-Chain Transfer Protocol (CCTP) V2 will soon be available on the Sei network, which has renewed investors' interest.
These developments could bring wider adoption, a faster network, and growing activity and interest within Sei’s ecosystem, boosting depositing or utilizing assets within SEI-based protocols.
Another reason for the SEI rally is that Bitcoin reached a new all-time high above $117,000 on Thursday, surpassing its previous highs this week. As the largest cryptocurrency by market capitalization hits record levels, it has triggered wider optimism for the overall crypto markets, with most altcoins, such as SEI, following BTC’s footsteps.
Sei’s open interest and TVL reach record highs
Looking down on Sei's onchain and derivatives data supports a further bullish outlook. Coinglass’ data shows that the futures’ Open Interest (OI) in SEI rose from $238.84 million on Wednesday to $366.97 million on Friday, the new all-time high. An increasing OI represents new or additional money entering the market and new buying, which could fuel the current SEI price rally.
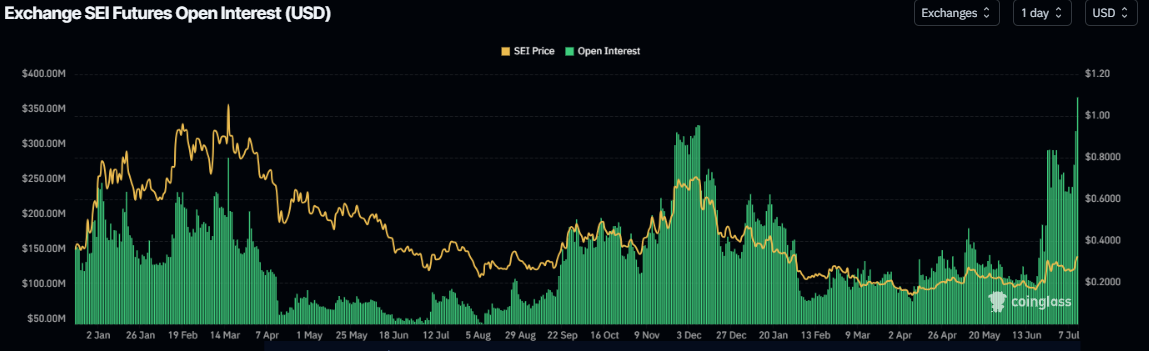
Sei’s open interest chart. Source: Coinglass
DefiLlama data shows that Sei’s Total Value Locked (TVL) increased and reached a new all-time high (ATH) of $1.32 billion on Friday. This increase in TVL indicates growing activity and interest within Sei’s ecosystem, suggesting that more users are depositing or utilizing assets within SEI-based protocols.
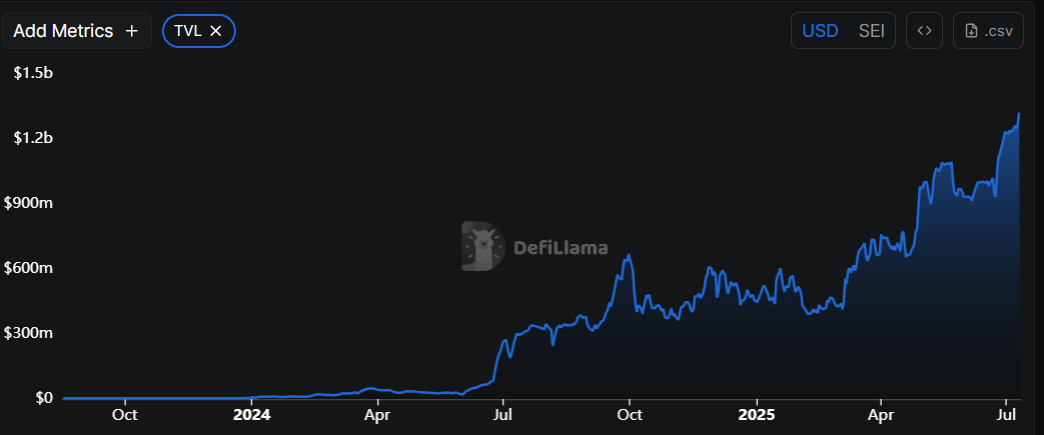
SEI TVL chart. Source: DefiLlama
Sei Price Forecast: Bulls take control of the momentum
Sei price found support around its daily level at $0.254 earlier this week, on Tuesday, and rallied by over 17% in the next two days. This daily support level roughly coincides with the 200-day Exponential Moving Average (EMA) at $0.264, making this a key support zone. At the time of writing on Friday, it continues to trade higher at $0.329.
If SEI mantains its upward trend and closes above the weekly resistance at $0.348 on a daily basis, it could extend the rally toward the 50% Fibonacci retracement level at $0.433, drawn from the December high of $0.737 to the April low of $0.129.
The Relative Strength Index (RSI) on the daily chart reads 69, approaching its overbought level of 70, indicating strong bullish momentum. Moreover, the Moving Average Convergence Divergence (MACD) indicator shows a bullish crossover this Friday, giving buy signals and indicating an upward trend.
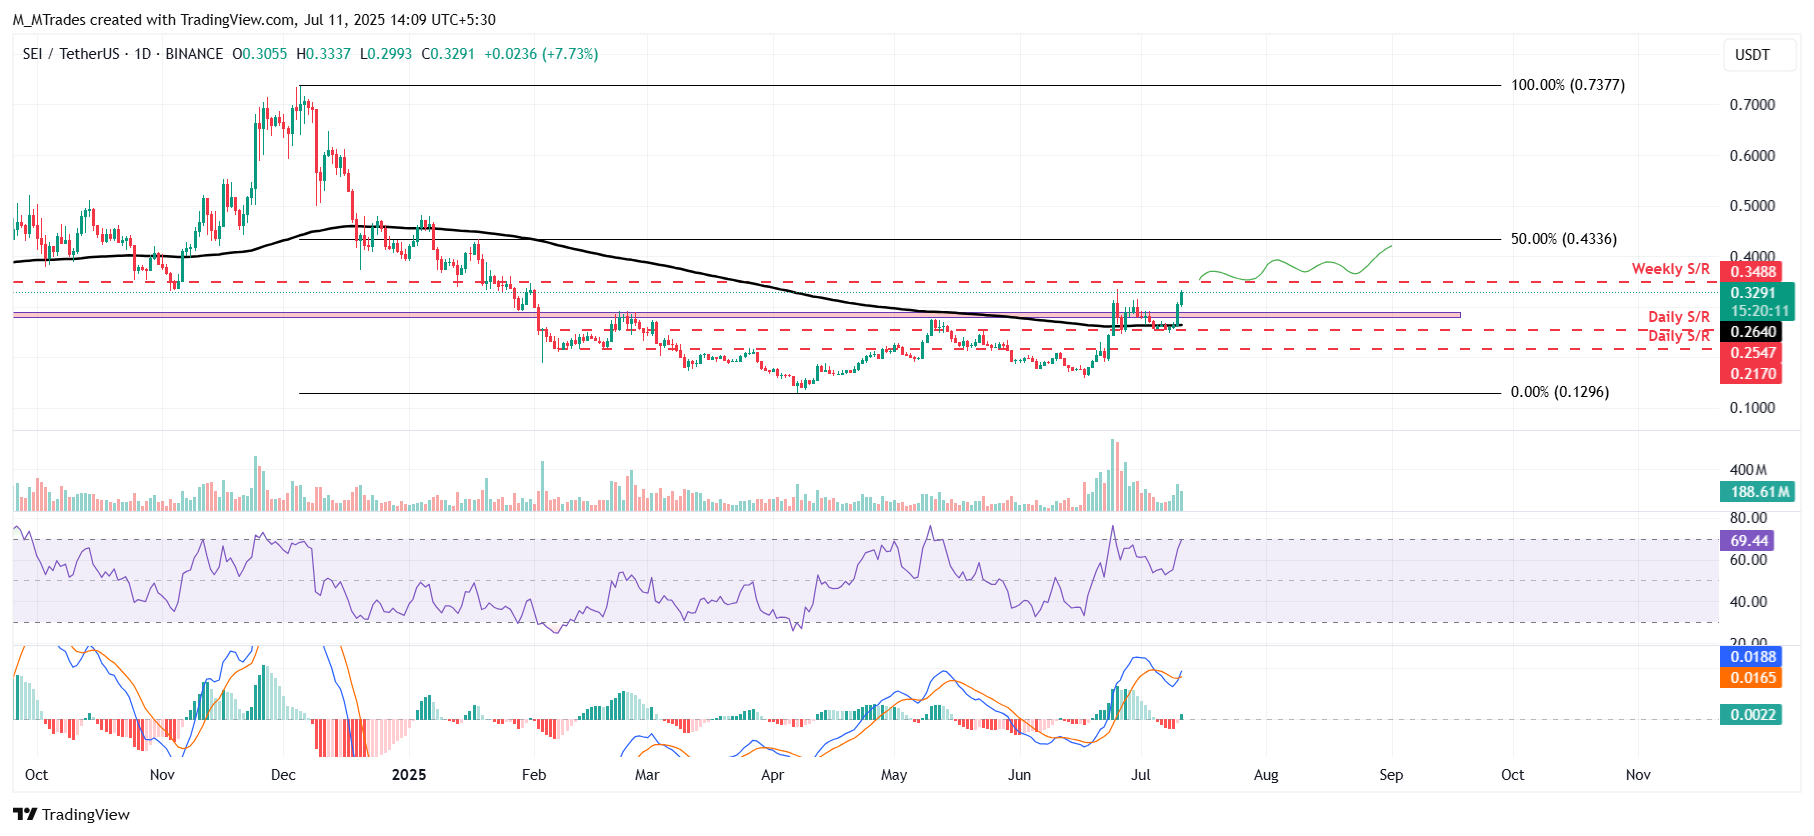
SEI/USDT daily chart
However, if SEI faces a correction, it could extend the decline to find support around its 200-day EMA at $0.264.
Bài viết đề xuất


