
Top 3 Gainers: SEI, PENGU, FARTCOIN – Altcoins post double-digit gains on renewed risk-on sentiment
- Sei extends the weekly run with a double bottom reversal, backed by a bullish momentum shift.
- Pudgy Penguins’ eyes further gains as it edges above the double-digit rise from Thursday.
- Fartcoin aims to extend the breakout of the short-term resistance trendline.
Altcoins such as Sei (SEI), Pudgy Penguins (PENGU), and Fartcoin (FARTCOIN) have recorded double-digit growth over the last 24 hours, outpacing the broader cryptocurrency market. The risk-on sentiment returns to the cryptocurrency market as the US Fed’s Minutes fuel optimism around potential rate cuts, driving Bitcoin (BTC) above $116,000, a record high on Thursday. The technical outlook suggests extended gains as the momentum turns bullish for the crypto gainers.
SEI eyes further gains as bullish momentum holds
Sei edges higher by 8% at press time on Friday, adding to the 15% gains from the day before. The altcoin maintains a bullish outlook with the double bottom reversal from $0.2562 and crossing above the neckline at the June 24 daily close of $0.3068.
A daily close above this level would validate the bullish pattern, potentially stretching the gains towards $0.3642, last tested on January 21.
Still, traders should observe the Moving Average Convergence/Divergence (MACD) indicator that is on the verge of giving a buy signal. A crossover of the MACD line above its signal line would mark a trend reversal sign in SEI.
Meanwhile, the Relative Strength Index (RSI) inches closer to the overbought zone, suggesting increased bullish momentum.
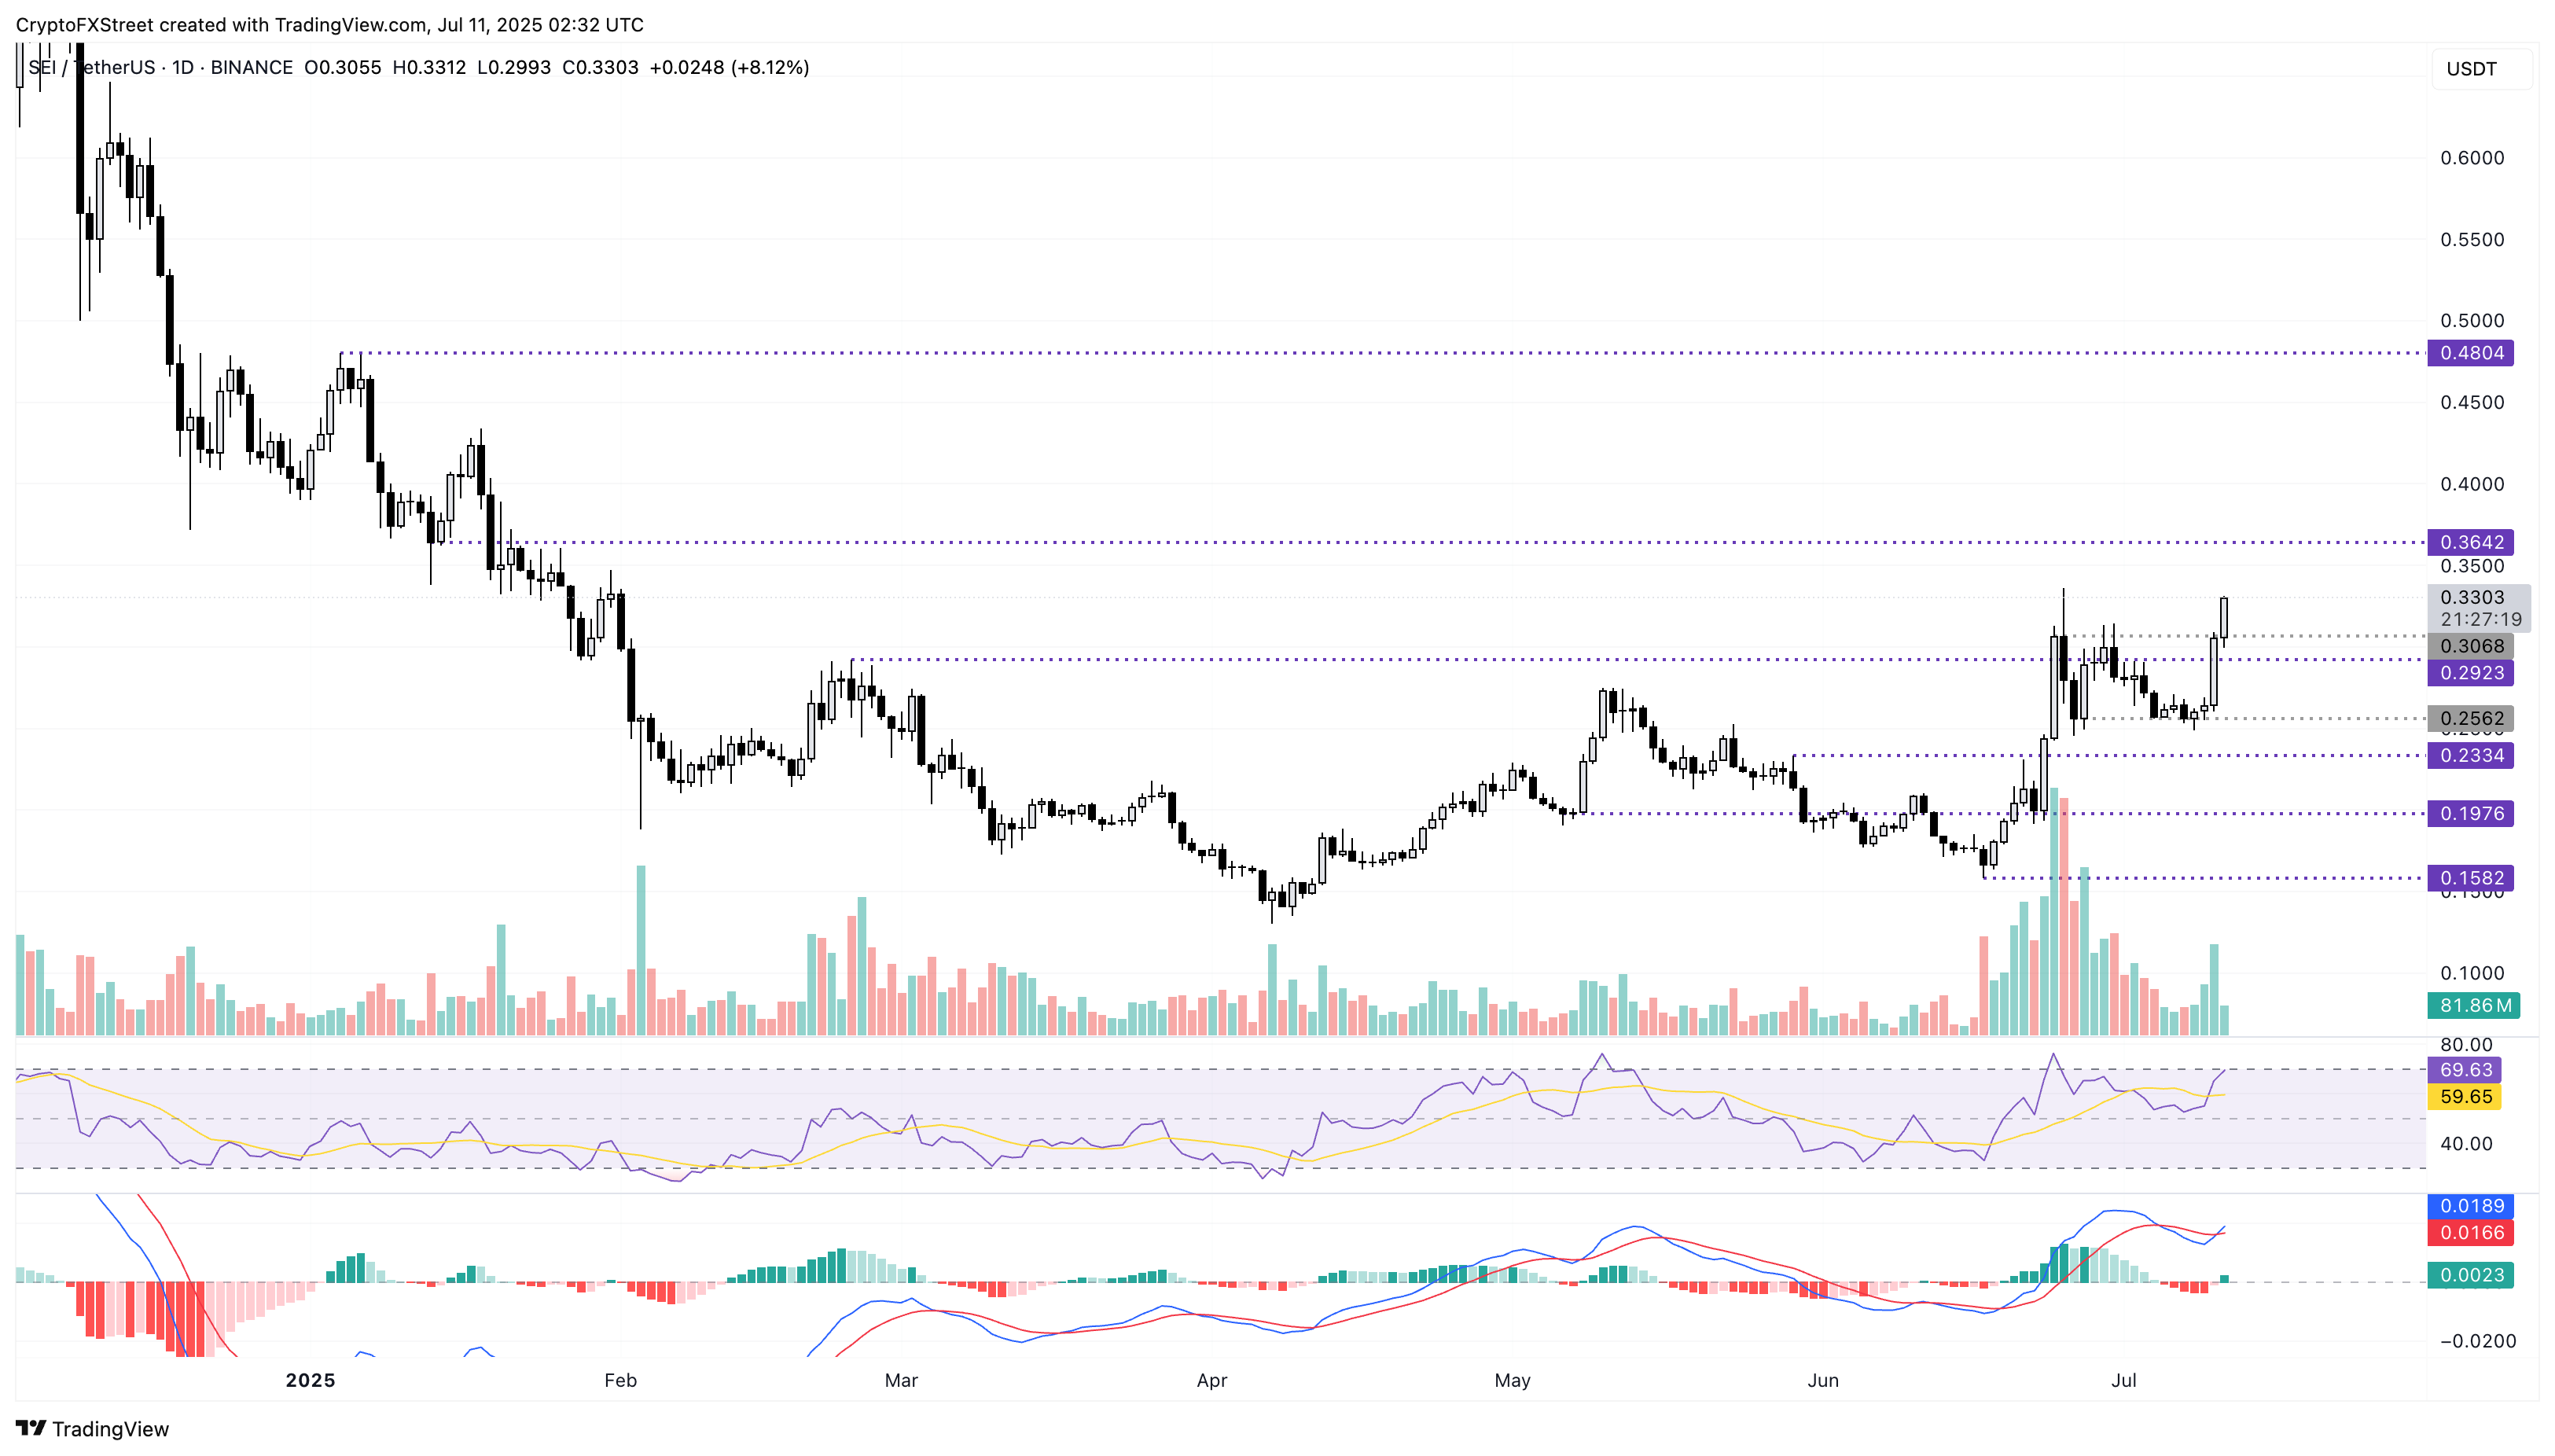
SEI/USDT daily price chart.
However, a pullback to $0.3068 level for a retest remains a possibility if the broader market dynamic shifts.
Pudgy Penguins trend reversal gains traction
PENGU appreciates over 8% on the day, extending the 24% rise from Thursday, reclaiming the $0.02000 psychological level. The recovery run exceeds the 50% Fibonacci retracement at $0.01609, drawn over the decline from $0.07000 on December 17 to the low of April 7 at $0.00370.
Typically, a surge above the 50% retracement level marks a trend reversal with the potential targets at the 61.8% and 78.6% Fibonacci levels. Based on this, traders could find the uptrend in PENGU facing opposition near the $0.02277 level or the $0.03731 mark.
The technical indicators highlight a sudden spike in bullish momentum as the MACD and signal retain their uptrend, avoiding a crossover. Meanwhile, the RSI shoots above the overbought boundary.
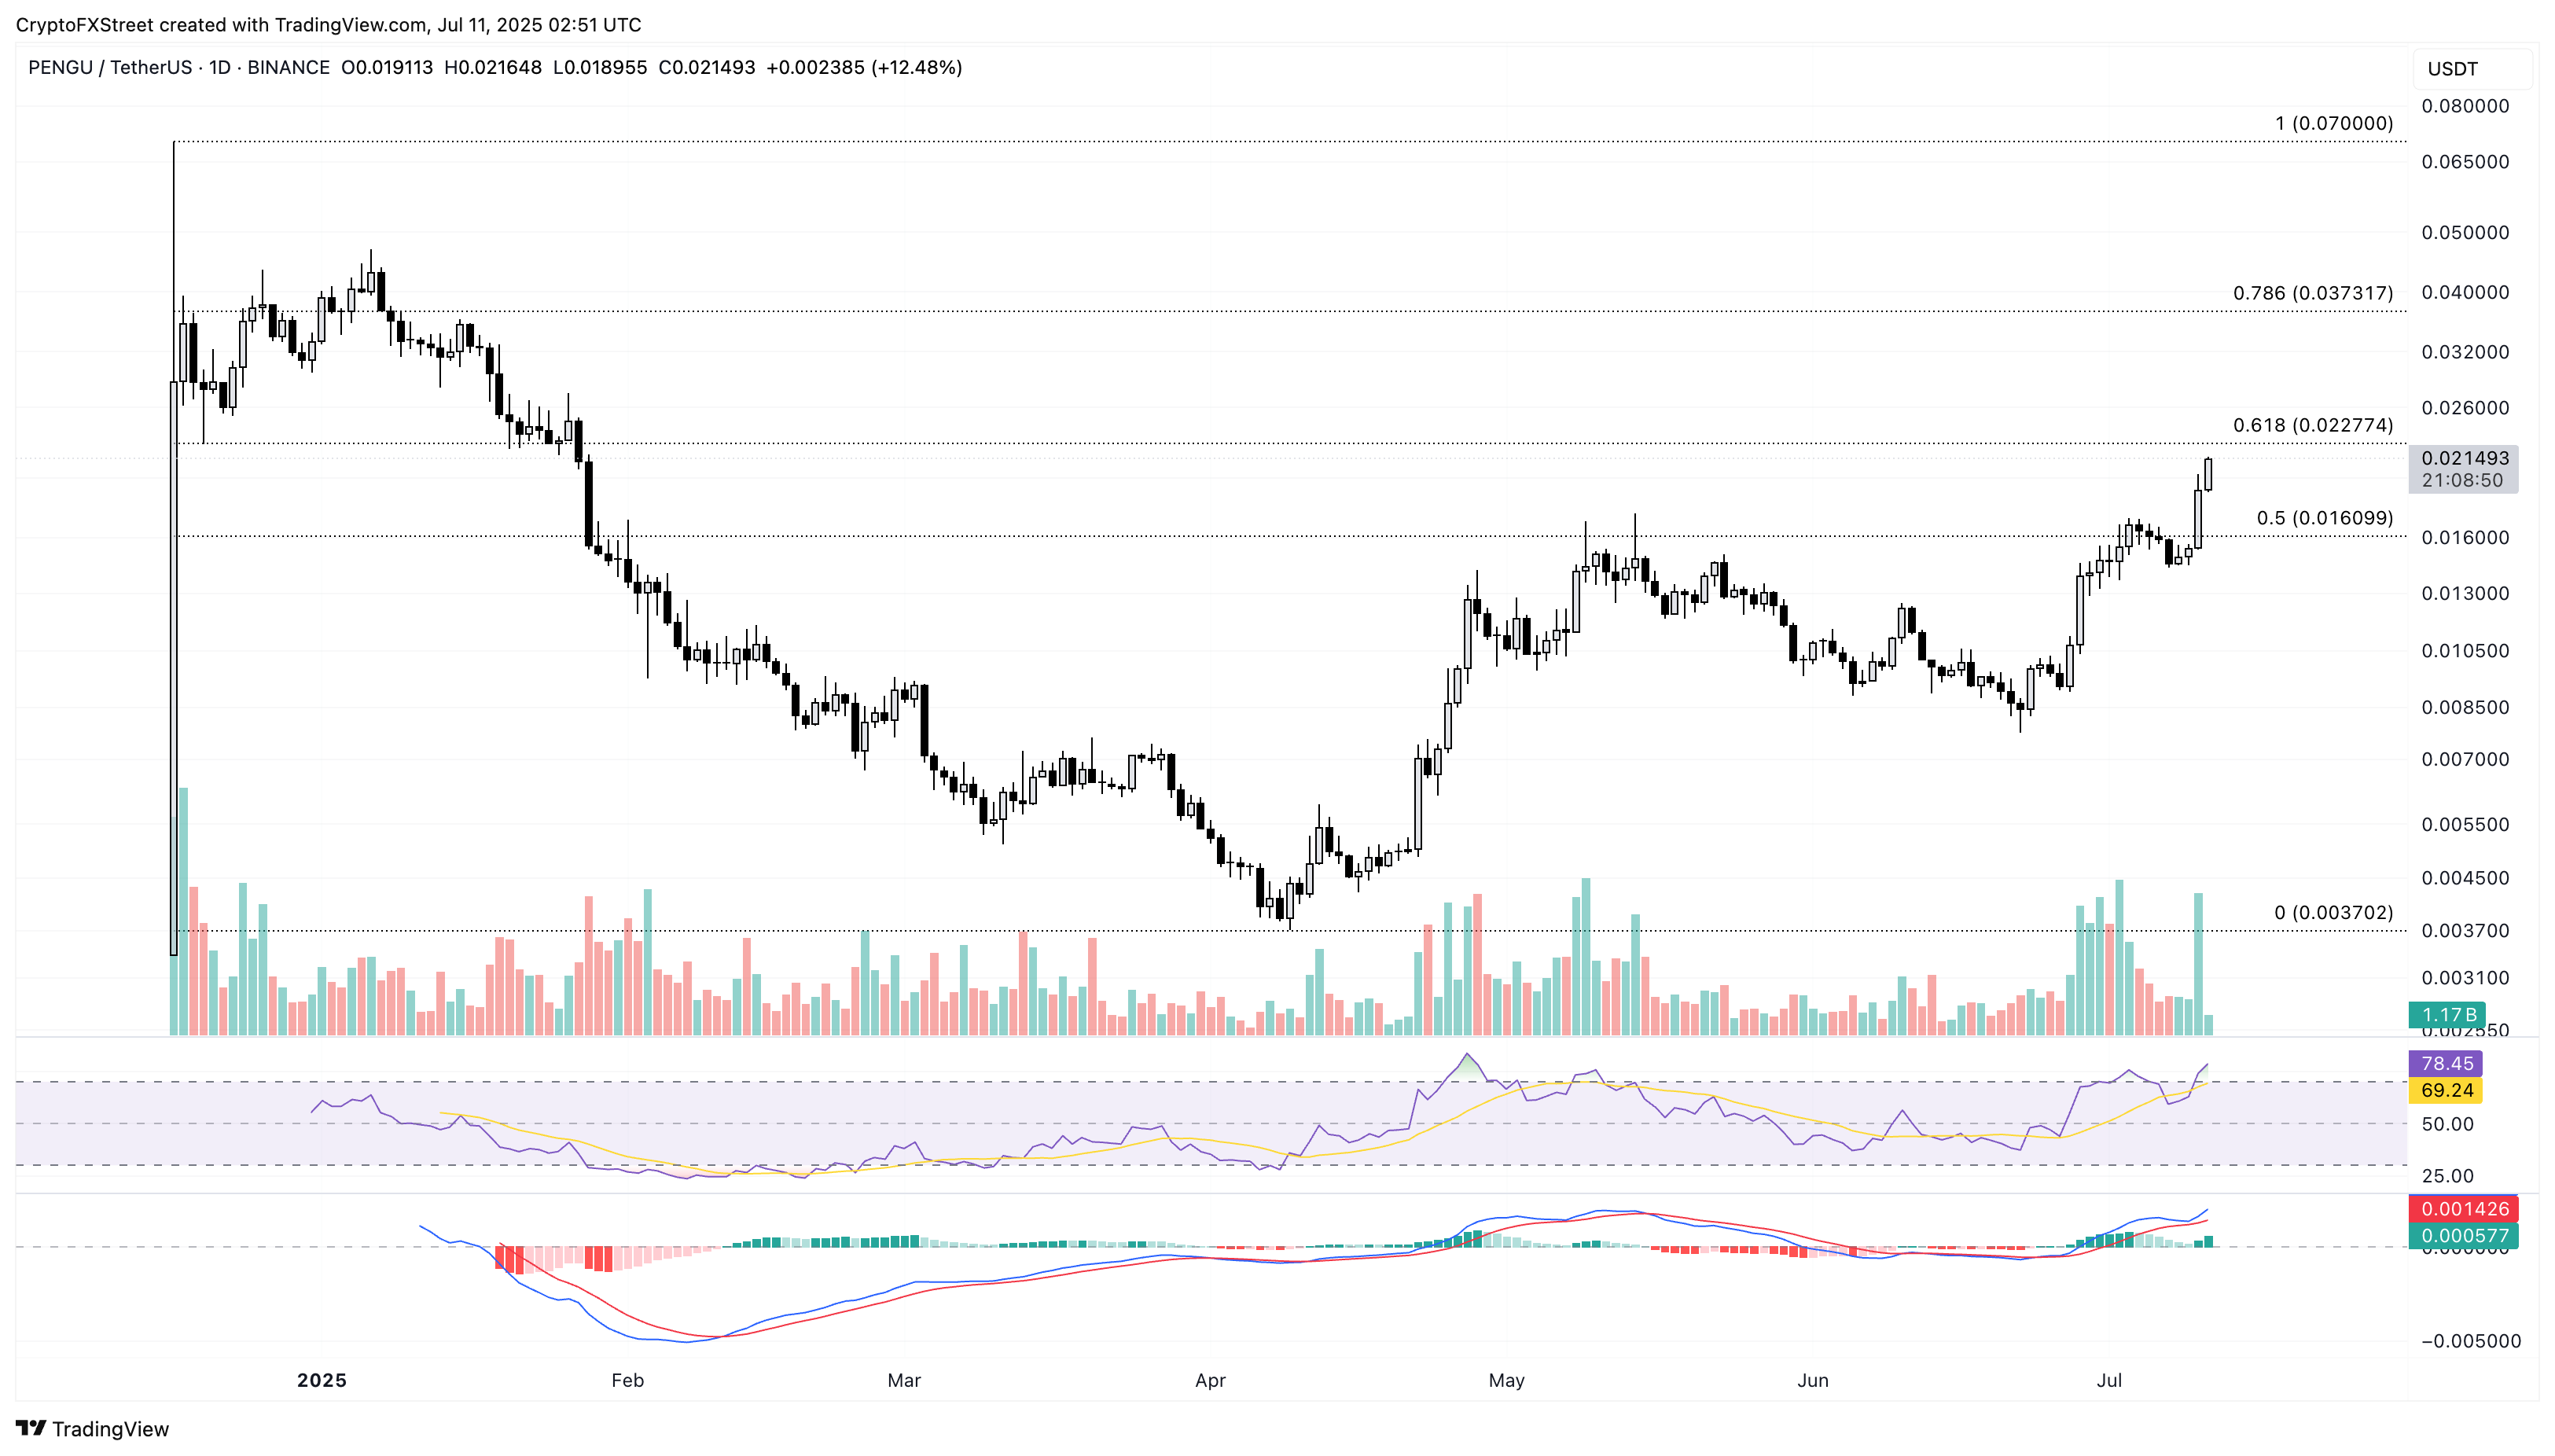
PENGU/USDT daily price chart.
On the downside, a potential pullback in Pudgy Penguins could retest the 50% Fibonacci level at $0.01609.
Fartcoin aims to extend the triangle breakout rally
Fartcoin upholds the recent descending triangle breakout rally. At the time of writing, the meme coin forms a long-shadow Doji candle, holding above its 19% rise from Thursday.
As Fartcoin advances with the triangle breakout, the uptrend could target the $1.39 level marked by the June 10 high. A daily close above this level acts as an entry opportunity with the next potential resistance at $1.56, last tested on May 23.
The technical indicators maintain a bullish bias as the RSI reads 60, holding above the midpoint line, while the MACD indicator displays rising green histogram bars.
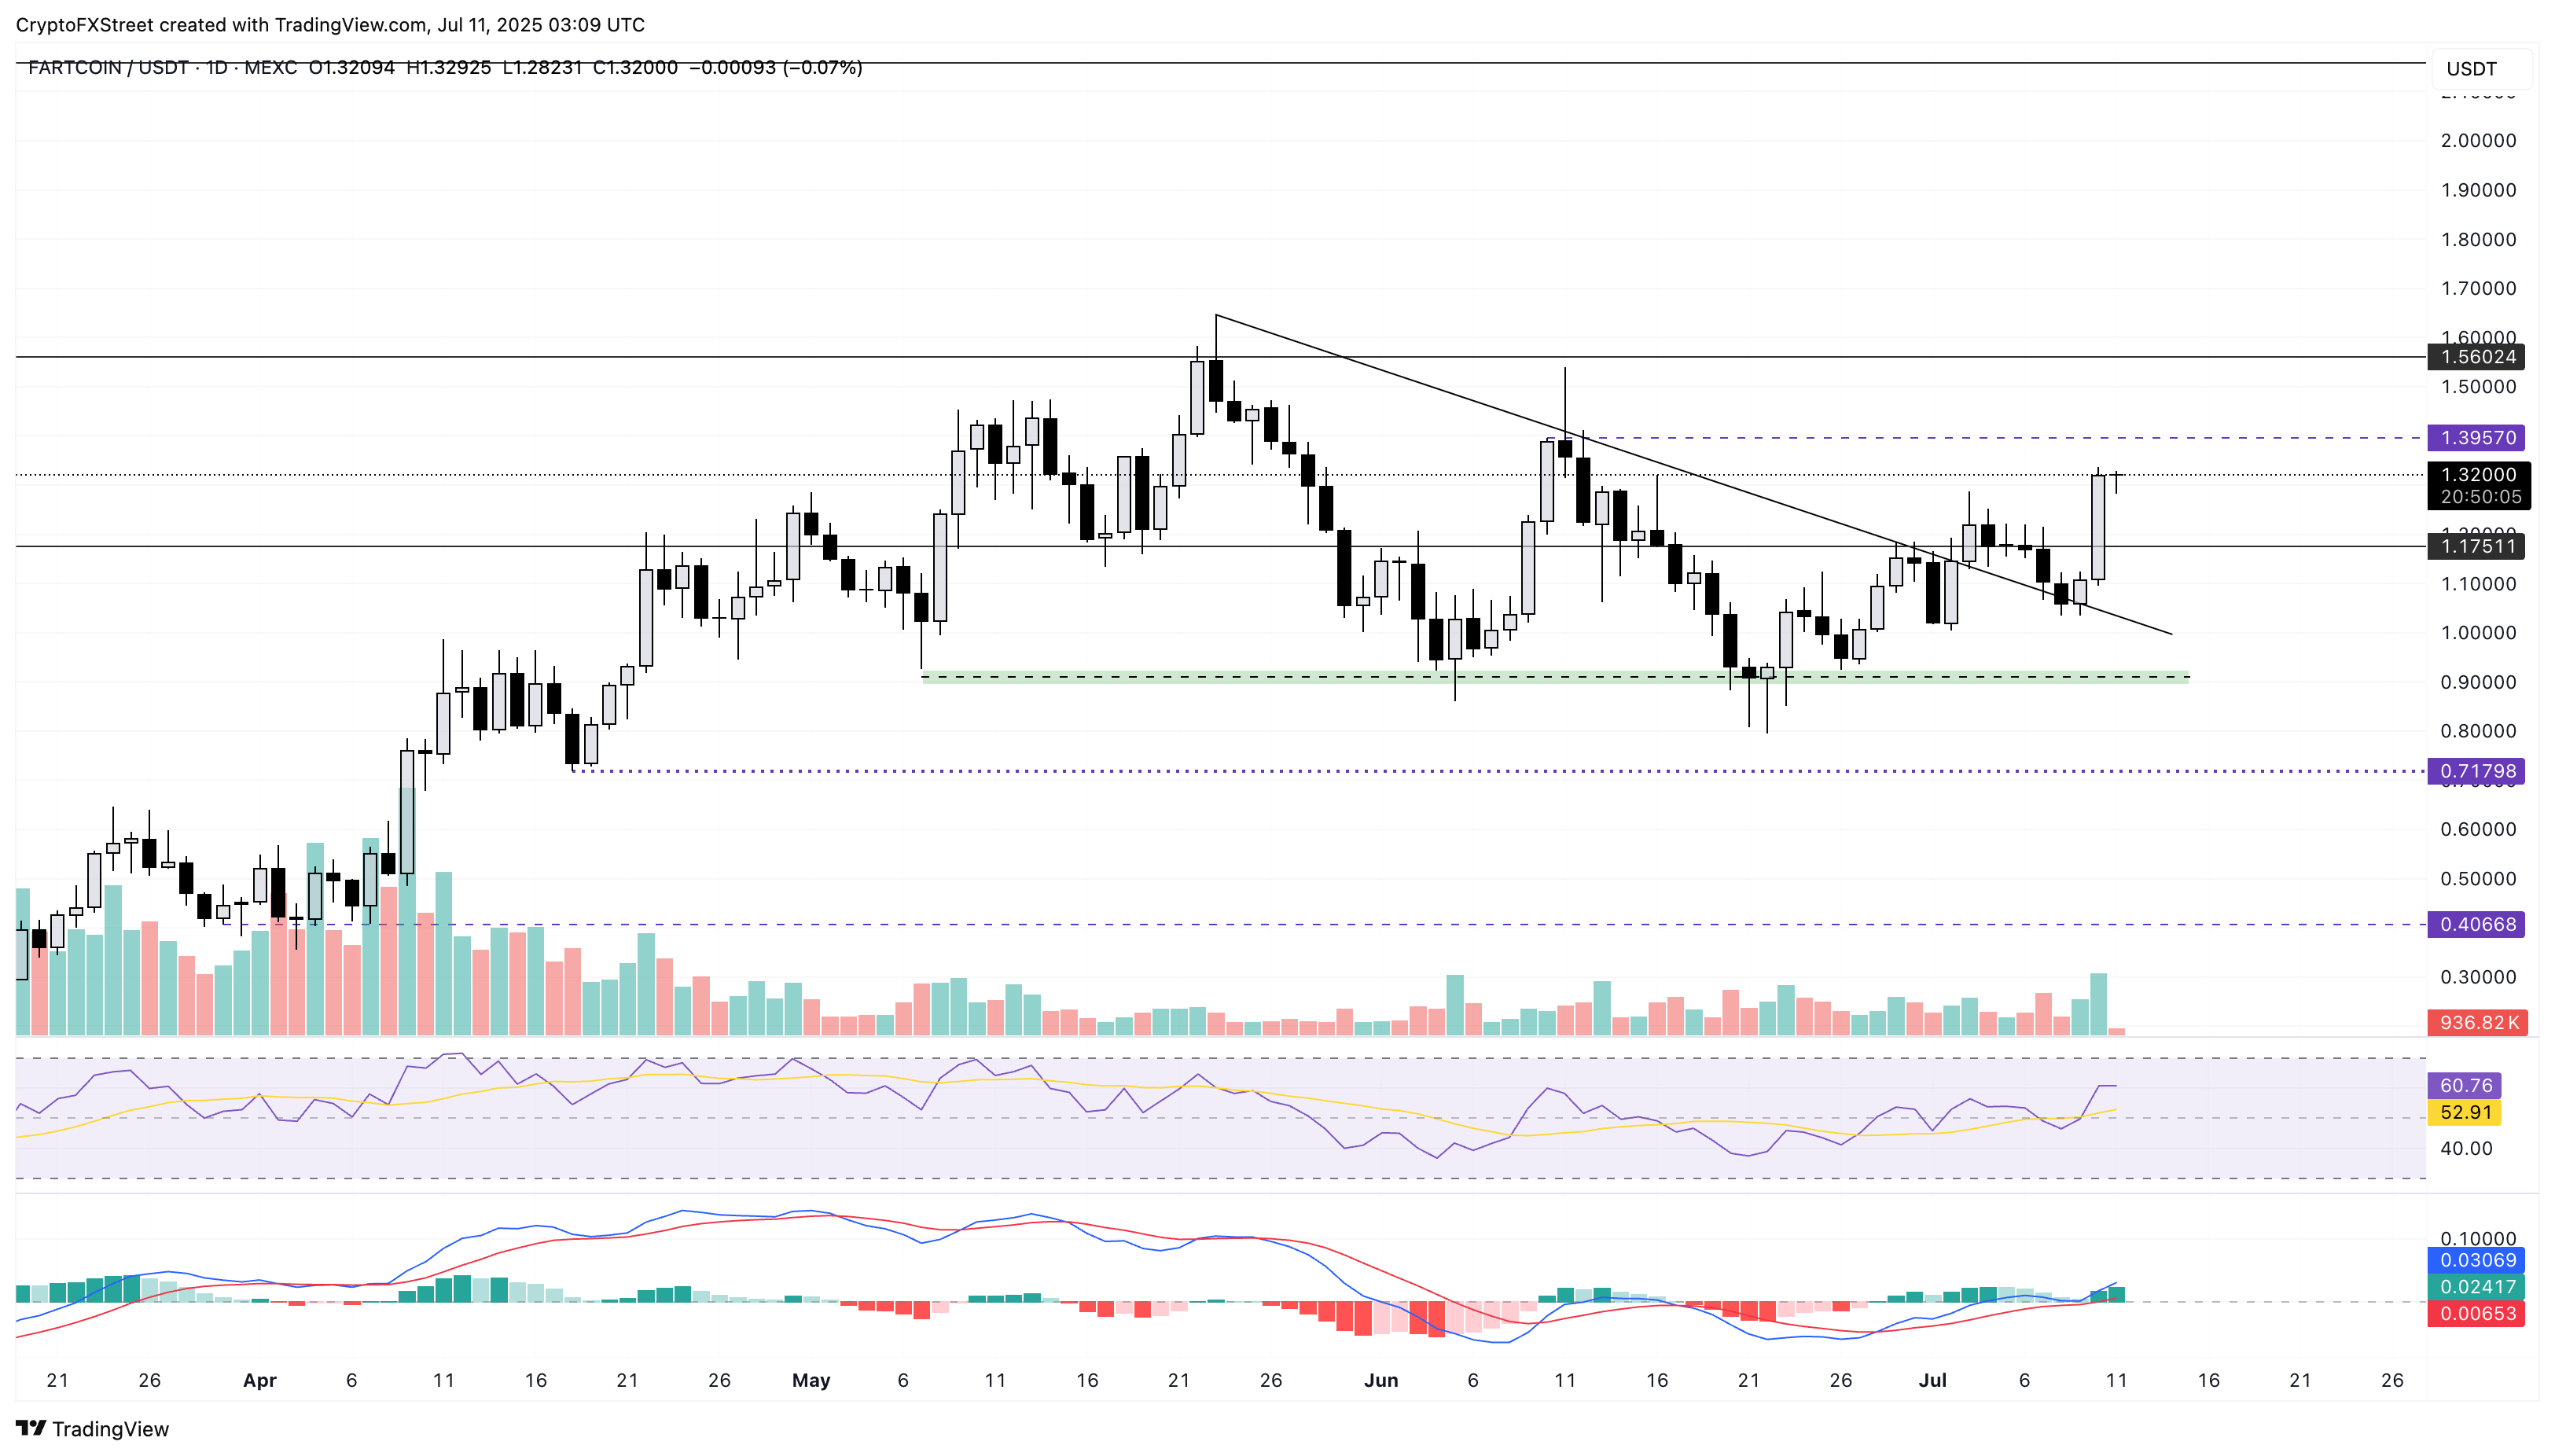
FARTCOIN/USDT daily price chart.
If Fartcoin reverses from the $1.39 resistance, the possibility of the $1.17 level retest cannot be ruled out.
Bài viết đề xuất


