
BNB Price Forecast: BNB extends rally amid partnerships to boost tokenized stocks, treasury company in the US
- BNB price continues to trade higher on Thursday after breaking above a falling wedge pattern at the end of June.
- YZi Labs announced its support for 10X Capital in establishing the BNB Treasury Company in the US.
- Kraken and Backed Finance announced a partnership with BNB Chain on Wednesday to accelerate onchain access to tokenized stocks.
BNB (BNB), formerly known as Binance Coin, continues its upward trend, trading above $670 at the time of writing on Thursday, following a breakout from a falling wedge pattern in late June. The bullish outlook is further supported by growing institutional interest in BNB. On Wednesday, YZi Labs announced its support for 10X Capital in establishing the first BNB Treasury Company in the US. During the same day, Kraken and Backed Finance also announced a new partnership with BNB Chain to launch tokenized stocks, marking a significant step toward integrating real-world assets (RWAs) within the ecosystem.
BNB’s ecosystem could be boosted following the BNB treasury company and tokenized stocks launch
YZi Labs, an investment vehicle that is managed by Binance co-founder Changpeng Zhao’s (CZ) family office, announced on Wednesday its support for 10X Capital, a leading investment firm focused on digital assets & digital asset treasury companies, in establishing the BNB Treasury Company in the US.
The BNB Treasury Company, which intends to pursue a public listing on a major US stock exchange, aims to create a business that will provide US investors with exposure to the growth and benefits of BNB and its ecosystem.
On the same day, crypto exchange Kraken and tokenized asset issuer Backed Finance announced a new partnership with BNB Chain to launch tokenized stocks in the BNB ecosystem.
“As part of the collaboration, Backed will deploy xStocks – the industry standard for tokenized equities – on BNB Chain as BEP-20 tokens, giving users seamless access to tokenized representations of U.S.-listed stocks and ETFs,” said Kraken in its blog post.
This includes assets such as Apple (AAPLx), Tesla (TSLAx), and the S&P 500 ETF (SPYx), as well as bringing traditional equities on-chain and opening access for underserved markets worldwide.
These partnerships, along with the establishment of the BNB Treasury Company and the tokenization of equities, provide a bullish outlook for its native token, BNB, as it increases exposure, growth, liquidity, and wider adoption in the long term.
BNB Price Forecast: BNB bulls aiming for $709 mark
BNB price broke above the upper trendline of a falling wedge pattern on June 28 and rose 3% in the next 11 days until Wednesday. This pattern is formed by connecting multiple highs and lows with a trendline from mid-May, and the breakout indicates a bullish bias. At the time of writing on Thursday, BNB continues to trade higher above $672.
If BNB continues its upward trend, it could extend the rally toward its weekly resistance at $709.29.
The Relative Strength Index (RSI) on the daily chart reads 61, above its neutral level of 50, indicating bullish momentum. The Moving Average Convergence Divergence (MACD) indicator displayed a bullish crossover at the end of June. It also shows rising green histogram bars above its neutral zero line, suggesting bullish momentum is gaining traction and continuing an upward trend.
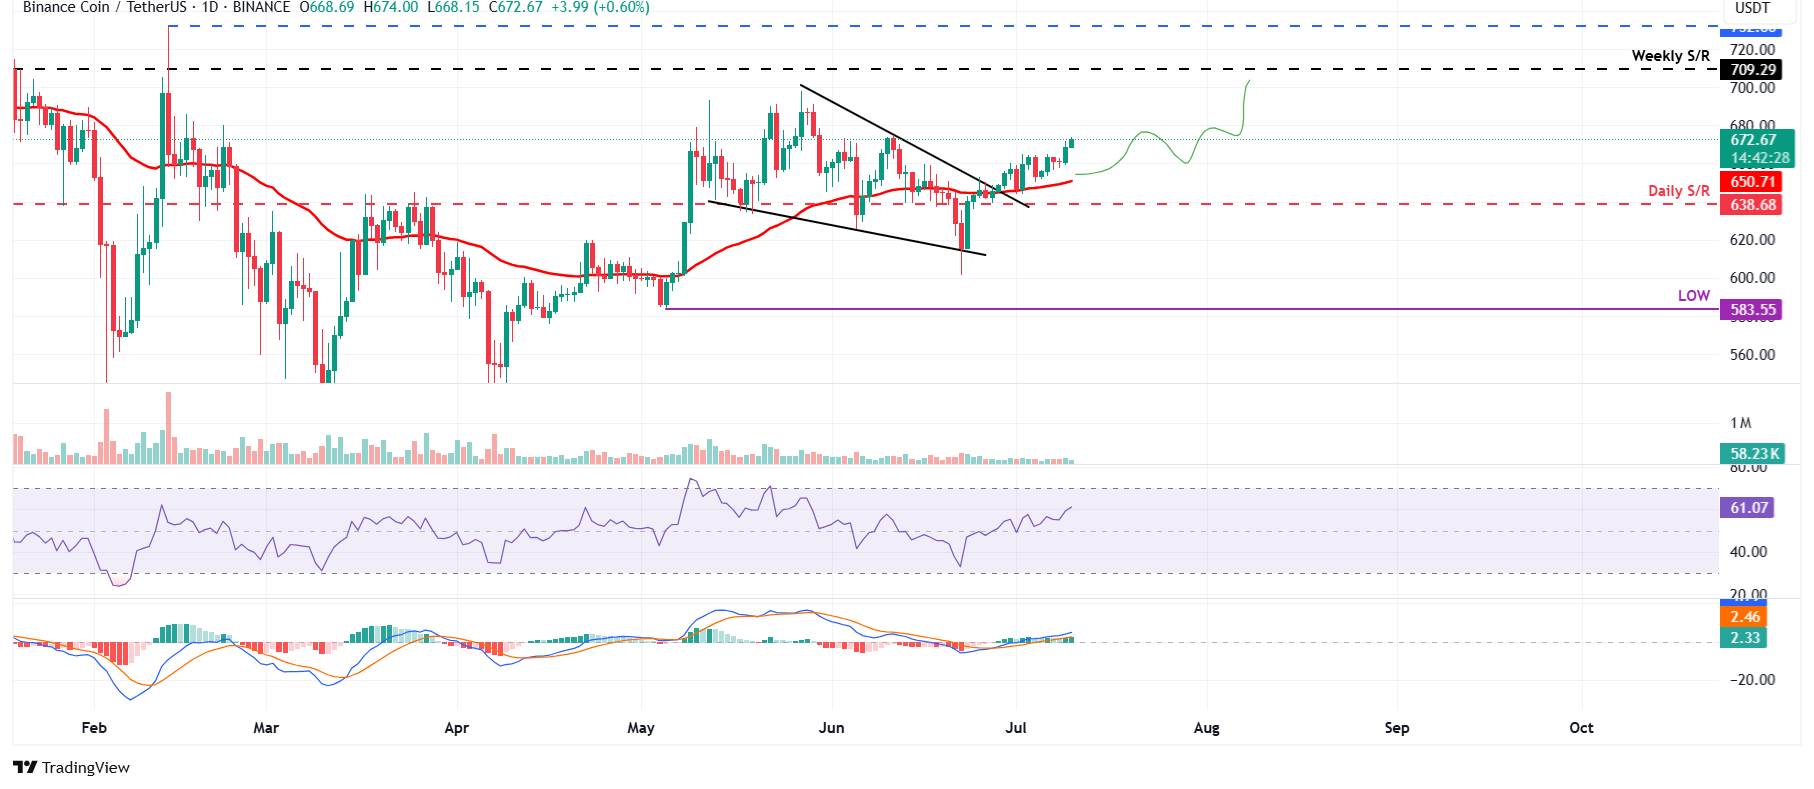
BNB/USDT daily chart
However, if BNB faces a correction, it could extend the decline to find support around the 50-day Exponential Moving Average (EMA) at $650.71, just above the next daily support level at $638.68.
Bài viết đề xuất


