Crypto Gainers Price Prediction: CRO, ZEC, FLOKI struggle to extend gains after double-digit rise
- Cronos ticks lower after a sudden 20% surge on Tuesday, eyes 200-day EMA breakout.
- Zcash edges lower from a crucial resistance as it loses steam after a 12% surge the previous day.
- Floki’s falling channel breakout rally eyes further gains to reclaim a psychological level.
Layer-1 cryptocurrencies Cronos (CRO) and Zcash (ZEC), alongside the meme coin Floki (FLOKI), recorded a double-digit rise on Tuesday, outpacing the market in 24-hour gains at press time on Wednesday. However, as the crypto gainers reach crucial resistances, momentum wanes, and the struggle to extend gains begins. The technical outlook shares a mixed signal as the cryptocurrencies reach a crossroads.
Cronos takes a breather after the 20% surge
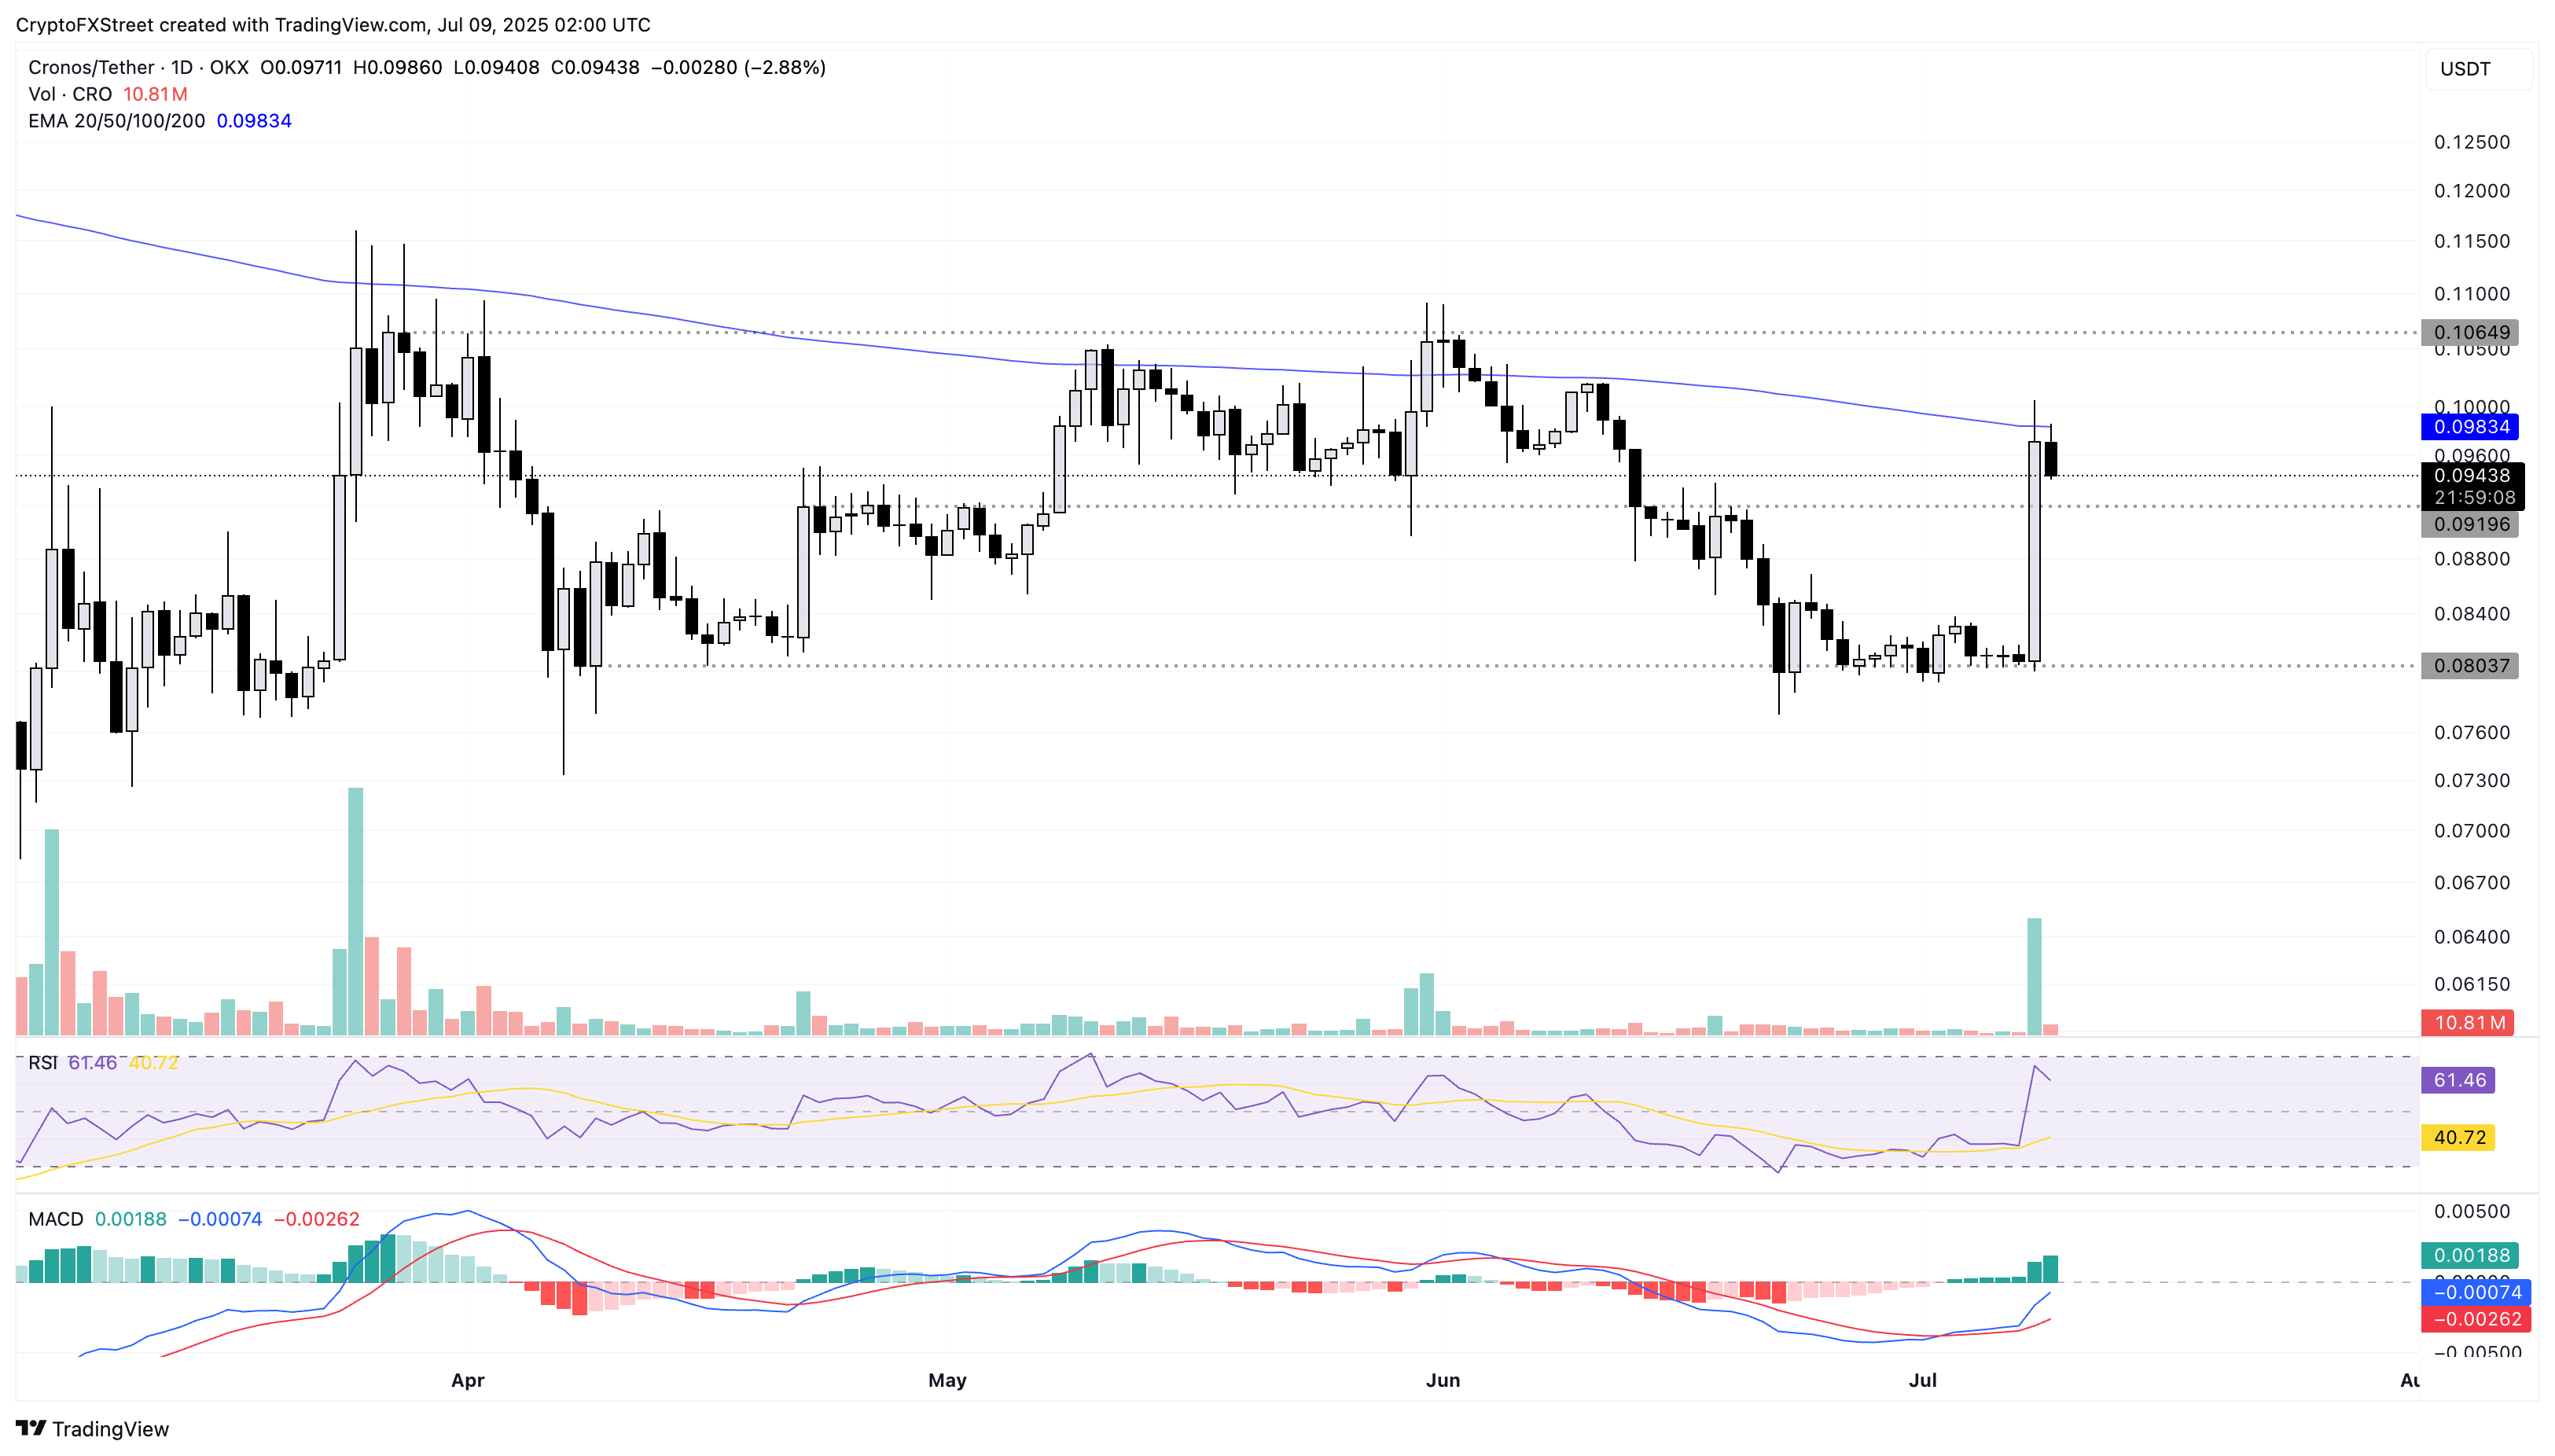
Cronos ticks lower by over 2% at press time on Wednesday as it reverses from the 200-day Exponential Moving Average (EMA) at $0.09834. CRO jumped 20% on Tuesday, as the Trump Media and Technology Group (DJT) included Cronos in the Blue Chip exchange-traded fund (ETF) filing.
The altcoin created a bullish engulfing candle after days of consolidation at the $0.080 support floor. To extend gains, CRO must attain a daily close above the 200-day EMA, potentially targeting the $0.10649 level, last tested on June 1.
The technical indicators maintain a bullish bias, as the Moving Average Convergence/Divergence (MACD) indicator displays a spike in the MACD and signal line, which are rising towards the zero line. A new wave of bullish histograms from the reference line suggests increased momentum.
The Relative Strength Index (RSI) is at 61, ticking lower from the overbought zone due to the intraday pullback. Overall, the RSI suggests a bullish momentum as it remains above the 50% halfway line.

CRO/USDT daily price chart.
If CRO extends the intraday pullback, it could test the immediate support level at $0.09196.
Zcash recovery hits a crucial resistance
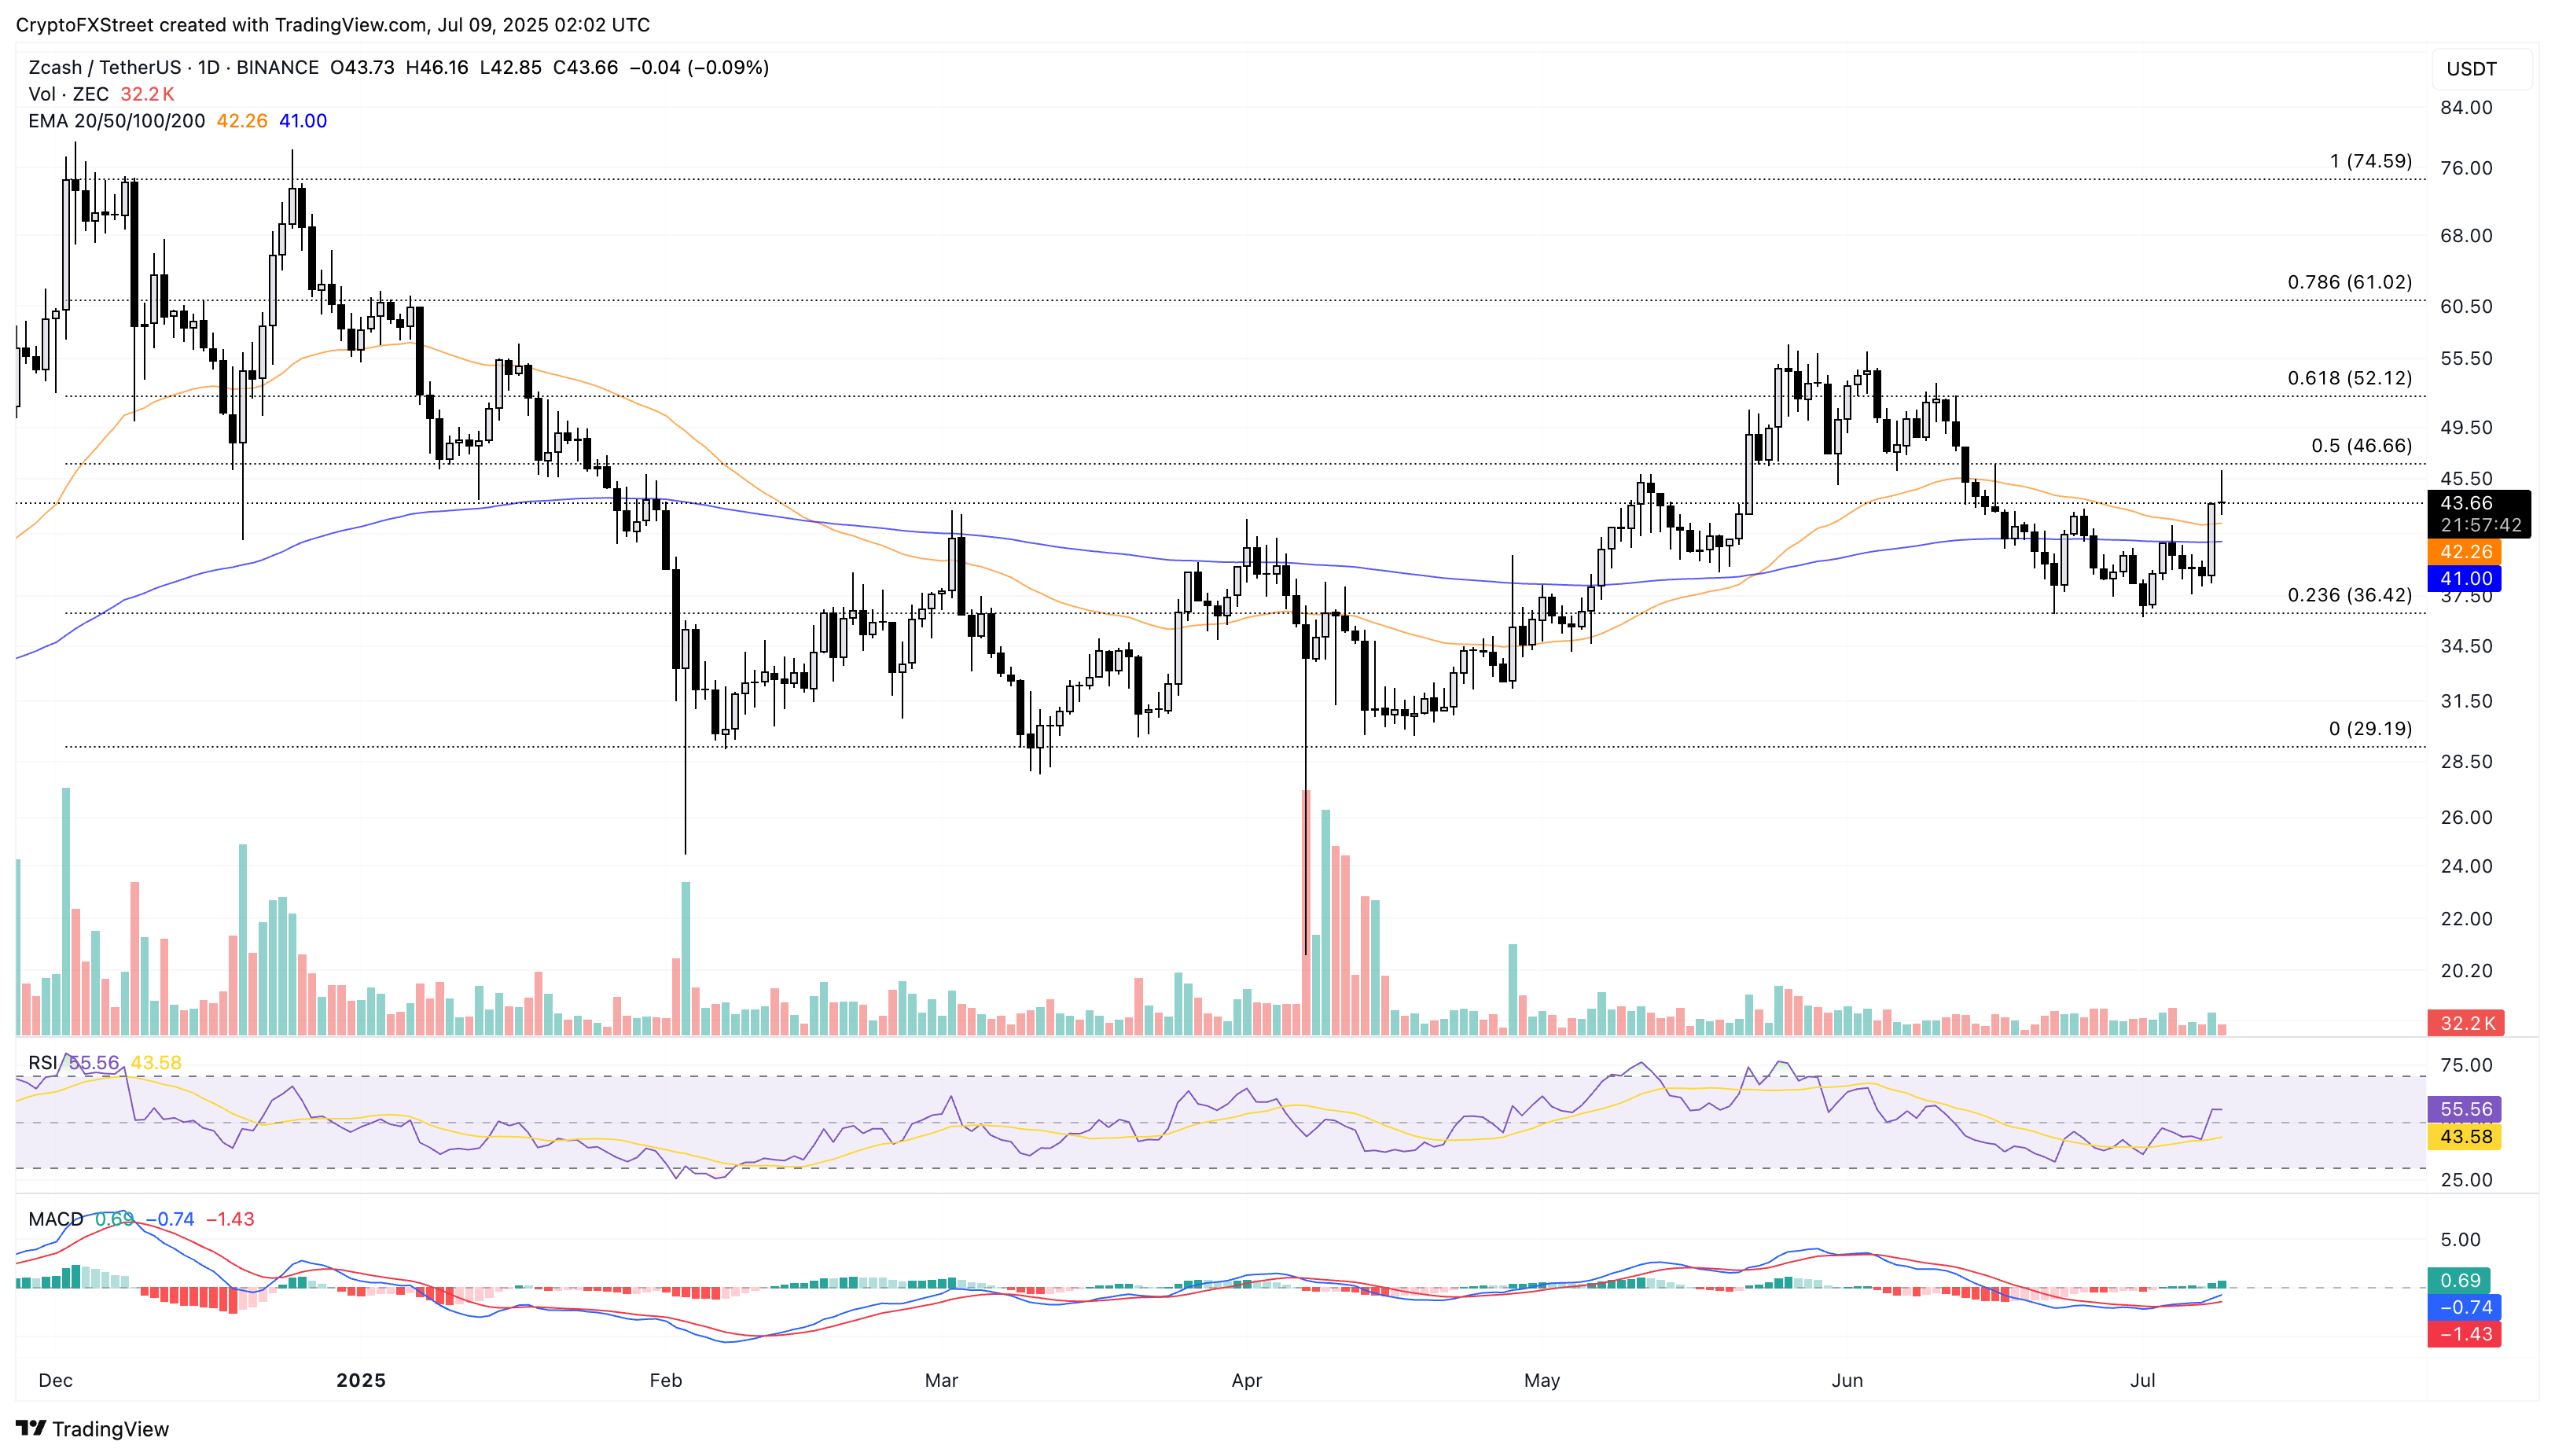
Zcash ticks lower at press time on Wednesday, following the 12% jump the previous day. The layer-1 privacy coin exceeds the 50-day and 200-day EMAs with a bullish engulfing candle on Tuesday.
However, ZEC struggles to overcome the 50% Fibonacci retracement level at $46.66, drawn from the $74.59 on December 2 to the $29.19 base on March 10. A decisive push above $46.66 could extend the uptrend towards the 61.8% Fibonacci level at $52.12.
The RSI is at 55, indicating a bullish tilt as it rises above the midpoint level. Still, the MACD indicator displays the MACD and signal line rising towards the zero line.

ZEC/USDT daily price chart.
If ZEC fails to hold gains, a close below the 200-day EMA at $41.00 could extend the declining trend toward $36.42.
Floki’s channel breakout targets the 200-day EMA
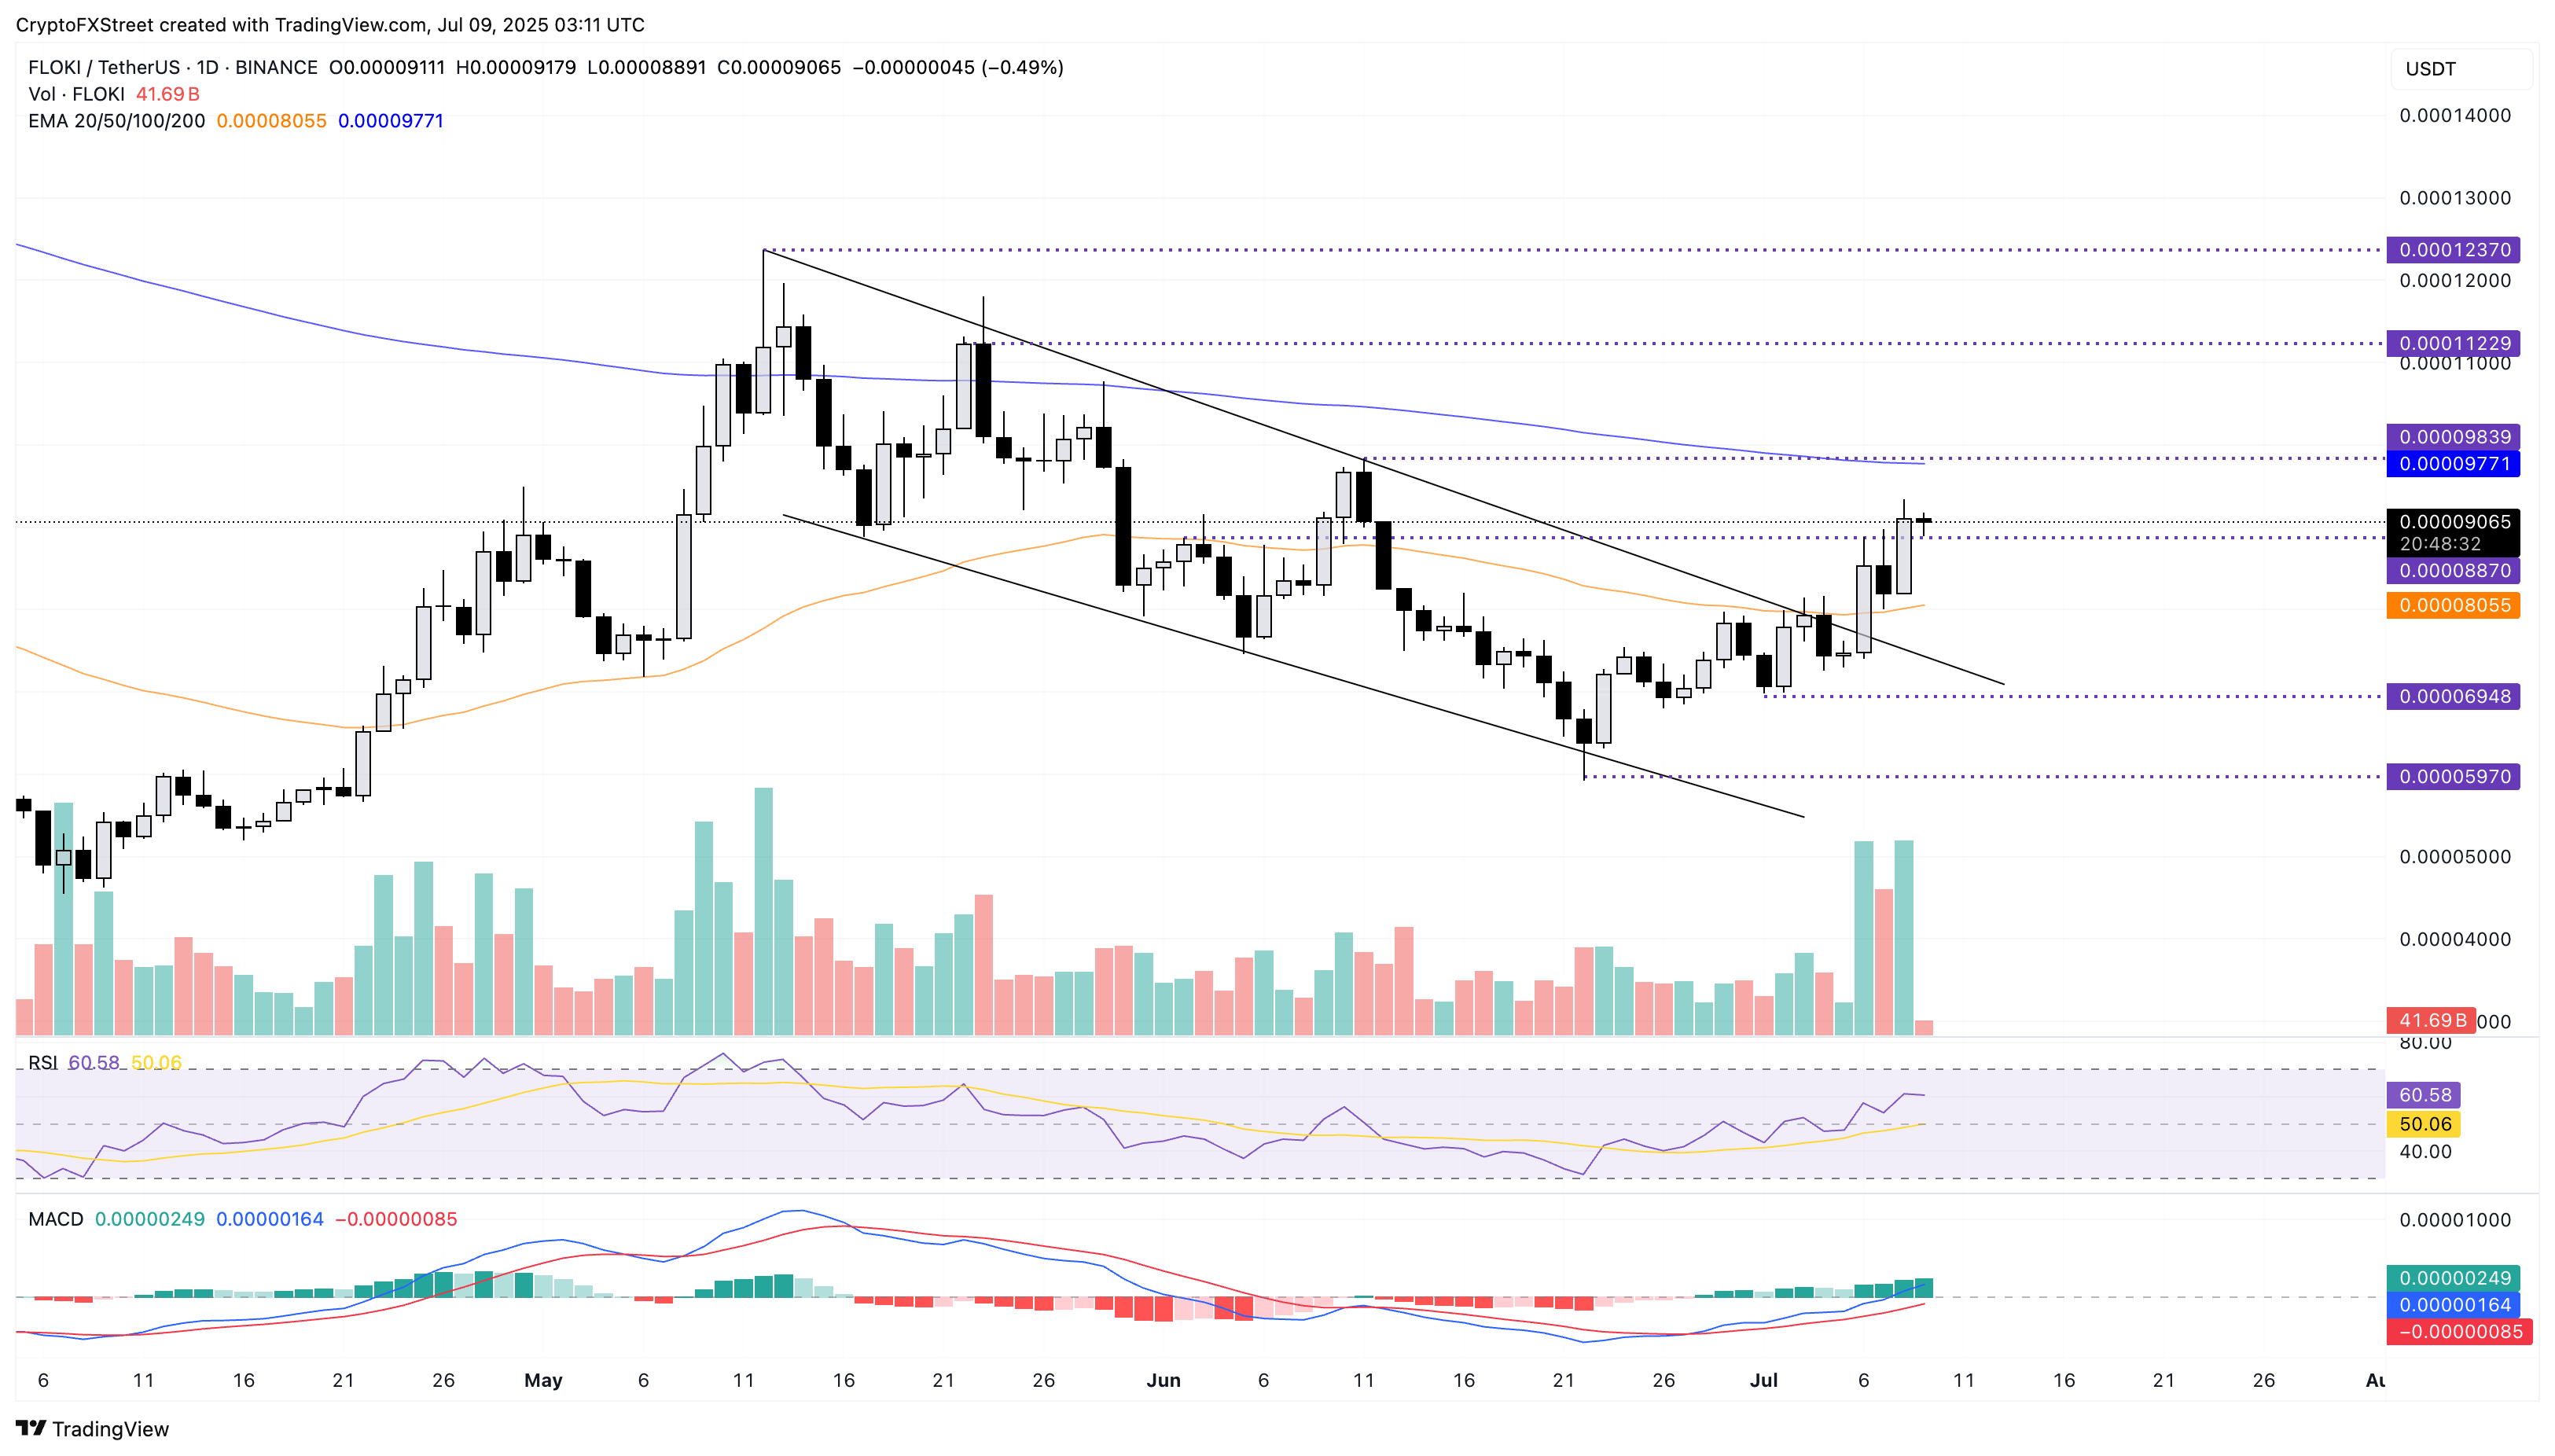
Floki edges lower nearly 0.50% at the time of writing on Wednesday, holding the 11% gains from the previous day. The meme coin has exceeded the $0.000008870 resistance level, extending the falling channel breakout as shown in the chart below.
Floki targets the 200-day EMA at $0.000009771, and a decisive close above this level could target the May 22 close of $0.000011229.
The technical indicators suggest a bullish bias, as the RSI, at 60, floats above its neutral level, and the MACD indicator displays the average lines crossing into positive territory.

FLOKI/USDT daily price chart.
On the downside, if Floki drops below $0.000008870, it could extend the decline to the 50-day EMA at $0.000008054.


