
Top 3 Price Prediction Bitcoin, Ethereum, Ripple: BTC holds ground while ETH and XRP eye further gains
- Bitcoin price holds steady at around $108,000 on Wednesday, maintaining support at a key technical level.
- Ethereum remains bullish, targeting $2,724, with support confirmed at the $2,461 throwback level.
- XRP gains traction after a breakout above its descending trendline, indicating potential for further upward momentum.
Bitcoin (BTC), Ethereum (ETH), and Ripple (XRP) present a mixed but optimistic outlook midweek as BTC holds steady while ETH and XRP show signs of renewed bullish momentum. The largest cryptocurrency by market capitalization is stabilizing at a critical support level as traders await a catalyst; meanwhile, ETH and XRP are eyeing a move toward higher targets.
In the absence of any relevant market-moving news, the market focus will remain centered on the release of Federal Open Market Committee (FOMC) meeting minutes on Wednesday, which will provide more cues about the Federal Reserve’s (Fed) rate-cut path. This, in turn, will drive and provide a fresh directional impetus to these top cryptocurrencies by market capitalization.
BTC holds strong around $108,000 support level
Bitcoin price has been consolidating around the upper boundary of a previously broken consolidation zone at $108,355 since Friday. On Monday, it dipped slightly and retested this support level, recovering slightly the next day. At the time of writing on Wednesday, it trades down at around $108,400.
If the support level at $108,355 continues to hold, BTC could extend the rally toward the May 22 all-time high at $111,980.
The Relative Strength Index (RSI) on the daily chart reads 54, above its neutral level of 50, indicating bullish momentum. The Moving Average Convergence Divergence (MACD) on the daily chart coils against each other, indicating indecisiveness among traders.
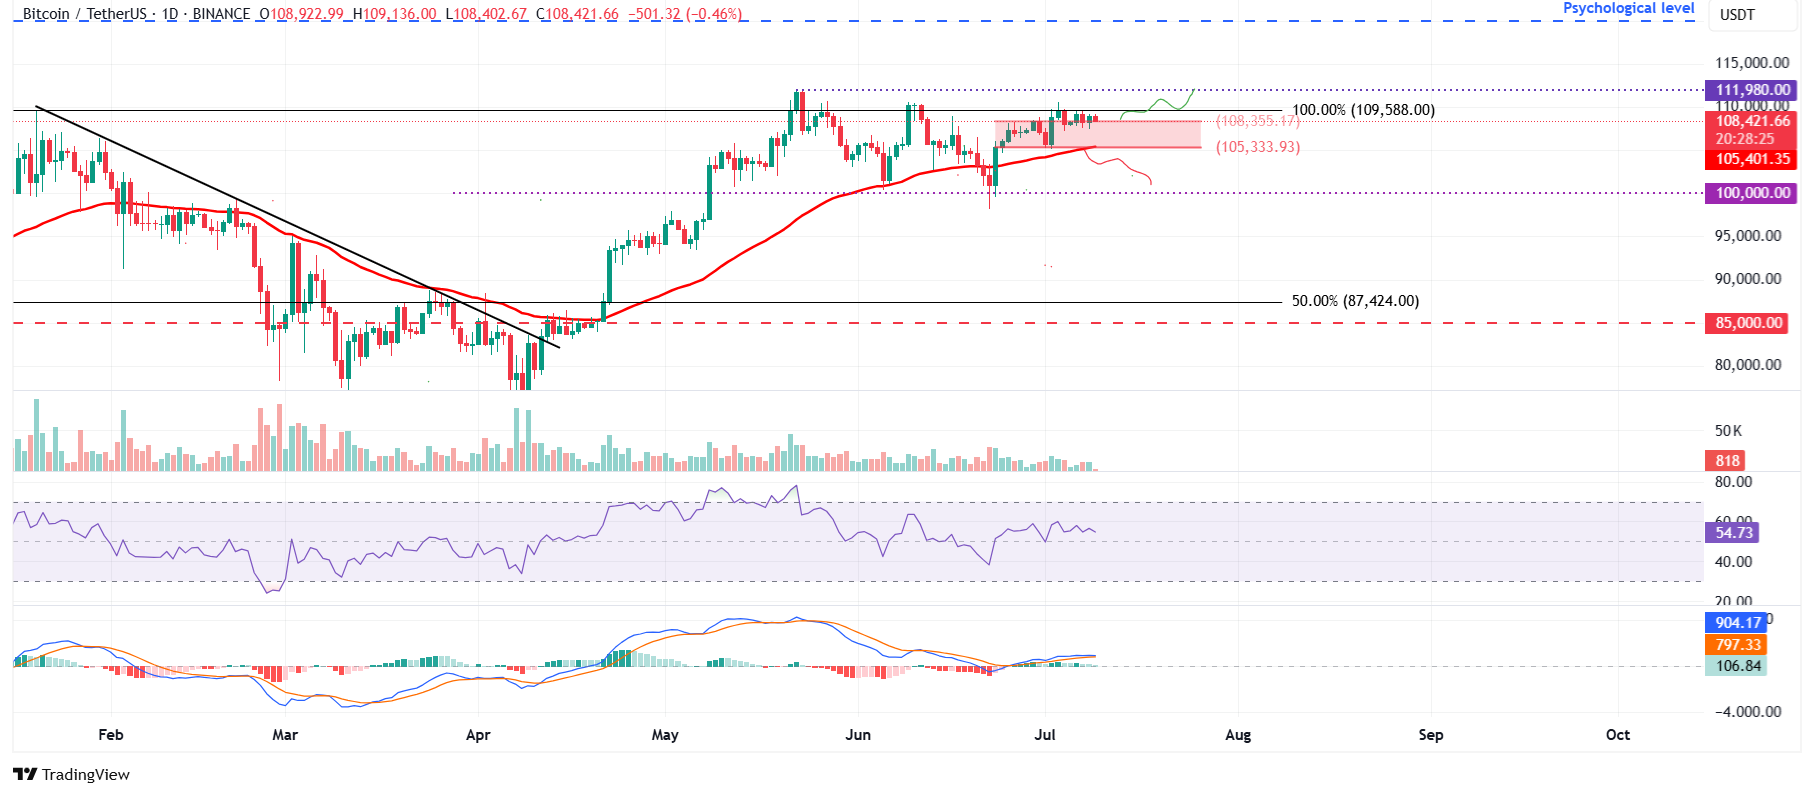
BTC/USDT daily chart
However, if BTC faces a correction and closes below its support at $108,355, it could extend the decline to retest the lower boundary of the consolidation zone at $105,333, which roughly coincides with the 50-day Exponential Moving Average (EMA) at $105,276, making this a key support zone for BTC.
Ethereum bulls are aiming for the $2,724 mark
Ethereum price rebounded after finding support around its daily level of $2,461 on Friday and rose by 4.38% by Tuesday. At the time of writing on Wednesday, it hovers at around $2,595.
If ETH continues its upward trend, it could extend the rally toward its next daily resistance level at $2,724.
The RSI on the daily chart reads 56, above its neutral level of 50, indicating that bullish momentum is gaining traction. The MACD indicator on the daily chart displayed a bullish crossover last week. It also shows rising green histogram bars above its neutral level, suggesting bullish momentum and indicating an upward trend.
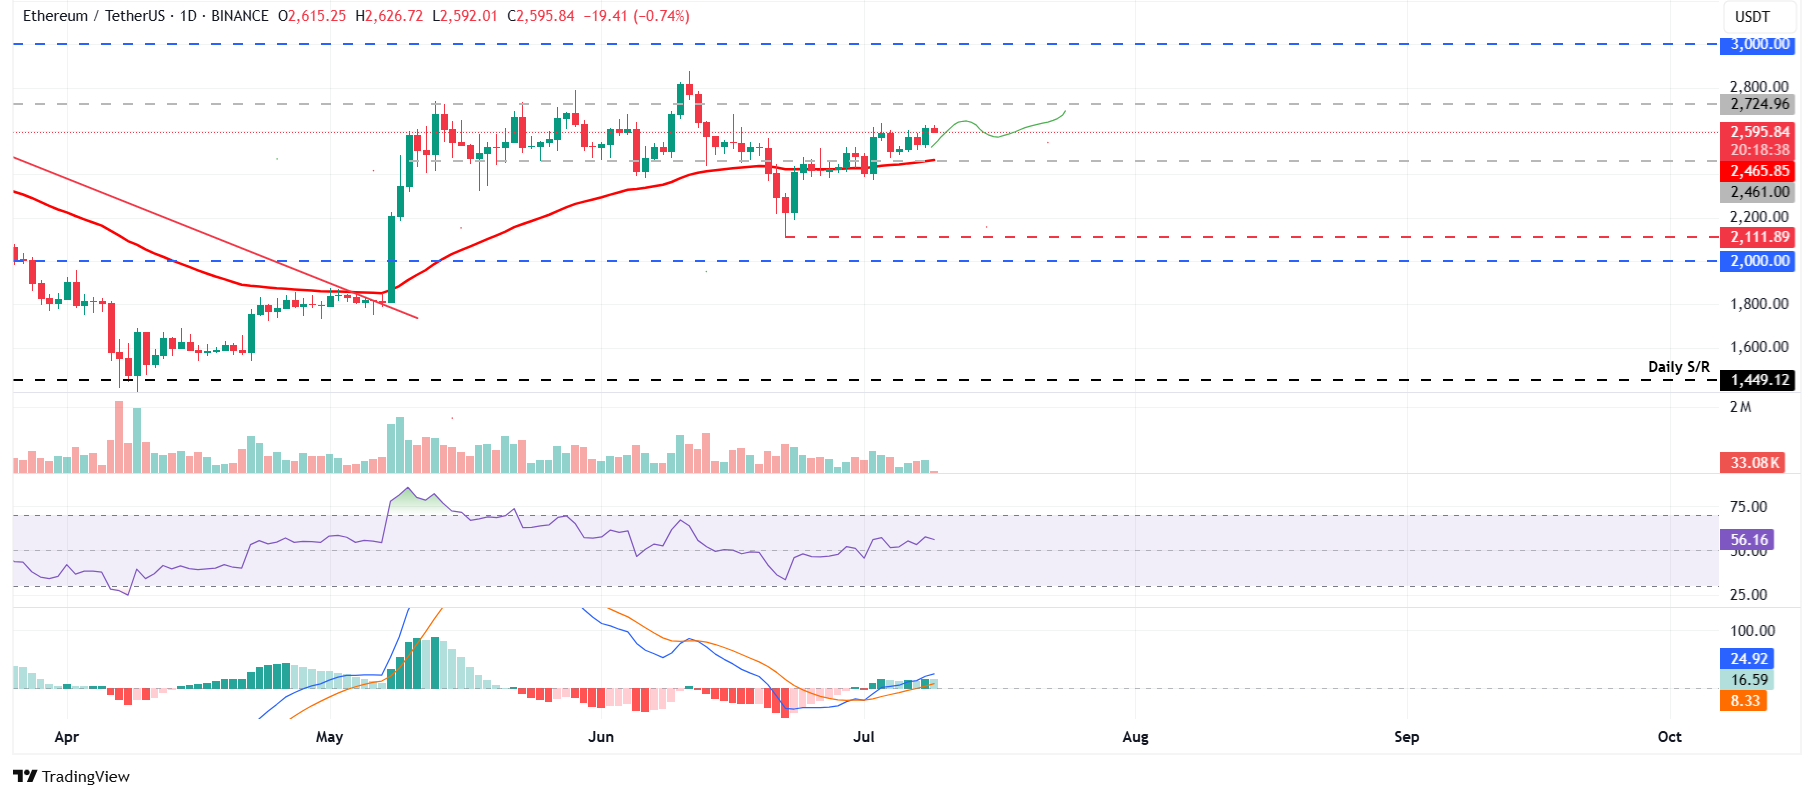
ETH/USDT daily chart
However, if ETH faces a correction, it could extend the decline to retest its daily support at $2,461.
XRP bulls are in control of the momentum
XRP price broke above the descending trendline (drawn by connecting multiple highs since mid-May) on June 30 and found support around its previous level over the next two days, rallying 4.5% until Sunday. XRP continued its upward trend as of Tuesday. At the time of writing on Wednesday, it hovers at around $2.30.
If XRP continues its upward momentum, it could extend the rally toward its May 23 high of $2.47.
The RSI on the daily chart reads 58, above its neutral level of 50, indicating that bullish momentum is gaining traction. The MACD indicator on the daily chart displayed a bullish crossover last week. It also shows rising green histogram bars above its neutral level, suggesting bullish momentum and indicating an upward trend.
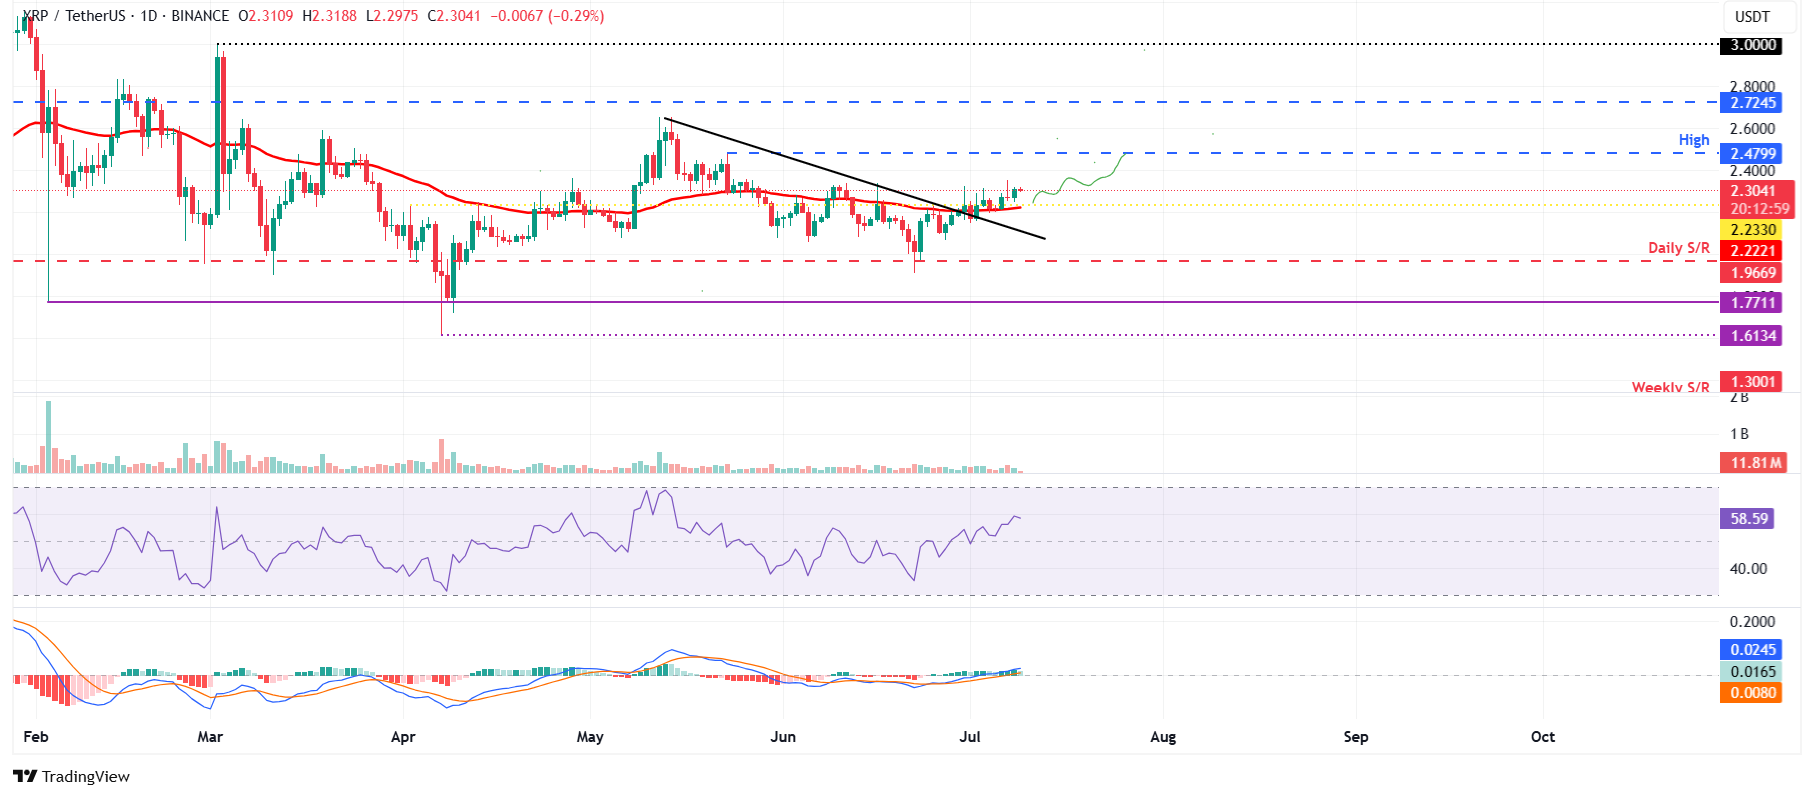
XRP/USDT daily chart
However, if XRP falls and closes below its 50-day EMA at $2.22, it could extend the correction to retest its daily support at $1.96.
Bitcoin, altcoins, stablecoins FAQs
Bitcoin is the largest cryptocurrency by market capitalization, a virtual currency designed to serve as money. This form of payment cannot be controlled by any one person, group, or entity, which eliminates the need for third-party participation during financial transactions.
Altcoins are any cryptocurrency apart from Bitcoin, but some also regard Ethereum as a non-altcoin because it is from these two cryptocurrencies that forking happens. If this is true, then Litecoin is the first altcoin, forked from the Bitcoin protocol and, therefore, an “improved” version of it.
Stablecoins are cryptocurrencies designed to have a stable price, with their value backed by a reserve of the asset it represents. To achieve this, the value of any one stablecoin is pegged to a commodity or financial instrument, such as the US Dollar (USD), with its supply regulated by an algorithm or demand. The main goal of stablecoins is to provide an on/off-ramp for investors willing to trade and invest in cryptocurrencies. Stablecoins also allow investors to store value since cryptocurrencies, in general, are subject to volatility.
Bitcoin dominance is the ratio of Bitcoin's market capitalization to the total market capitalization of all cryptocurrencies combined. It provides a clear picture of Bitcoin’s interest among investors. A high BTC dominance typically happens before and during a bull run, in which investors resort to investing in relatively stable and high market capitalization cryptocurrency like Bitcoin. A drop in BTC dominance usually means that investors are moving their capital and/or profits to altcoins in a quest for higher returns, which usually triggers an explosion of altcoin rallies.
Bài viết đề xuất


