FLOKI Price Prediction: Bulls in control as large wallets accumulate more than 1 billion tokens
- FLOKI price breaks above a falling wedge pattern, suggesting a bullish rally ahead.
- Large wallets have accumulated 1.23 billion FLOKI tokens since Friday.
- FLOKI’s open interest reached nearly $50 million on Monday, the highest level of the year.
FLOKI (FLOKI) price hovers at around $0.0000827 on Tuesday after breaking above a falling wedge pattern, which suggests further upside potential. Adding to this bullish technical outlook, large wallets have accumulated over 1.23 billion FLOKI tokens since Friday, reflecting growing confidence among traders. Additionally, the Open Interest (OI) surged to nearly $50 million, marking its highest level this year, further supporting positive signals for the meme coin.
FLOKI bulls take charge as large wallet accumulation rises and open interest reaches yearly high
Santiment’s Supply Distribution data support the bullish outlook in FLOKI, as the number of large-wallet holders is rising.
The metric indicates that whales holding between 10 million and 100 million FLOKI tokens (blue line) have accumulated 1.23 billion FLOKI tokens from Friday to Tuesday. This rise is an accumulation by major wallets reflecting growing confidence among traders.
 [12-1751965198288.36.06, 08 Jul, 2025] (1).png)
FLOKI Supply distribution chart. Source: Sentiment
CoinGlass’ data shows that the futures’ Open Interest (OI) in FLOKI at exchanges rose from $30.46 million on Sunday to $49.92 million on Monday, the highest level of the year and levels not seen since December 19. An increasing OI represents new or additional money entering the market and new buying, which could fuel the current FLOKI meme coin price rally.

FLOKI open interest chart. Source: Coinglass
FLOKI Price Prediction: Breaks above a falling wedge pattern
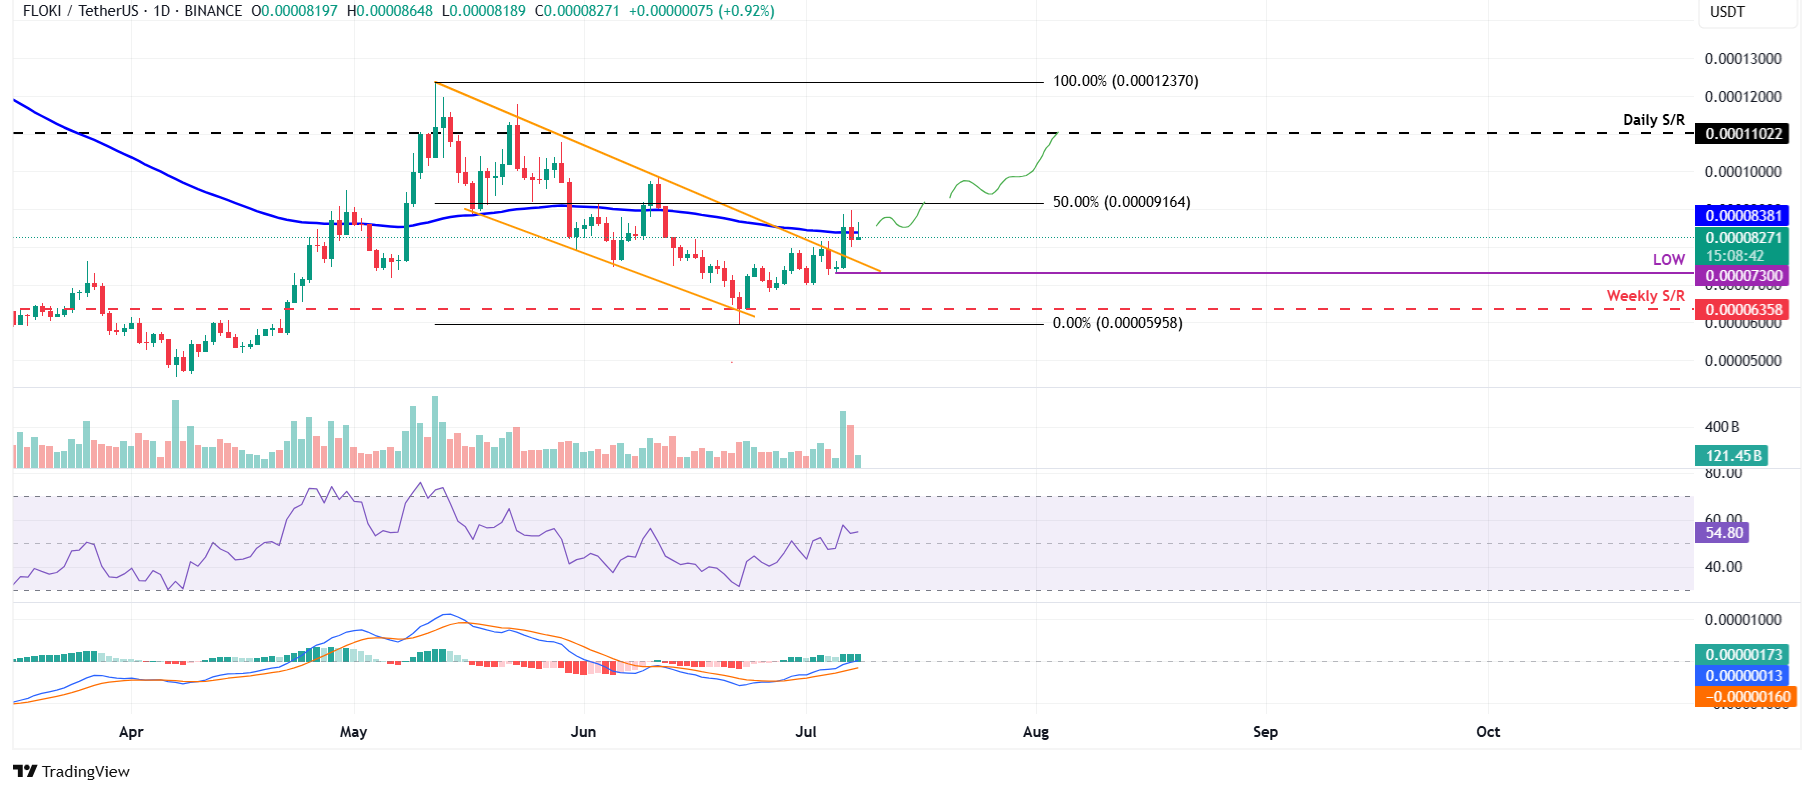
FLOKI price broke above the upper resistance trendline of a falling wedge pattern on Sunday. This pattern is formed by connecting multiple highs and lows with a trendline from mid-May. At the time of writing on Tuesday, FLOKI hovers around $0.0000827.
If FLOKI continues its upward momentum and closes above the 100-day Exponential Moving Average (EMA) at $0.0000838 on a daily basis, it could extend the rally to retest its daily resistance at $0.0001102, with interim resistance at the 50% Fibonacci retracement, drawn from the May 12 high of $0.0001237 to the June 22 low of $0.0000595, at $0.0000916.
The Relative Strength Index (RSI) on the daily chart reads 54 and points upwards, indicating that bullish momentum is gaining traction. Additionally, the Moving Average Convergence Divergence (MACD) indicator showed a bullish crossover on June 28. It also shows rising green histogram bars above its neutral zero line, suggesting bullish momentum is gaining traction and continuing an upward trend.

FLOKI/USDT daily chart
However, if FLOKI faces a correction, it could extend the decline to retest its Saturday low of $0.0000730, which roughly coincides with the upper trendline boundary of the falling wedge pattern.


