Solana Price Forecast: SOL eyes breakout as network activity hits record high, ETF chances improve
- Solana holds steady following the near 2% drop on Monday, unaffected by the increasing number of positive catalysts.
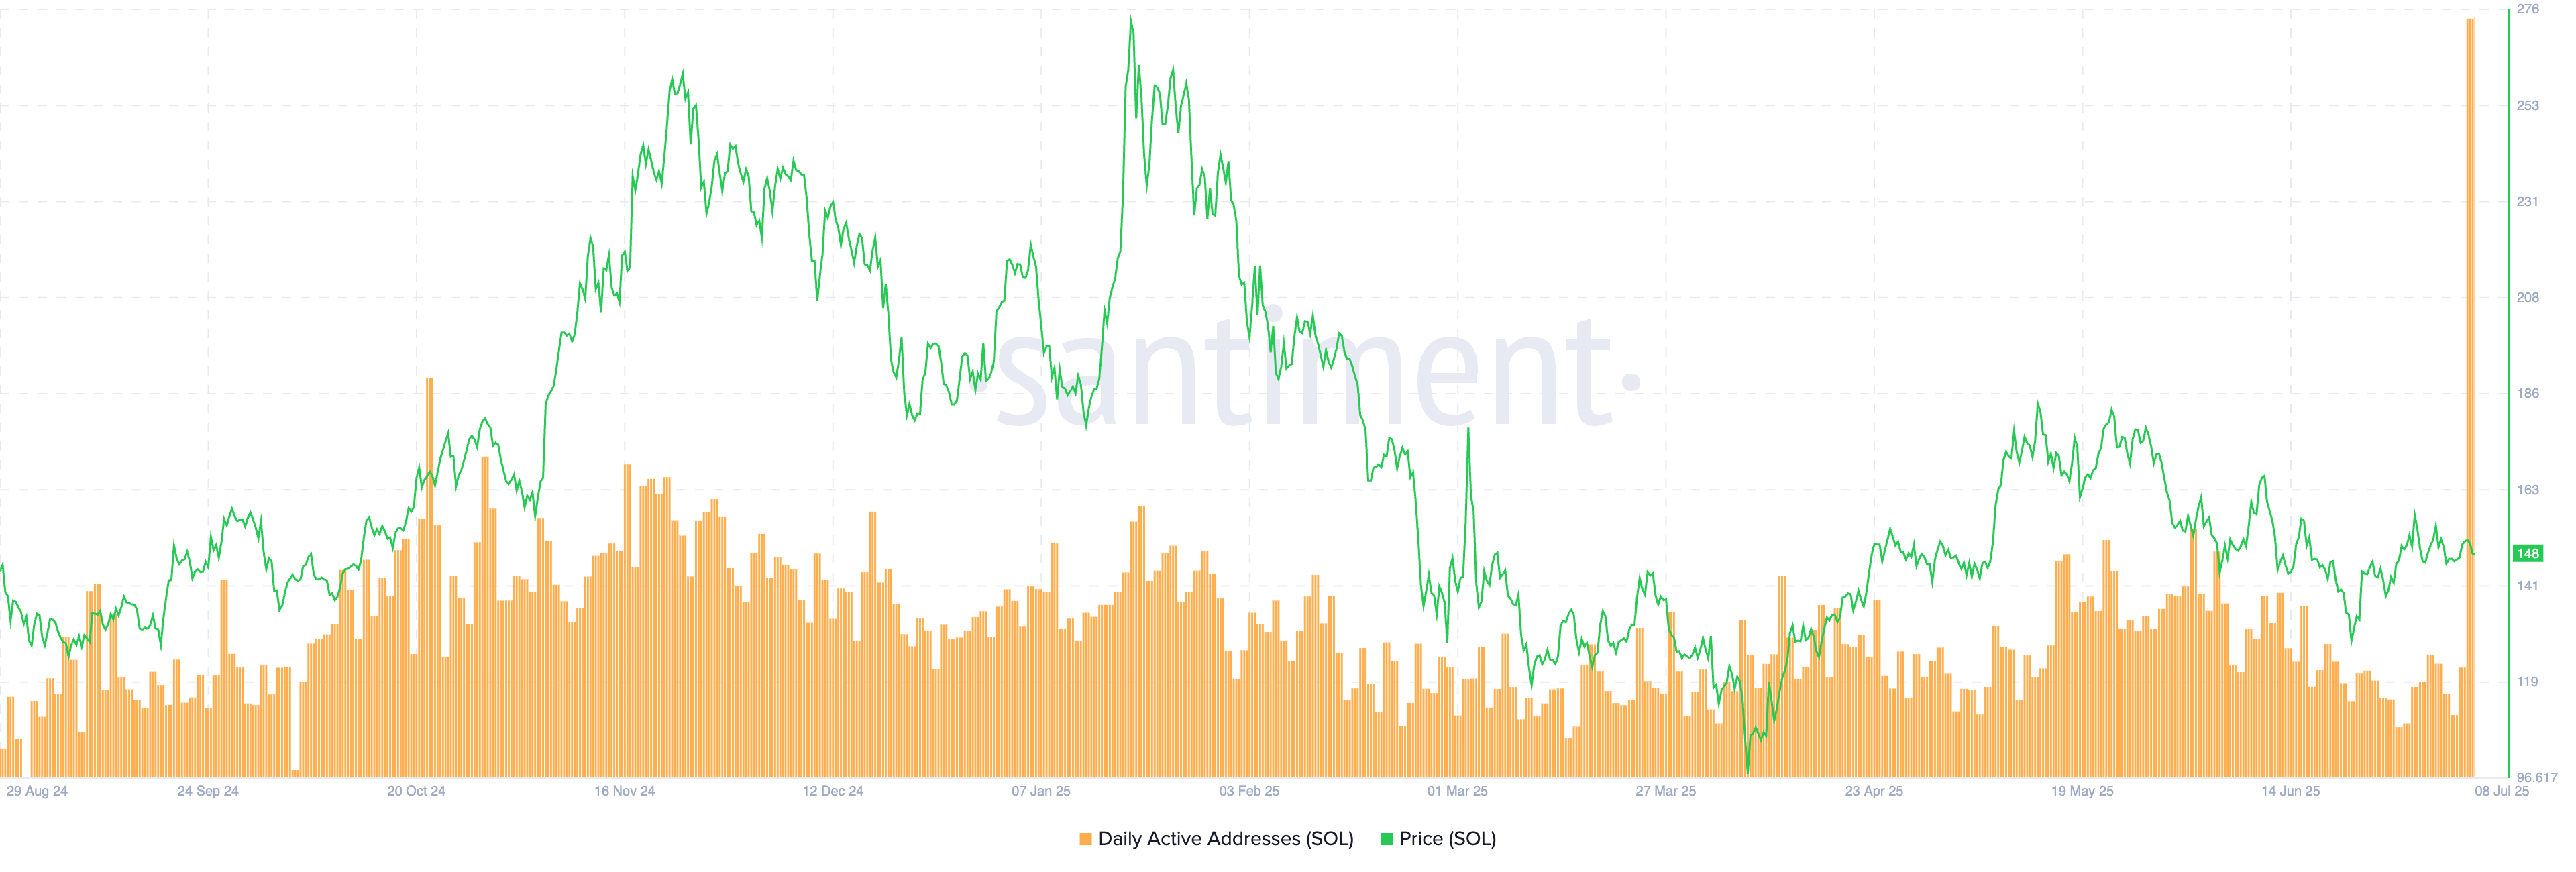
- The daily active addresses on Solana hit a record high of 15.39 million, suggesting increased network activity.
- The US SEC requests amendments from potential issuers before the end of July, sparking interest in the Solana ETF approval.
Solana (SOL) ticks marginally higher on Tuesday as the selling pressure persists following the near 2% drop on Monday. The technical outlook indicates mixed signals as the trend momentum subsides while SOL stands at a crucial crossroads.
The US Securities and Exchange Commission (SEC) has asked potential Solana Exchange-Traded Fund (ETF) issuers to amend or refile applications by the end of July, boosting approval anticipation among investors. Concurrent with the heightened optimism, the daily active addresses on the Solana network reached a record high, which could catalyze a breakout rally.
US SEC requests Solana ETF issuers for amendments
The US SEC plans to create a framework to streamline the approval process of crypto-focused ETFs. Amid the growing buzz about an upcoming framework, the SEC has ordered SOL ETF issuers to amend and refile their submissions by the end of July. This move fuels speculation about a potential SOL ETF approval from the SEC before the final deadline of October 10.
James Seyffart, Bloomberg’s ETF analyst, views the request as a positive sign from the regulators while anticipating further back-and-forth on amendments rather than a direct approval.
Solana network activity sparks overnight
The Daily Active Addresses (DAA) indicator refers to the unique addresses that are active on a network in a day. A surge in DAA translates to increased users, which boosts network activity and could lead to higher demand for its native token, required for transaction fees, Decentralized Finance (DeFi) services, and other applications.
Santiment’s data shows Solana’s DAA reaching a record high of 15.39 million addresses on Monday. The DAA surge reflects increased user activity on the network, which comes on the back of increased ETF approval chances and could translate to increased spot demand for SOL.

Solana's daily active addresses. Source: Santiment
Lack of momentum in Solana delays trendline breakout
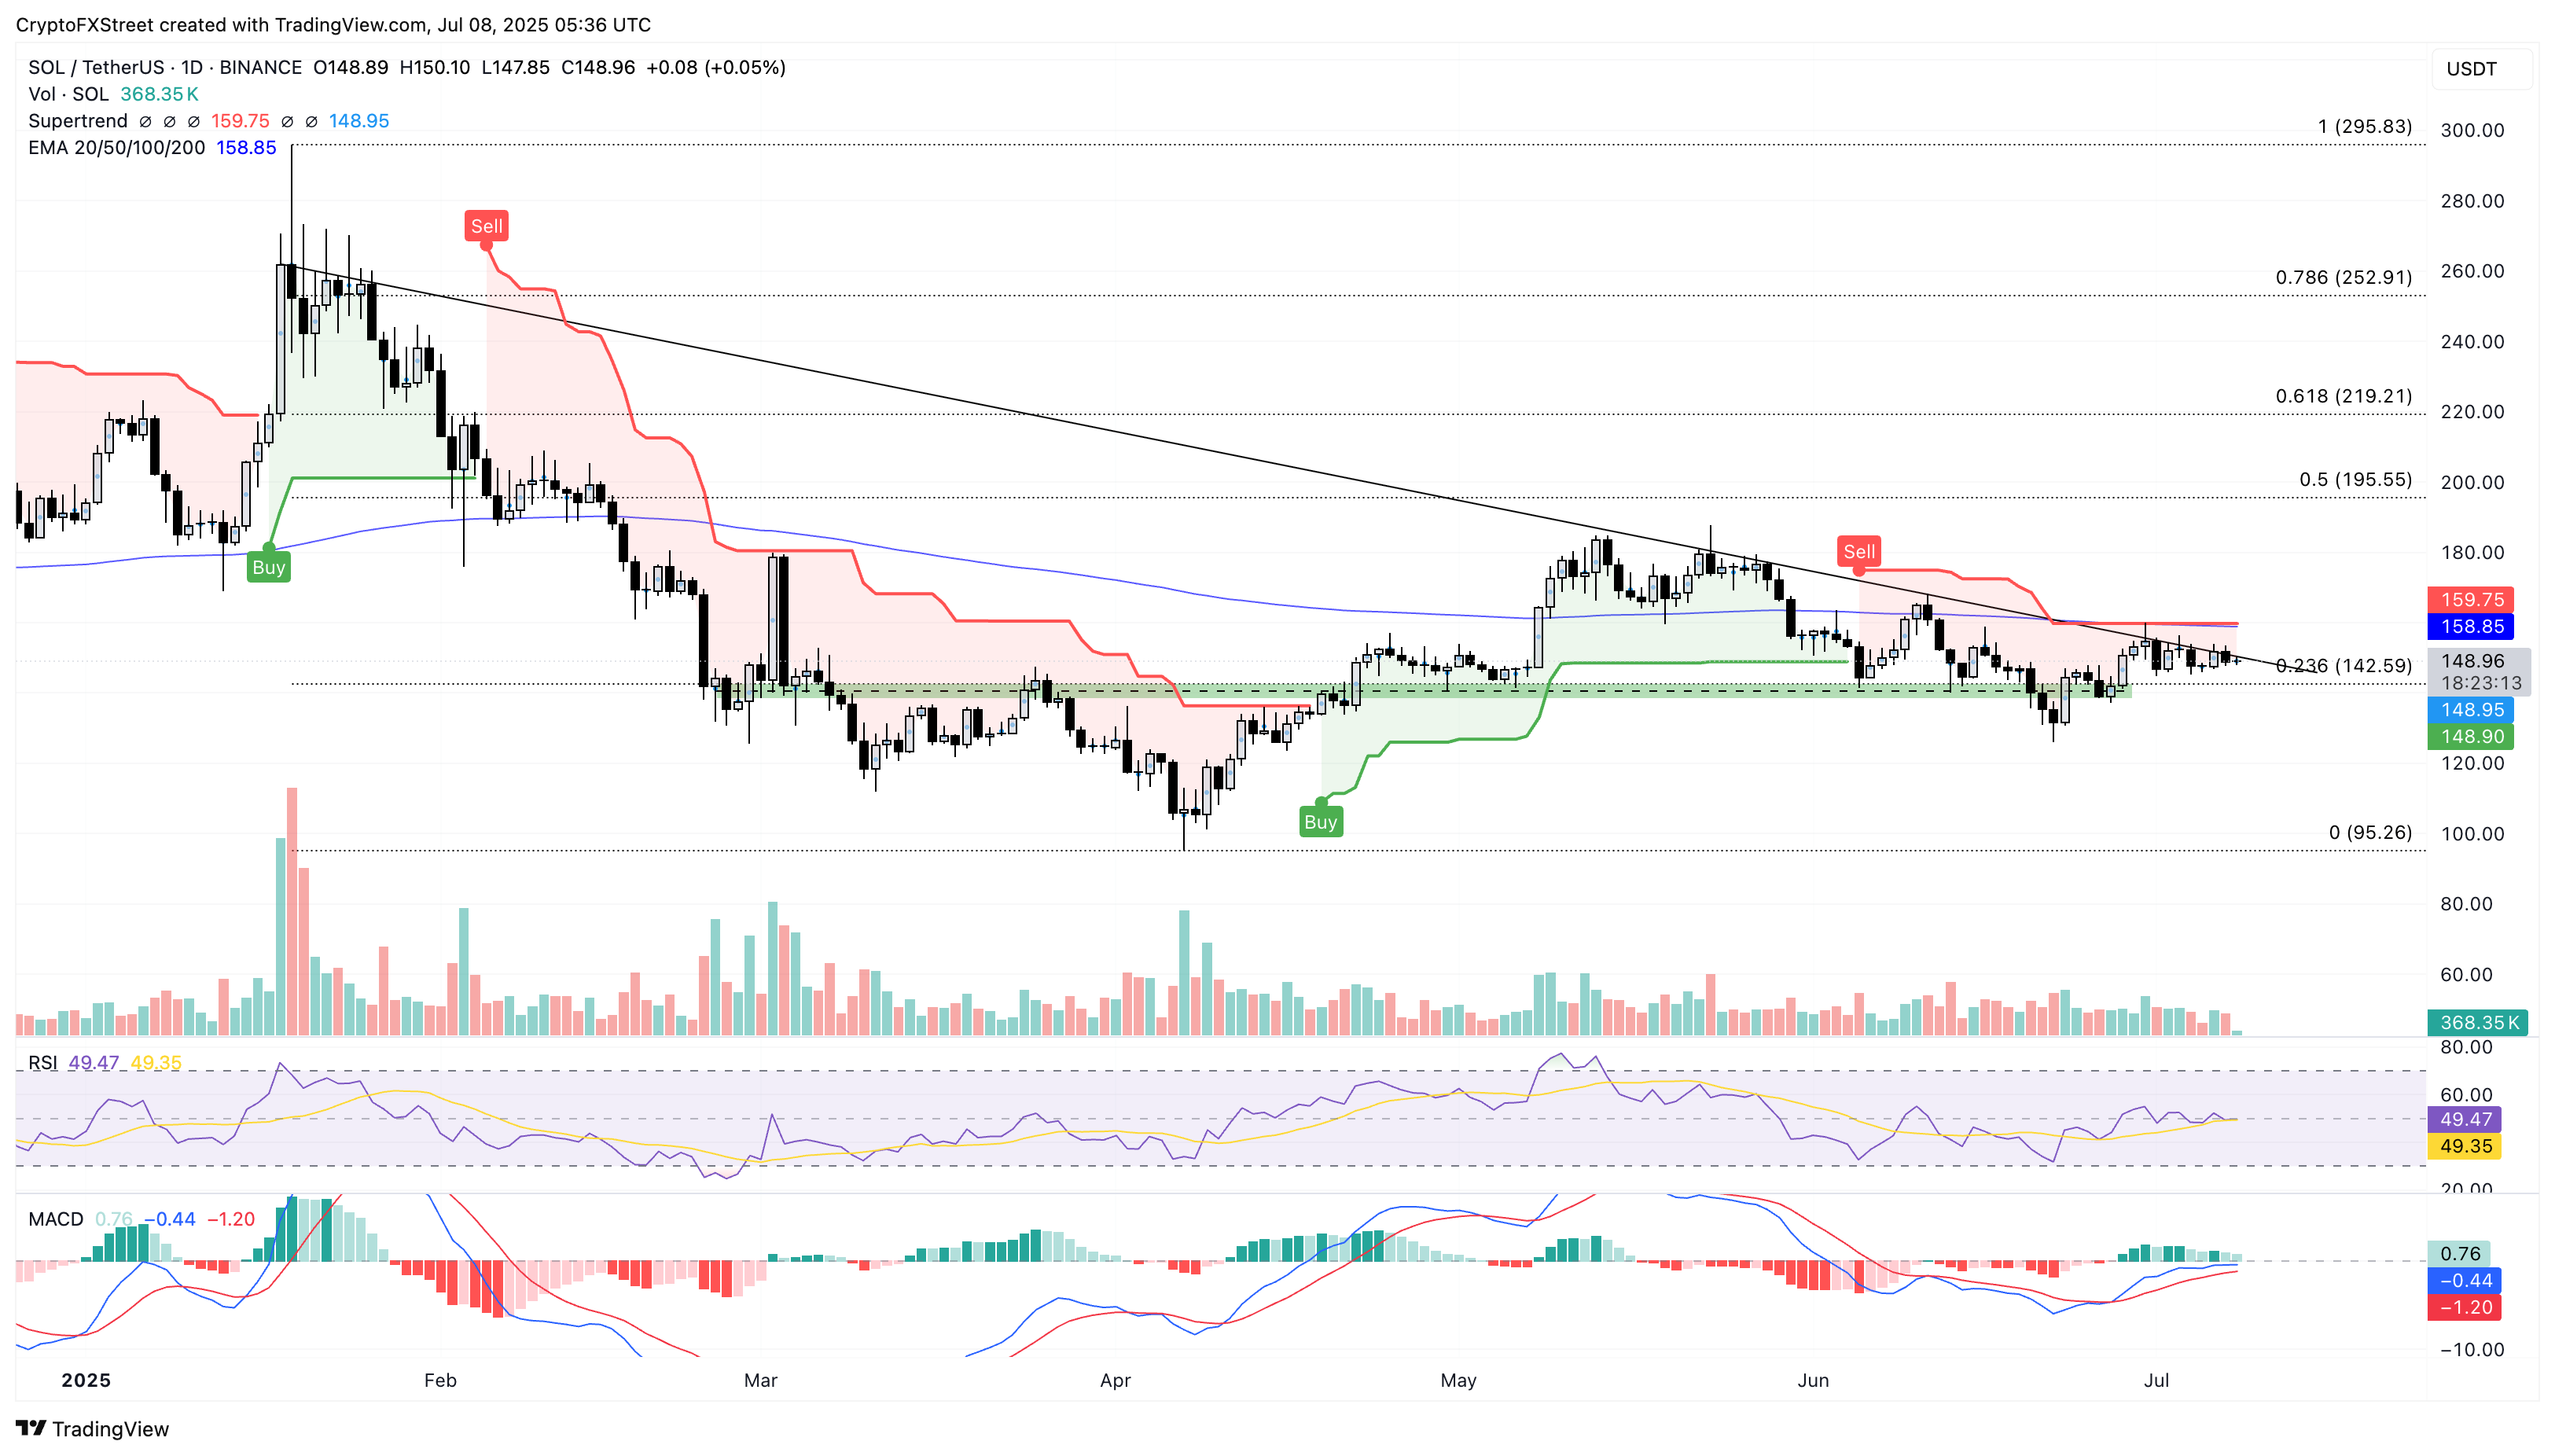
Solana hovers below a six-month resistance trendline retraced from the close of January 18 and the highs of May 22 and June 11. At the time of writing, SOL edges higher by nearly 0.50% following the 1.96% pullback on Monday.
As Solana hovers close to the overhead trendline, it floats above the 23.6% Fibonacci retracement level at $142, drawn from the $295 all-time high on January 19 to the $95 low on April 7. A potential daily close above the trendline at $151 could ignite a trend reversal in Solana.
Still, a decisive push above the Supertrend indicator line and the 200-day Exponential Moving Average, which are near $159, could provide a stronger trend reversal sign. In such a case, the 50% Fibonacci level at $195 could be the immediate price target.
The Moving Average Convergence/Divergence (MACD) indicator shows the MACD and signal line close to crossing above the zero line. However, the declining histogram bars suggest a crossover risk, a sell signal.
The Relative Strength Index (RSI) is hovering near the midpoint of 50, indicating indecision among investors.

SOL/USDT daily price chart.
If Solana closes below the 23.6% Fibonacci level at $142, it could decline closer to the $100 psychological support level.

