Top Meme Coins Price Prediction: Dogecoin, Shiba Inu, Pepe set to extend losses
- Dogecoin extends losses for the eighth consecutive day on Wednesday, indicating a surge in bearish momentum.
- Shiba Inu experienced an intense pullback on Tuesday, recording a two-month low, which increases downside risk.
- Pepe clings to a crucial psychological support level while rising selling pressure could catalyze the next fall.
Top meme coins extend recent losses on Wednesday, with the segment’s market capitalization standing at $54.41 billion, a decline of over 20% in the past month. Dogecoin (DOGE) and Shiba Inu (SHIB) are down 3% so far this week, while Pepe (PEPE) is down over 8% as market-wide selling pressure increases due to rising geopolitical tensions in the Middle East.
Dogecoin risks a drop below $0.15
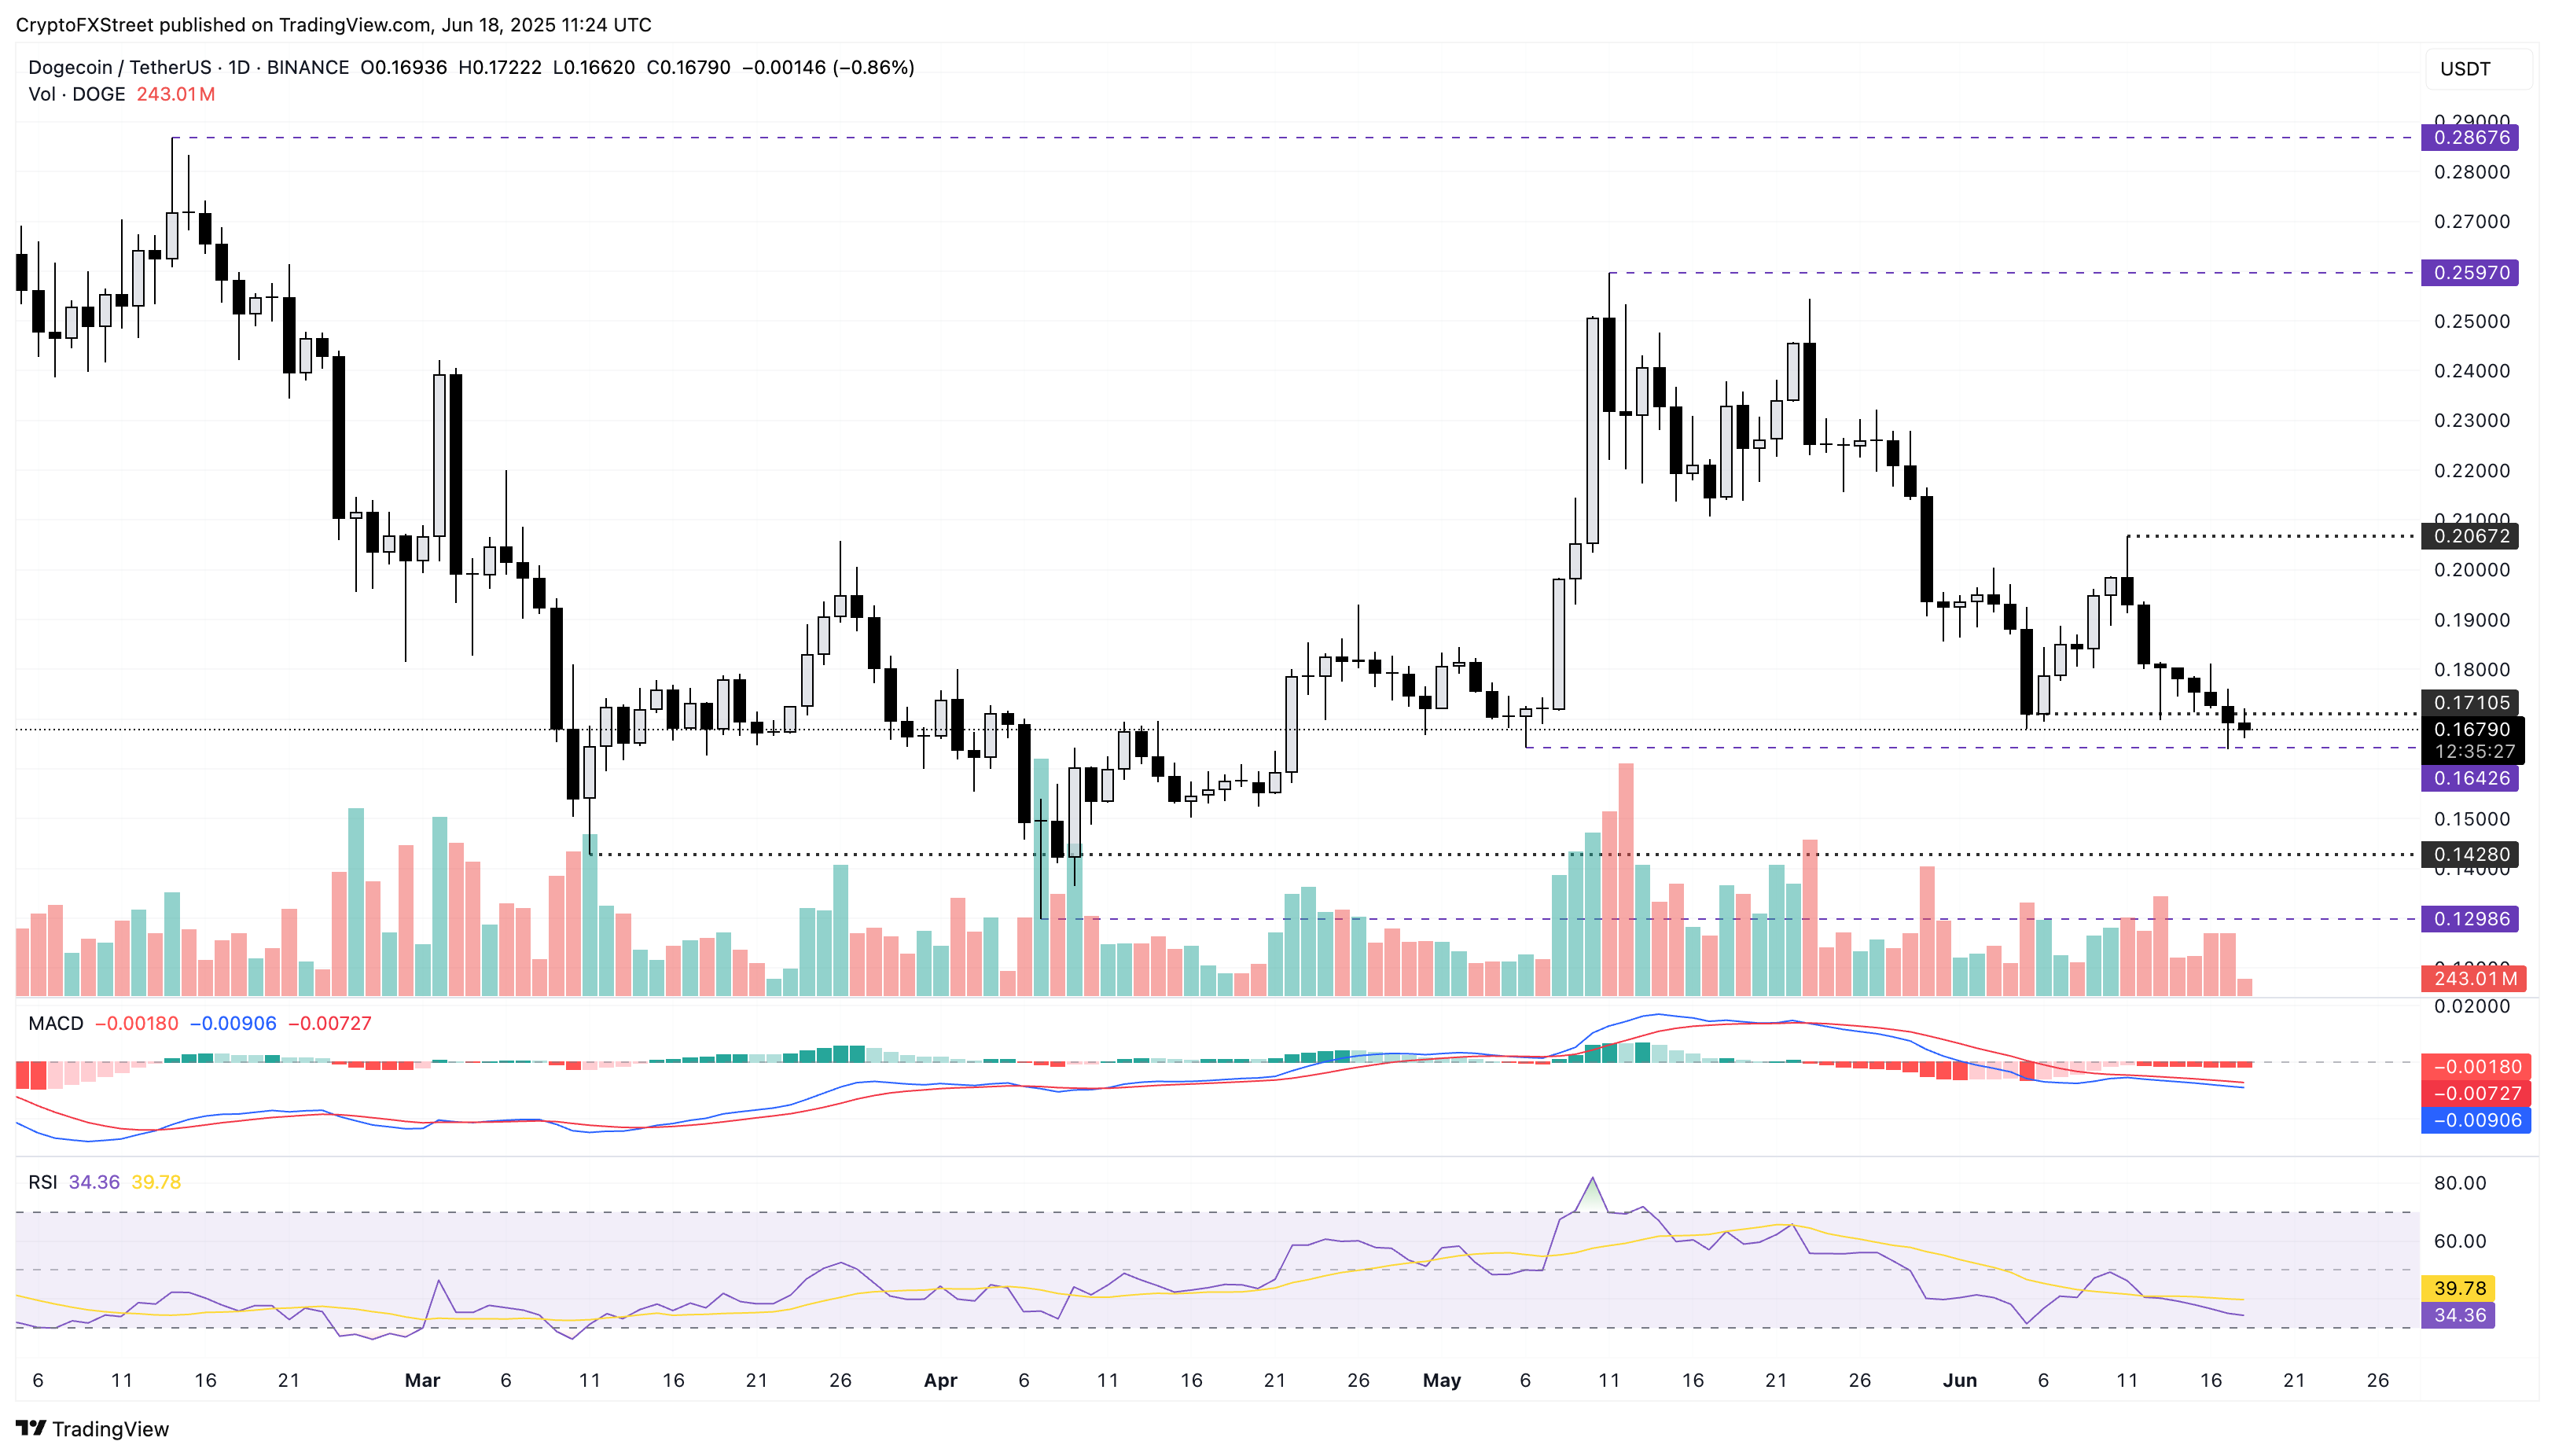
Dogecoin edges lower by over 1% on Wednesday, extending losses for the eighth consecutive day, accounting for nearly 15%. With a plunge of approximately 2% on Tuesday, the meme coin recorded a low of $0.1639, the lowest price in six weeks.
The path of least resistance cautions a steeper price action, risking the $0.1642 support level, marked by the May 6 low. If the Dogecoin bulls fail to hold a daily closing above $0.1642, DOGE’s decline could extend towards the $0.1428 level, last tested on April 8.
The momentum indicators flash a sell signal as bearish dominance grows over the daily chart. The Moving Average Convergence/Divergence (MACD) indicator displays a declining trend that crosses deeply into negative territory, with its signal line mirroring the drop, indicating a growing selling pressure.
The Relative Strength Index (RSI) at 35 slips towards the oversold region, signaling a gradual increase in bearish momentum.

DOGE/USDT daily price chart.
If Dogecoin holds above $0.1642, a reversal could rise toward the monthly high of $0.2067.
Shiba Inu set to extend its bearish trend
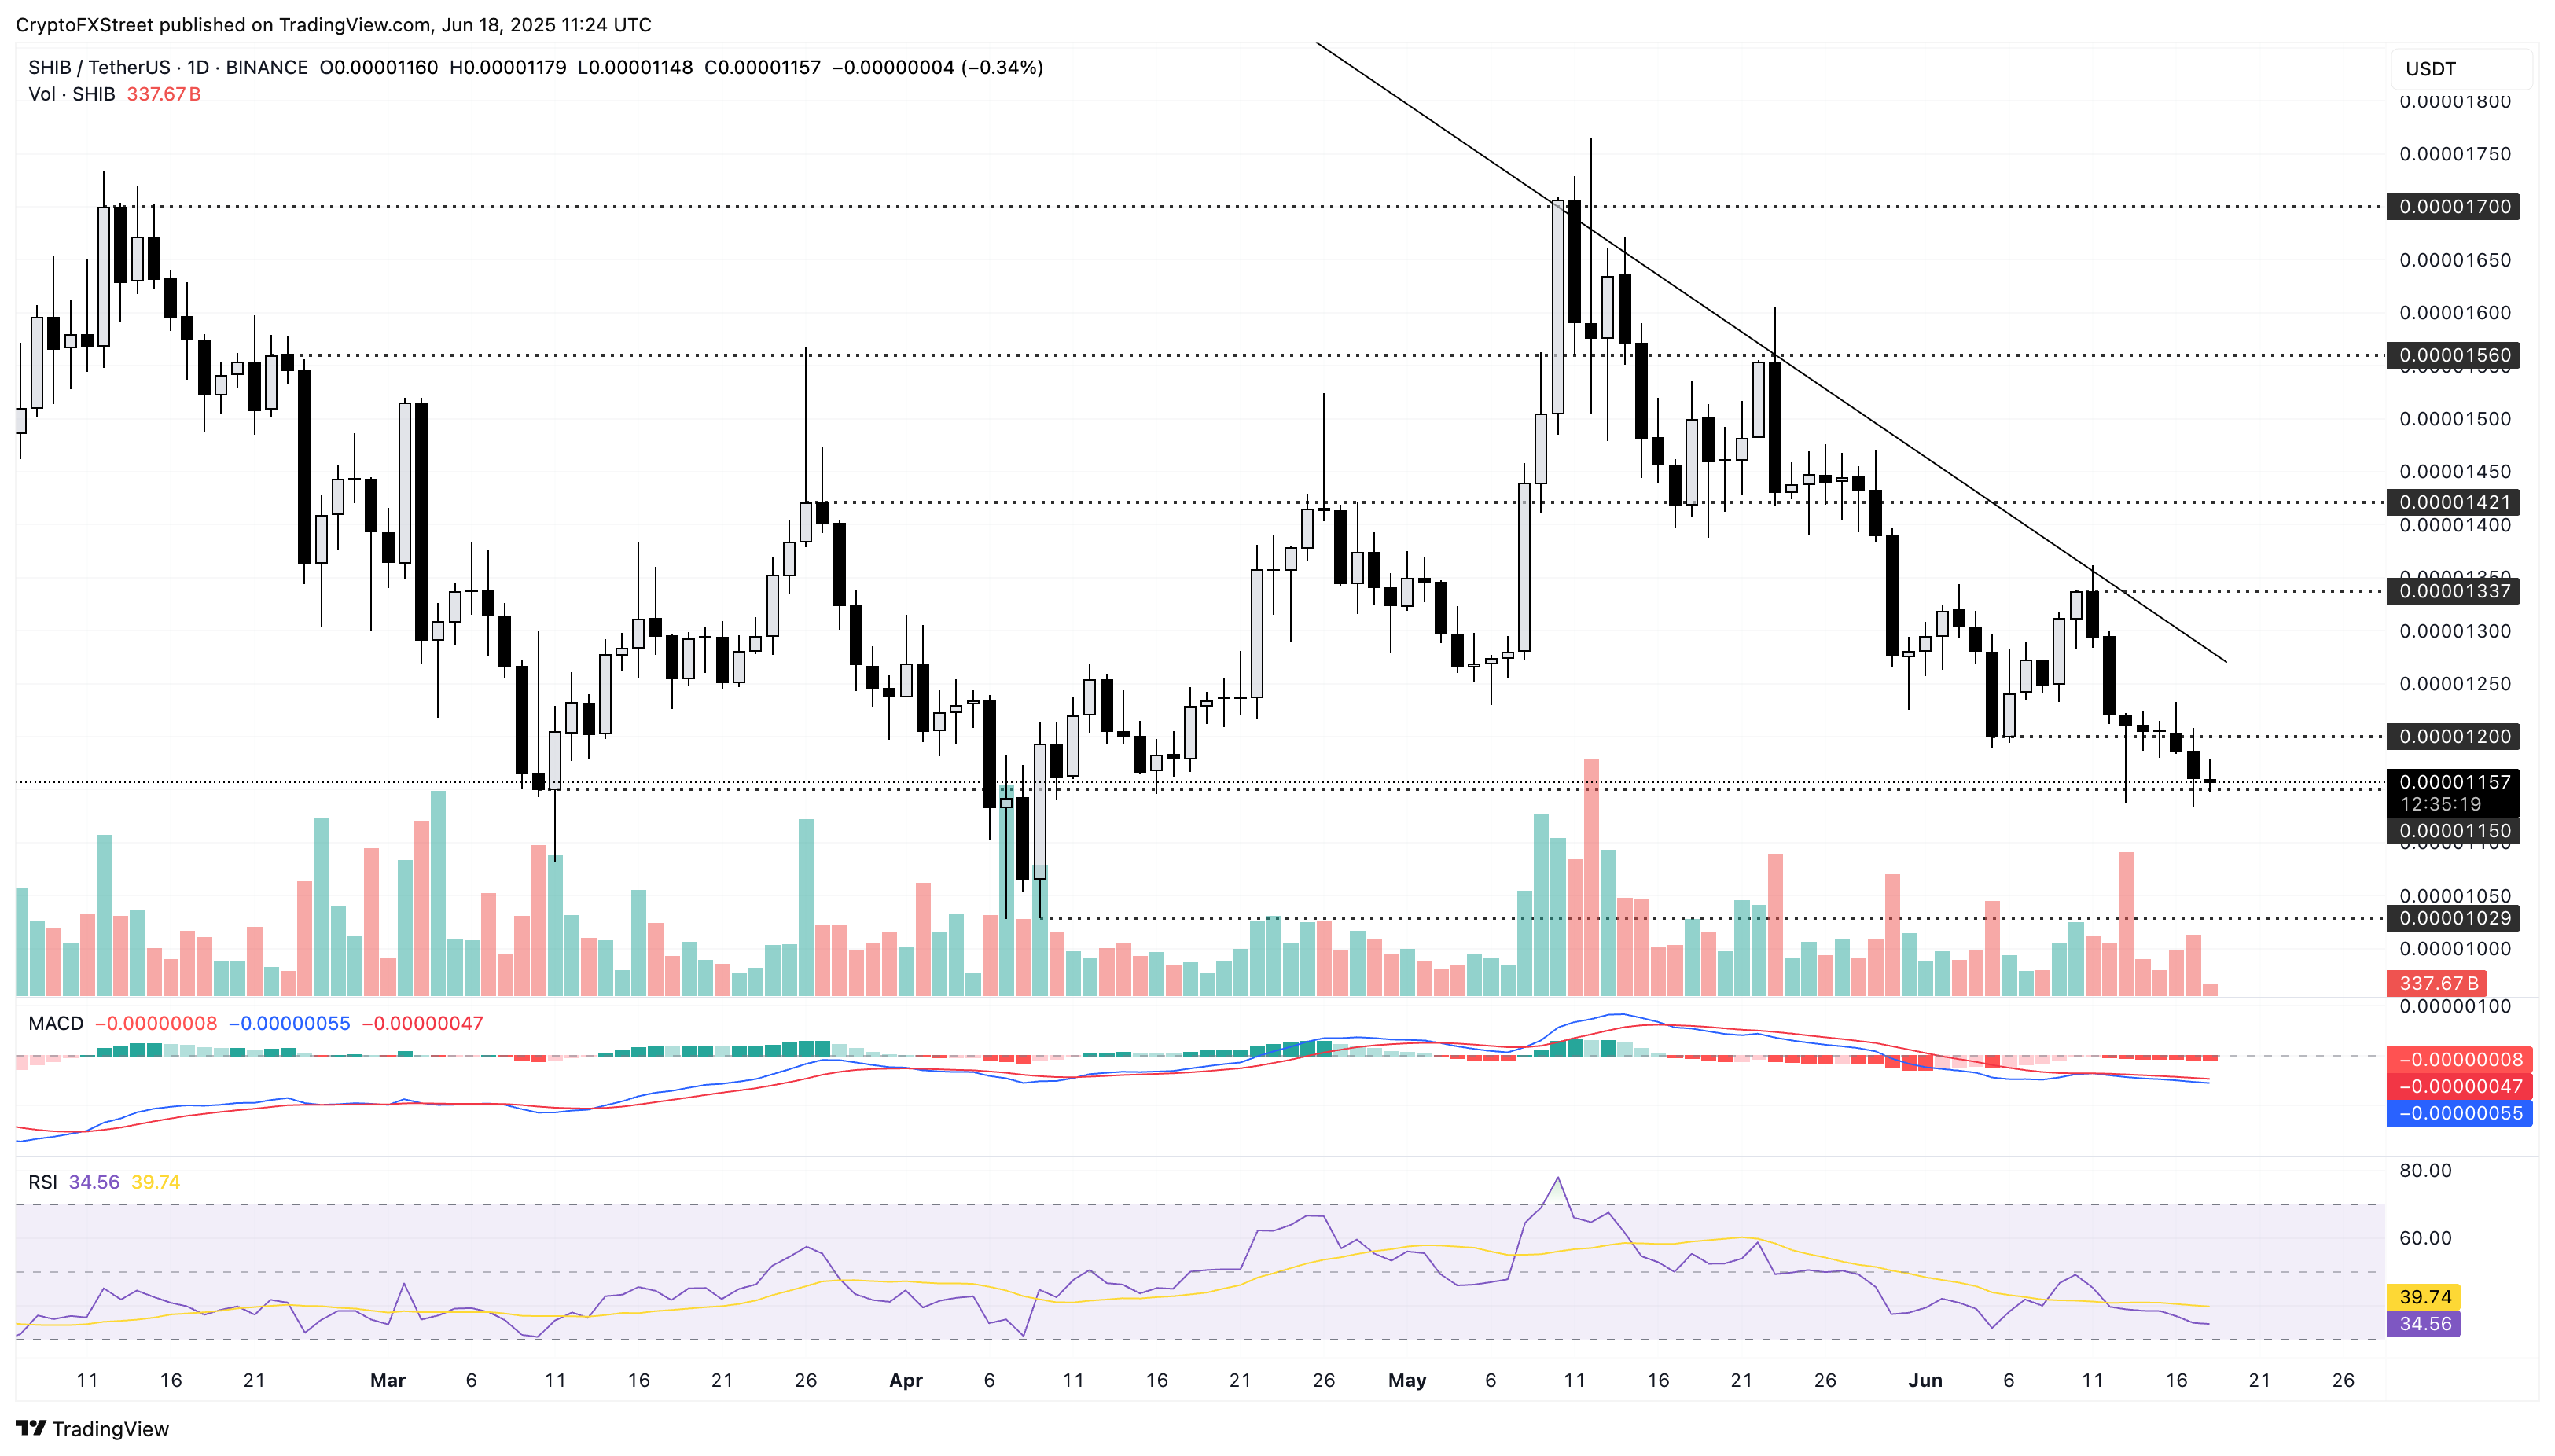
Shiba Inu strikingly mimics Dogecoin, marking the eighth consecutive bearish candle as it holds above the $0.000010 support, the lowest closing in March. The underperforming meme coin hit a two-month low of $0.00001134 on Tuesday.
Despite avoiding a daily candle close below the $0.00001150 support, Shiba Inu’s chances of reversal are getting slimmer. A closing under this level could prolong SHIB’s downfall towards $0.00001029, the year-to-date low.
The momentum indicators are bearish on Shiba Inu as the daily RSI is at 36, inching closer to the oversold zone. The falling MACD indicator, now in negative territory with its signal line, mirrors the bearish trigger seen in Dogecoin.

SHIB/USDT daily price chart.
On the contrary, a potential bounceback in Shiba Inu could test the $0.00001200 level marked by the June 5 closing.
PEPE risks losing its psychological support
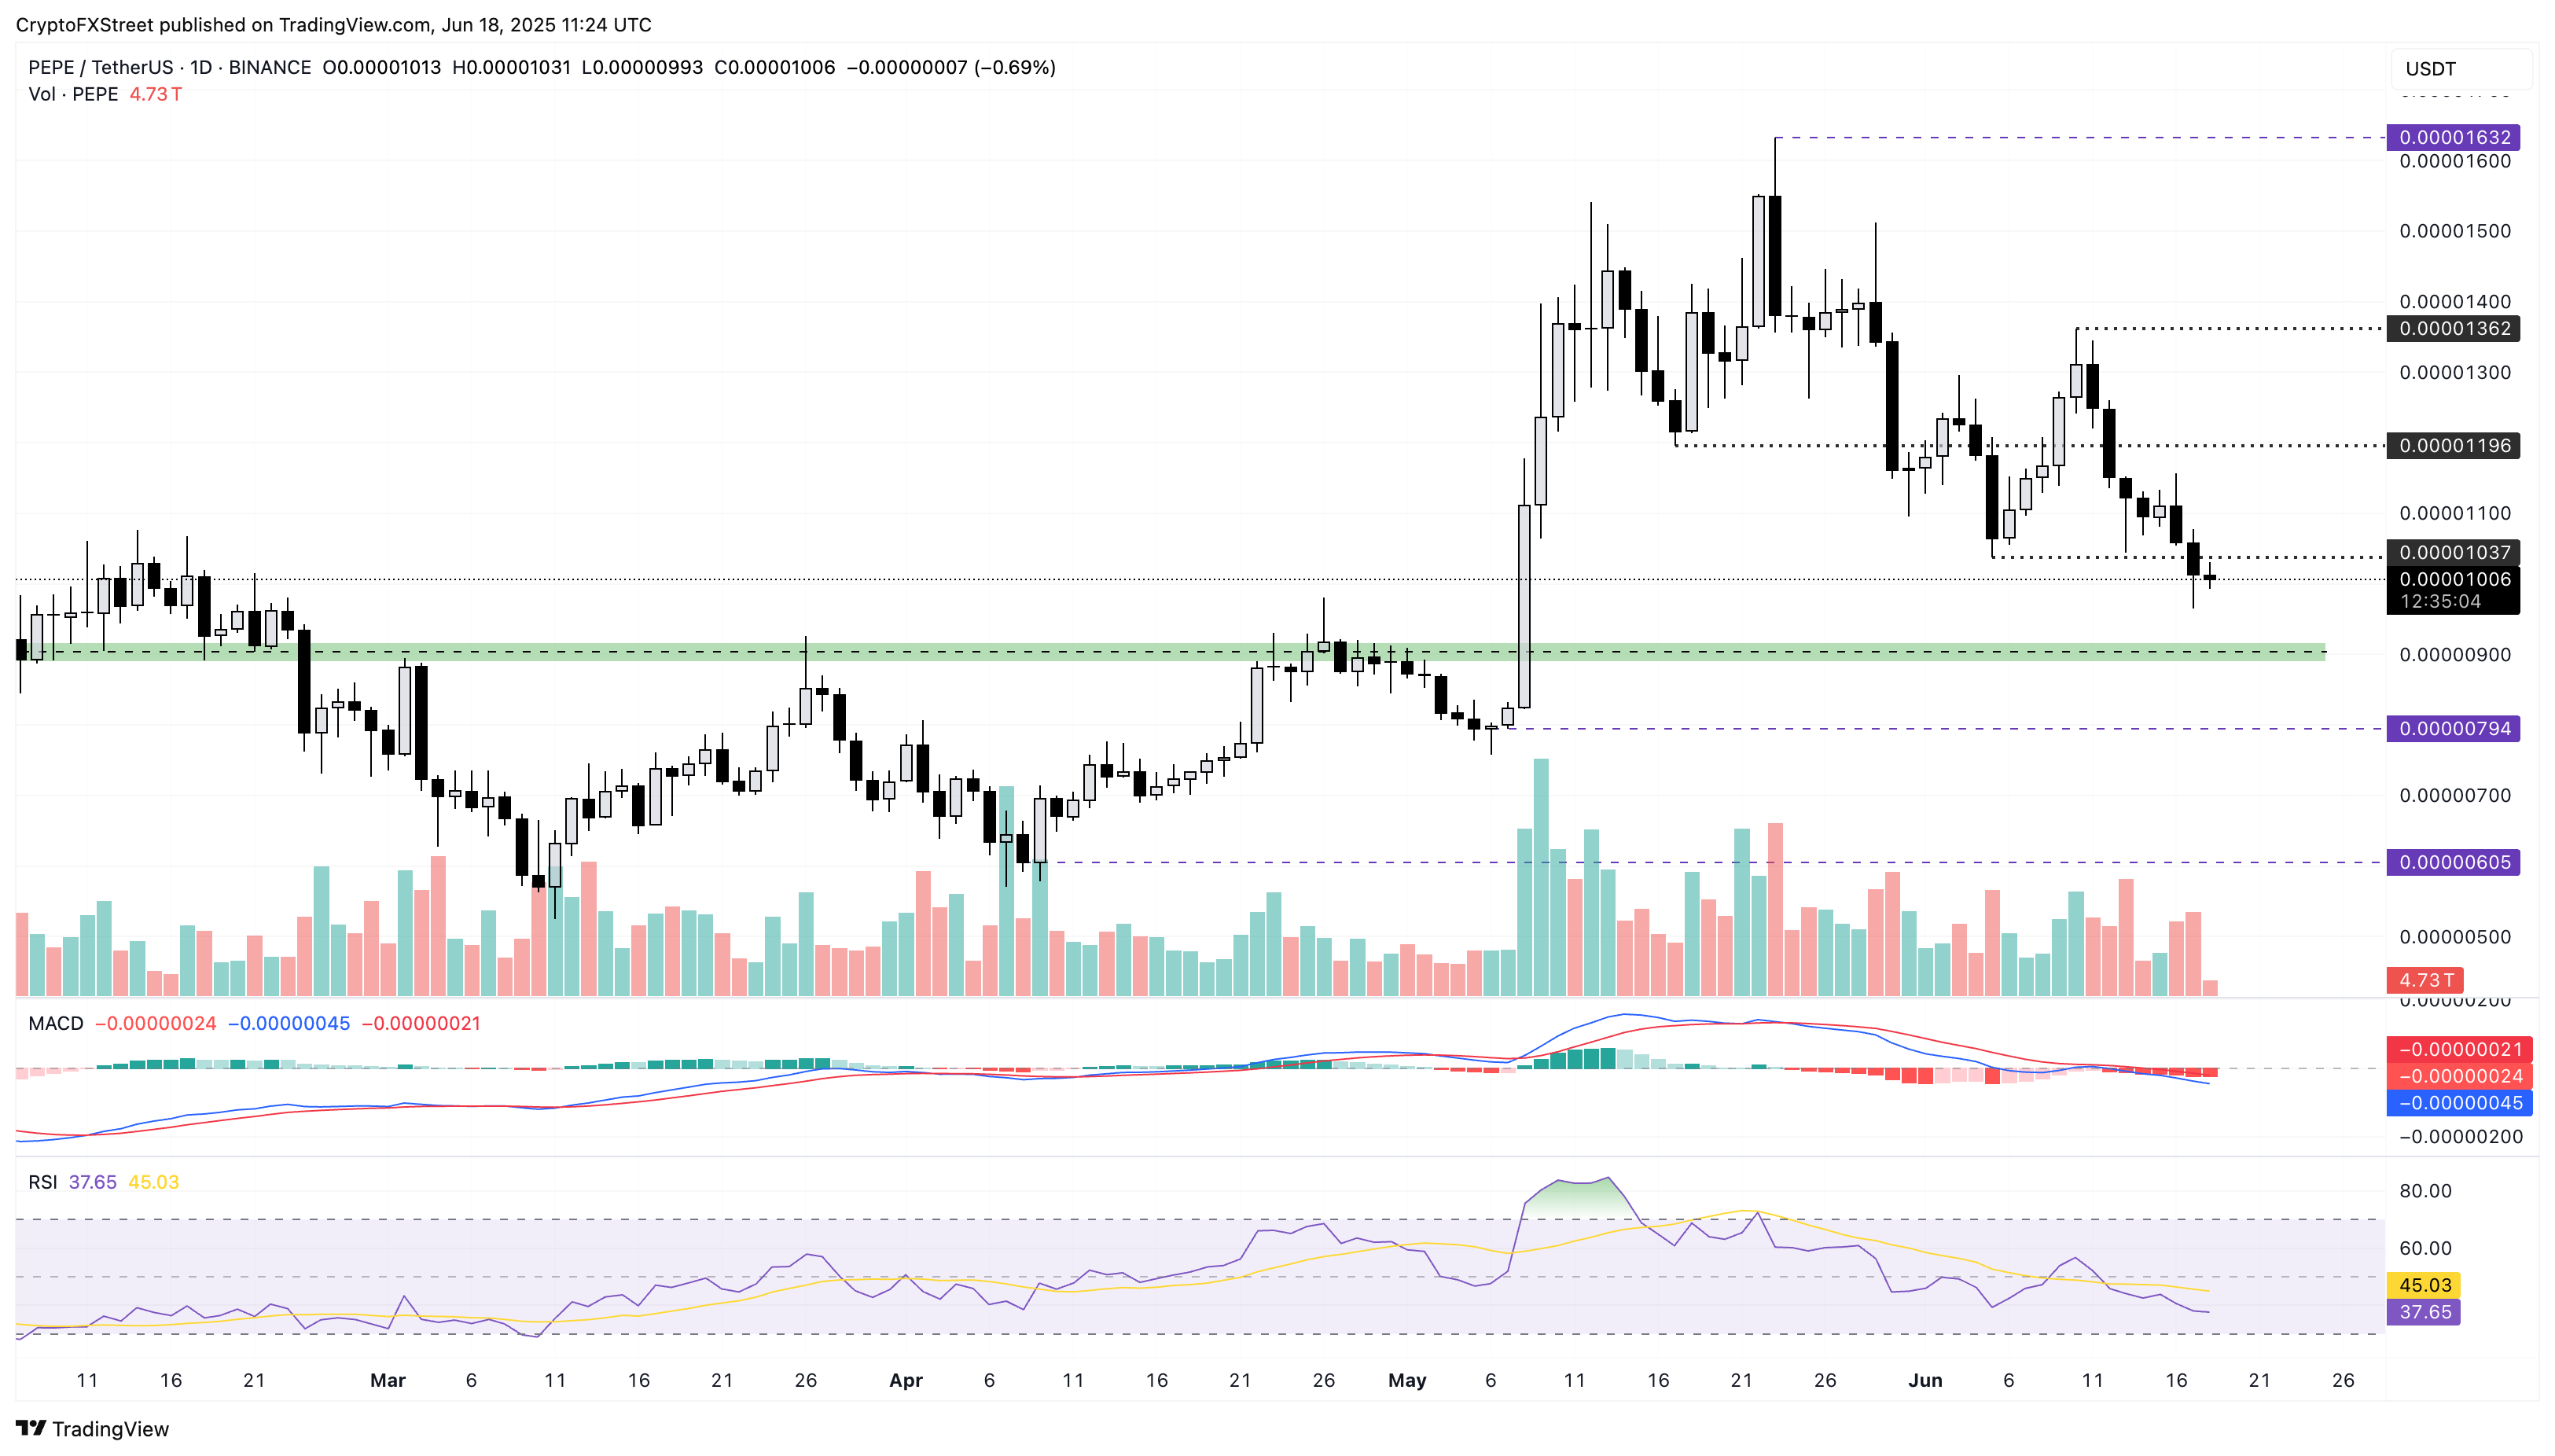
Pepe is struggling to float above its $0.00001000 psychological support. However, the meme coin is down nearly 10% so far this week, flashing a bearish trend as the path of least resistance.
The declining meme coin could close the daily candle below the $0.00001000 psychological support. In such a scenario, PEPE could test the support zone near $0.00000900, marked by a green band on the daily chart, last tested on April 26.
As the PEPE/USDT pair falls, the momentum indicator signals a bearish bias. The RSI at 38 draws closer to the oversold zone while the MACD indicator declines with a fresh wave of bearish histograms.

PEPE/USDT daily price chart.
If the tensions ease in the Middle East, stability in the broader cryptocurrency market could help Pepe float above $0.00001000. If so, Pepe could retest the $0.00001196 level marked by the May 17 low.


