
SUI Price Forecast: Triangle meltdown risks extended correction amid growing bearish bias
- Sui struggles to maintain intraday gains as the breakdown of a triangle chart pattern fuels selling pressure.
- Bearish bias in Sui derivatives drives the Open Interest down to a 30-day low.
- The technical outlook points to a steeper correction, as SUI’s pullback tests another support level.
Sui (SUI) trades on a weaker note near a crucial support level at $2.78 on Wednesday following Tuesday’s steep correction. The negative outlook persists in the derivatives market as Open Interest (OI) crashes to a monthly low alongside the taker sell volume, pointing to an extended downfall.
Bullish sentiment wanes in SUI derivatives market
Coinglass’ data shows a drop in Open Interest to $1.15 billion on Wednesday, the lowest value since April 25. In comparison to the all-time high of $2.05 billion recorded on May 23, the OI has decreased by over 43% in less than four weeks.
A declining Open Interest indicates decreased buying activity, likely due to increased capital outflow from the derivatives market. Hence, a decline in SUI OI signals a lowered bullish sentiment.
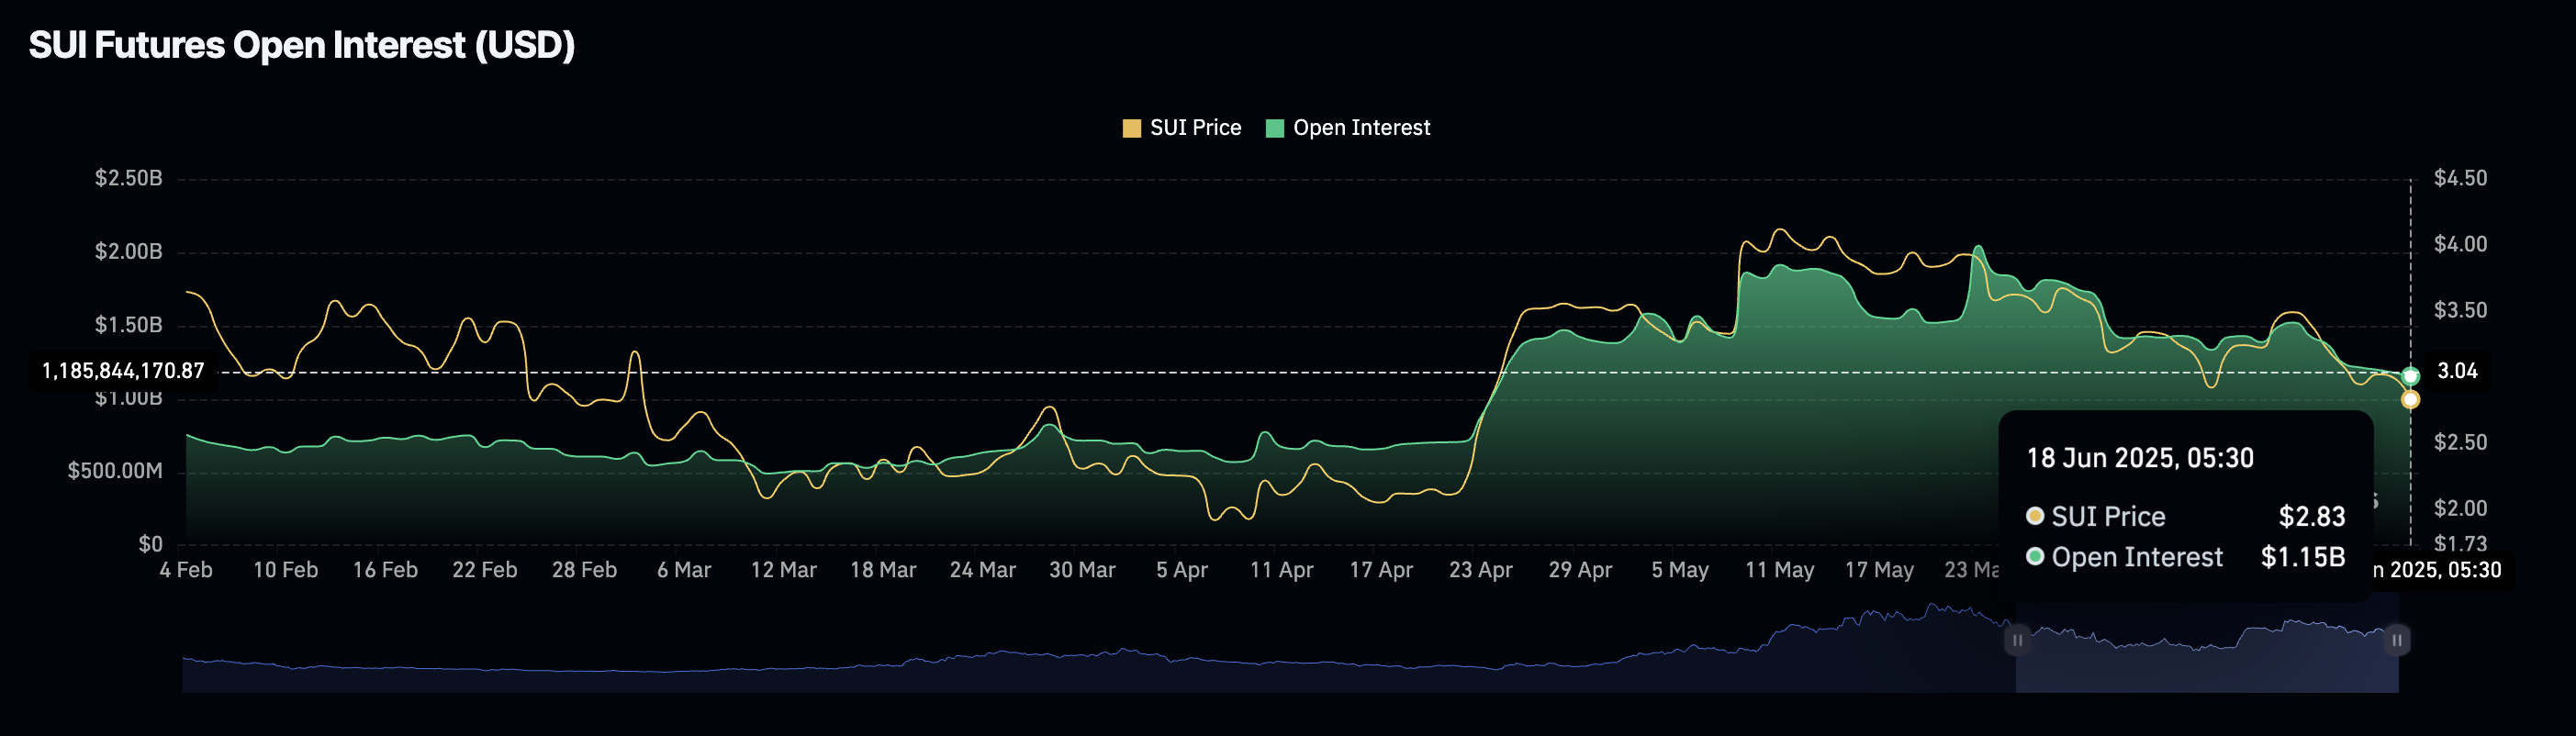
SUI Open Interest. Source: Coinglass
The OI-weighted funding rate is on a downward trend, currently at 0.0060% from a peak of 0.010% earlier in the day. Positive funding rates are imposed on bulls during periods of increasing buying activity to align swap and spot prices. A declining OI-weighted funding rate cements the thesis of decreased buying in SUI derivatives.
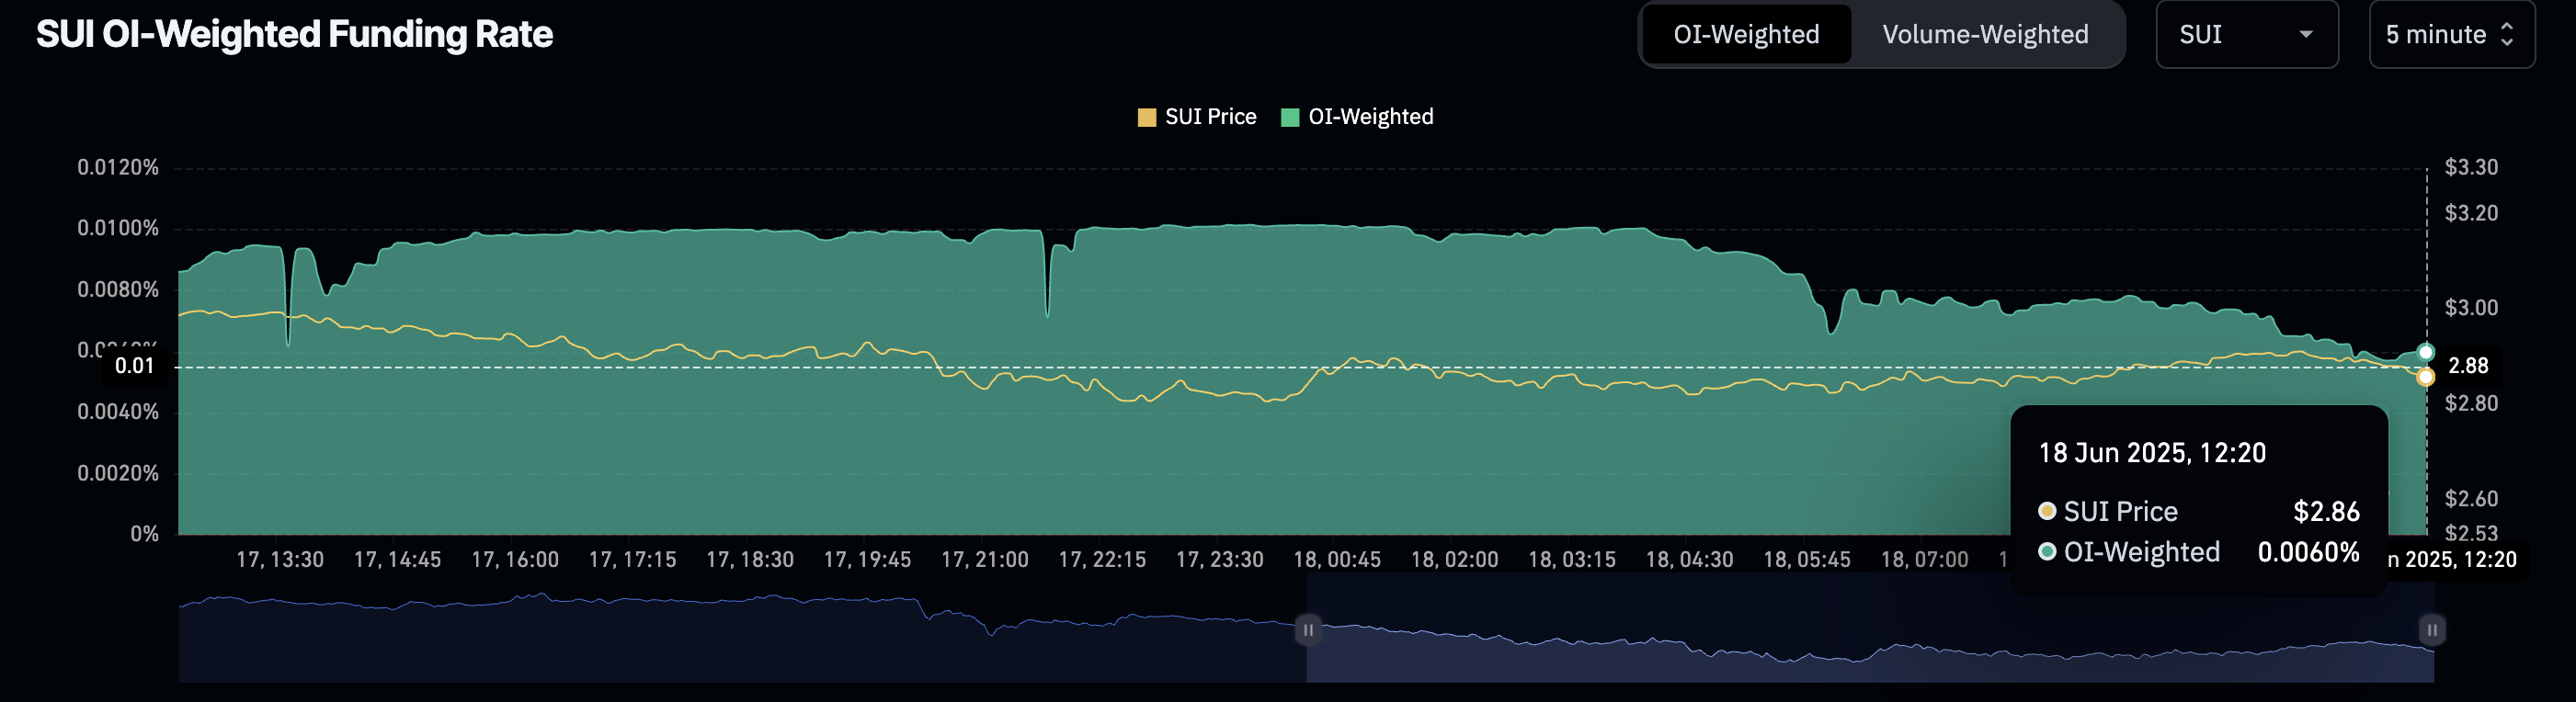
SUI OI-weighted funding rate. Source: Coinglass
According to the Taker buy/sell volume, shorts account for nearly 55% of the volume. In comparison to 45% of longs, a bearish bias is evident as the long/short ratio reads 0.8195.
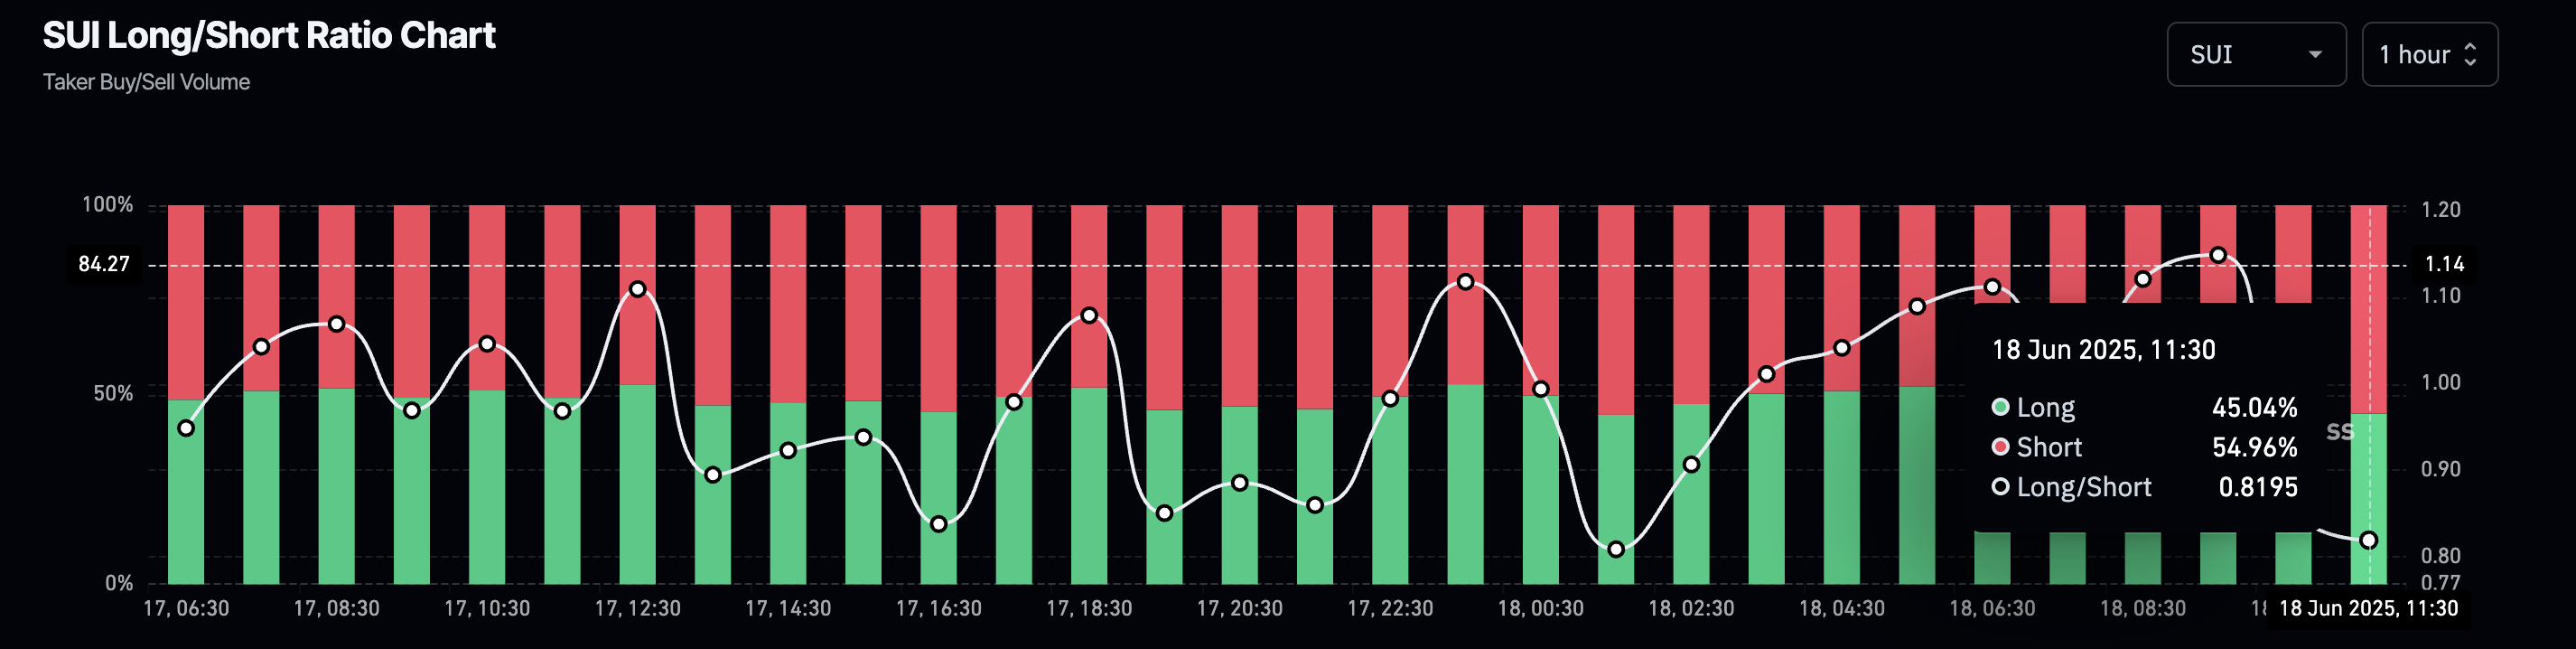
SUI long/short ratio. Source: Coinglass
SUI triangle breakdown risks downhill
SUI is under pressure, struggling to hold above the $2.78 support level last tested on March 27. At the time of writing, the altcoin trades at $2.85, with the daily low of $2.68 marking the lowest trading price since April 23.
The path of least resistance after the triangle breakdown in the daily chart points to the downside. Failing to hold above the $2.78 support on a daily close could extend the correction, with the next support for SUI at $2.24, aligning with the 23.6% Fibonacci retracement from the all-time high of $5.36 and the year-to-date low of $1.71.
Amid rising downside risk, the momentum indicators flash mixed signals on the daily chart. The Relative Strength Index (RSI) at 36 heads lower towards the oversold boundary, signaling increased selling pressure. However, RSI forms a higher low compared to the June 5 bottom, diverging from the declining SUI price trend. Traders consider this bullish divergence to be a reversal signal.
Meanwhile, the Moving Average Convergence/Divergence (MACD) indicator declines in the negative region alongside its signal line, implying a bearish trend in motion.
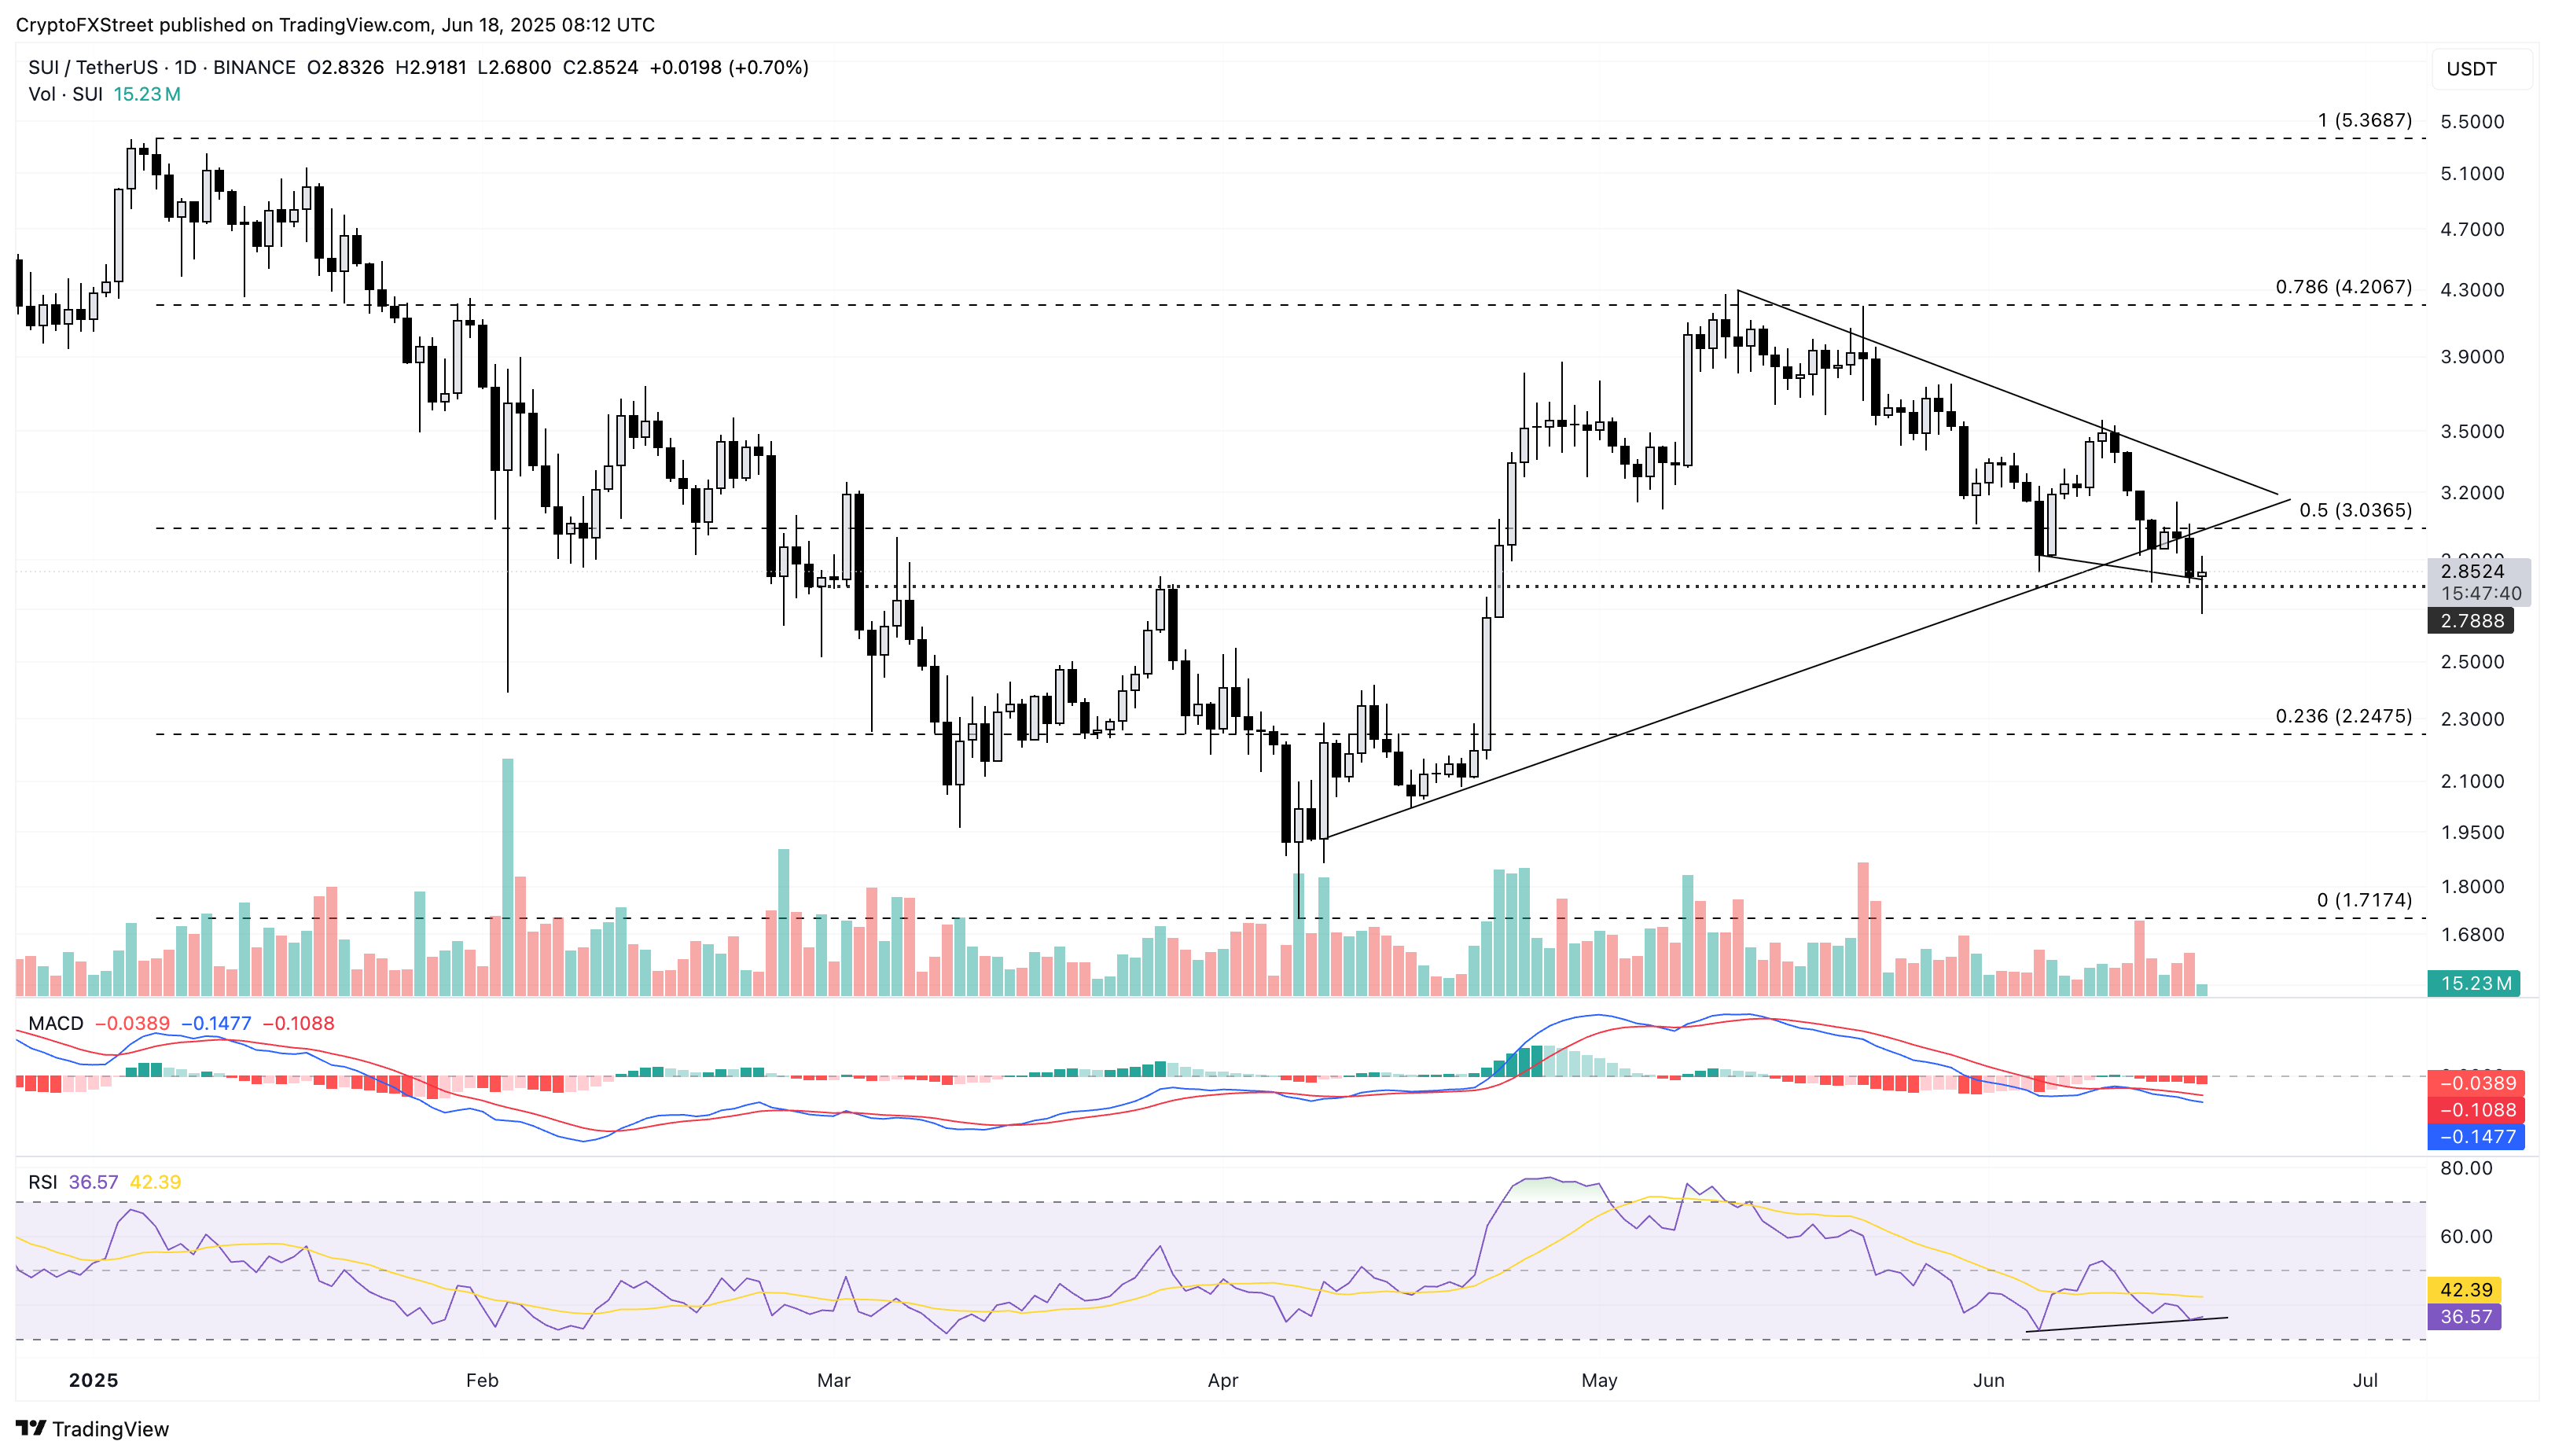
SUI/USDT daily price chart.
If SUI bounces back from the $2.78 support, the $3 psychological mark, aligned with the 50% Fibonacci level at $3.03, will act as immediate resistance. A closing above this region could nullify the downside risk and prolong the recovery to $3.55, the monthly high.
Bài viết đề xuất


