
Top 3 Price Prediction: Bitcoin, Ethereum, Ripple: BTC, ETH and XRP breakout or fakeout? Momentum tools flash weakness
- Bitcoin trades slightly lower on Monday after breaking above key resistance at $105,000 , raising concerns of a potential bull trap.
- Ethereum approaches the critical 200-day EMA support near $2,438; a daily close below this level could trigger a deeper correction.
- XRP hovers around the 50-day EMA at $2.27, holding ground despite weakening momentum.
Bitcoin (BTC) trades slightly lower on Monday after breaking above key resistance at $105,000 on Sunday, raising concerns of a potential bull trap. Meanwhile, Ethereum (ETH) and Ripple (XRP) hold near crucial support levels; a decisive close below their support levels could trigger a deeper correction. Moreover, these top cryptocurrencies' momentum indicators flash weakness as the broader crypto market enters a phase of consolidation and waning bullish strength.
Bitcoin breakout or fakeout?
Bitcoin's price rallied 3.23%, breaking above its key resistance level at $105,000 on Sunday. However, at the time of writing on Monday, it has failed to find support around this level and is trading down to around $104,624.
The momentum indicators on the daily chart show signs of weakness. The Relative Strength Index (RSI) reads 65 and points downward after being rejected from its overbought levels of 70 on Sunday, indicating fading bullish momentum. Moreover, the Moving Average Convergence Divergence (MACD) also showed a bearish crossover on Sunday, giving sell signals and indicating the start of a downward trend.
If BTC continues its pullback, it could extend the decline to retest the psychological support level at $100,000.
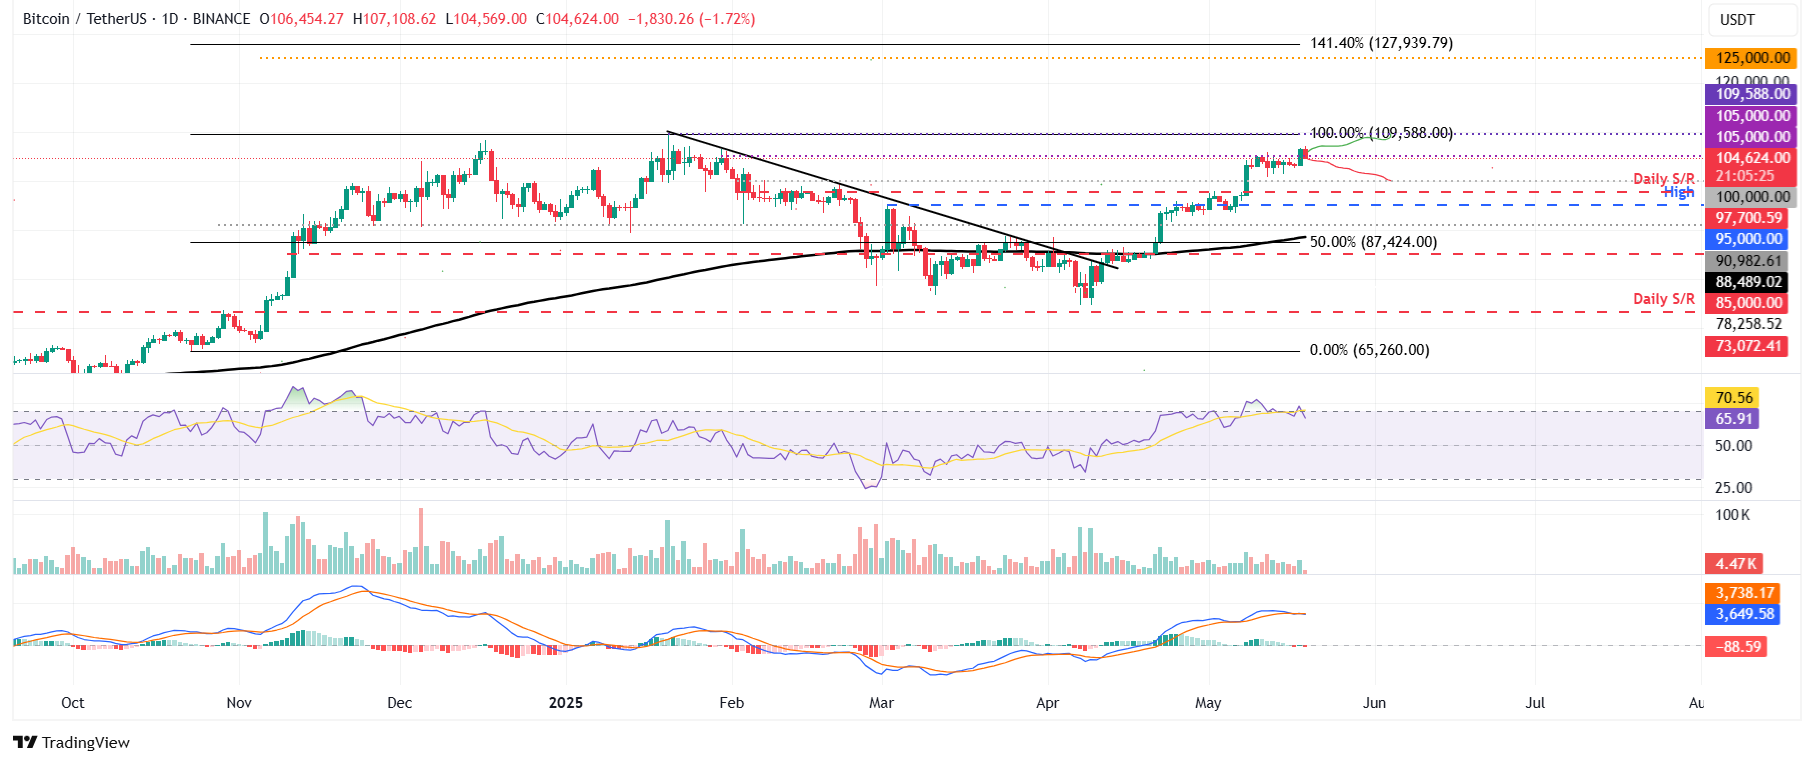
BTC/USDT daily chart
However, if BTC rebounds and closes above $105,000, it could extend the rally toward the all-time high of $109,588 set on January 20.
Ethereum's 200-day EMA tussle may decide the next move
Ethereum price retested and found support around its 200-day Exponential Moving Average (EMA) at $2,438 on Sunday. However, at the time of writing on Monday, it has edged below this level, trading at around $2,387.
If ETH continues its correction and closes below $2,438 on a daily basis, it could extend the decline to retest its next key support level at $2,000.
The RSI on the daily chart reads 60 and points downward after being rejected from its overbought conditions last week, indicating fading bullish momentum. The MACD indicator is also flipping to a bearish crossover on the daily chart. If the crossover occurs, it would confirm another sell signal.
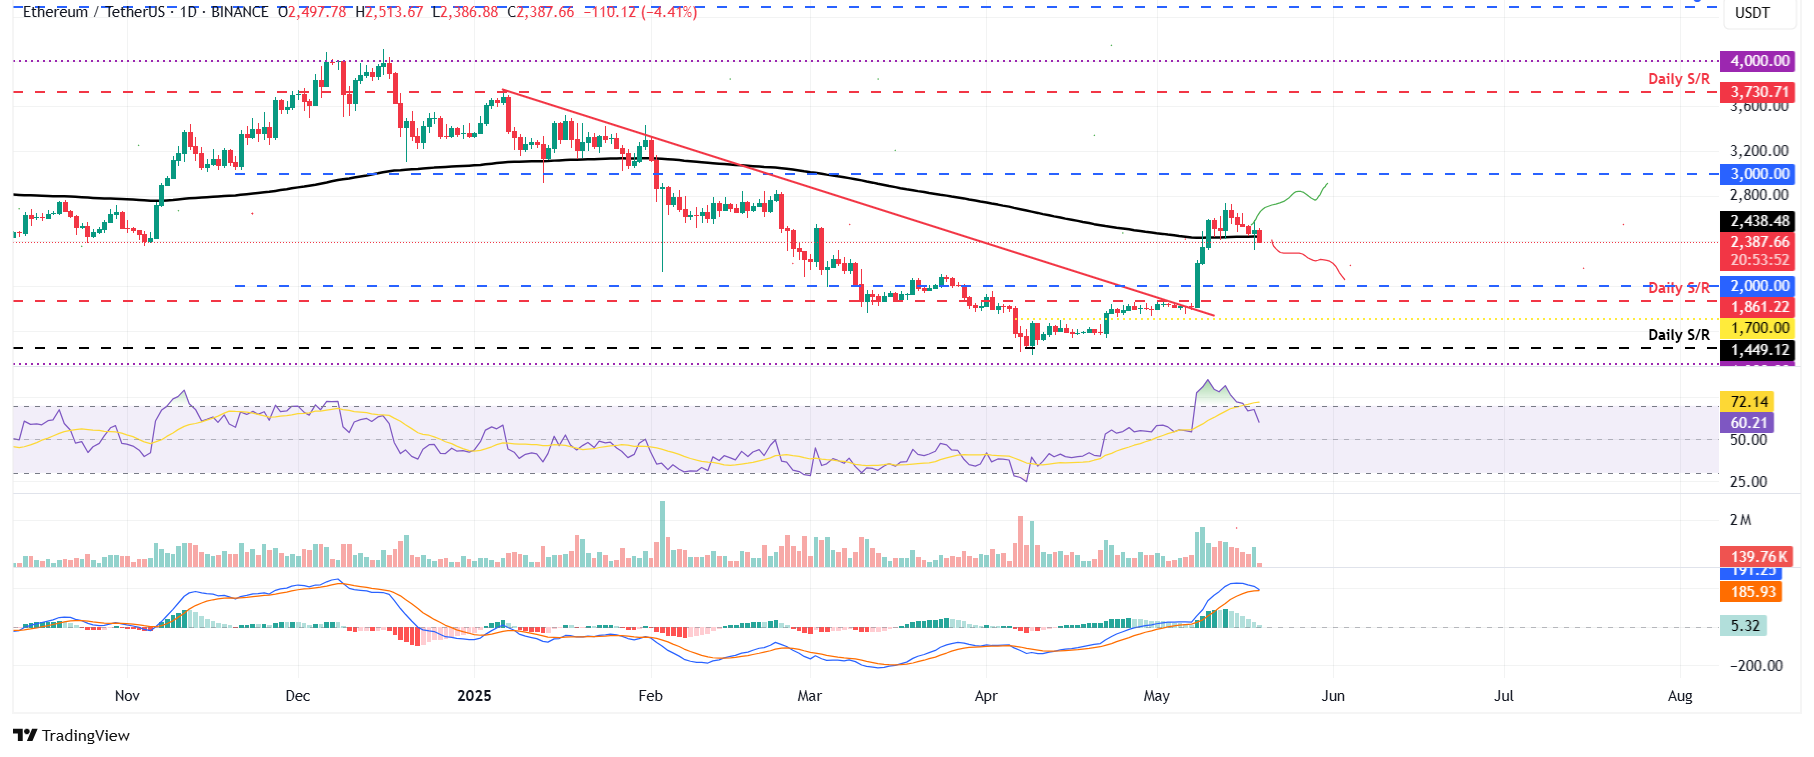
ETH/USDT daily chart
On the other hand, if the 200-day EMA at $2,438 holds as support and ETH recovers, the rally could extend to retest its key psychological level at $3,000.
XRP bulls show weakness in momentum
XRP price rebounded after retesting its 50-day EMA at $2.28 on Sunday and rose 3.18% the next day. At the time of writing on Monday, it had declined, erasing most of its previous day gains and trading at around $2.36.
If XRP breaks and closes below its 50-day EMA on a daily basis, it could extend the correction toward its next key support at $2.23.
The RSI on the daily chart reads 52, pointing toward its neutral level of 50, indicating fading bullish momentum. If the RSI moves below its neutral level of 50, it would give rise to strong bearish momentum and a sharp fall in XRP prices. The MACD indicator is also switching to a bearish crossover on the daily chart. If the crossover occurs, it would confirm another sell signal.
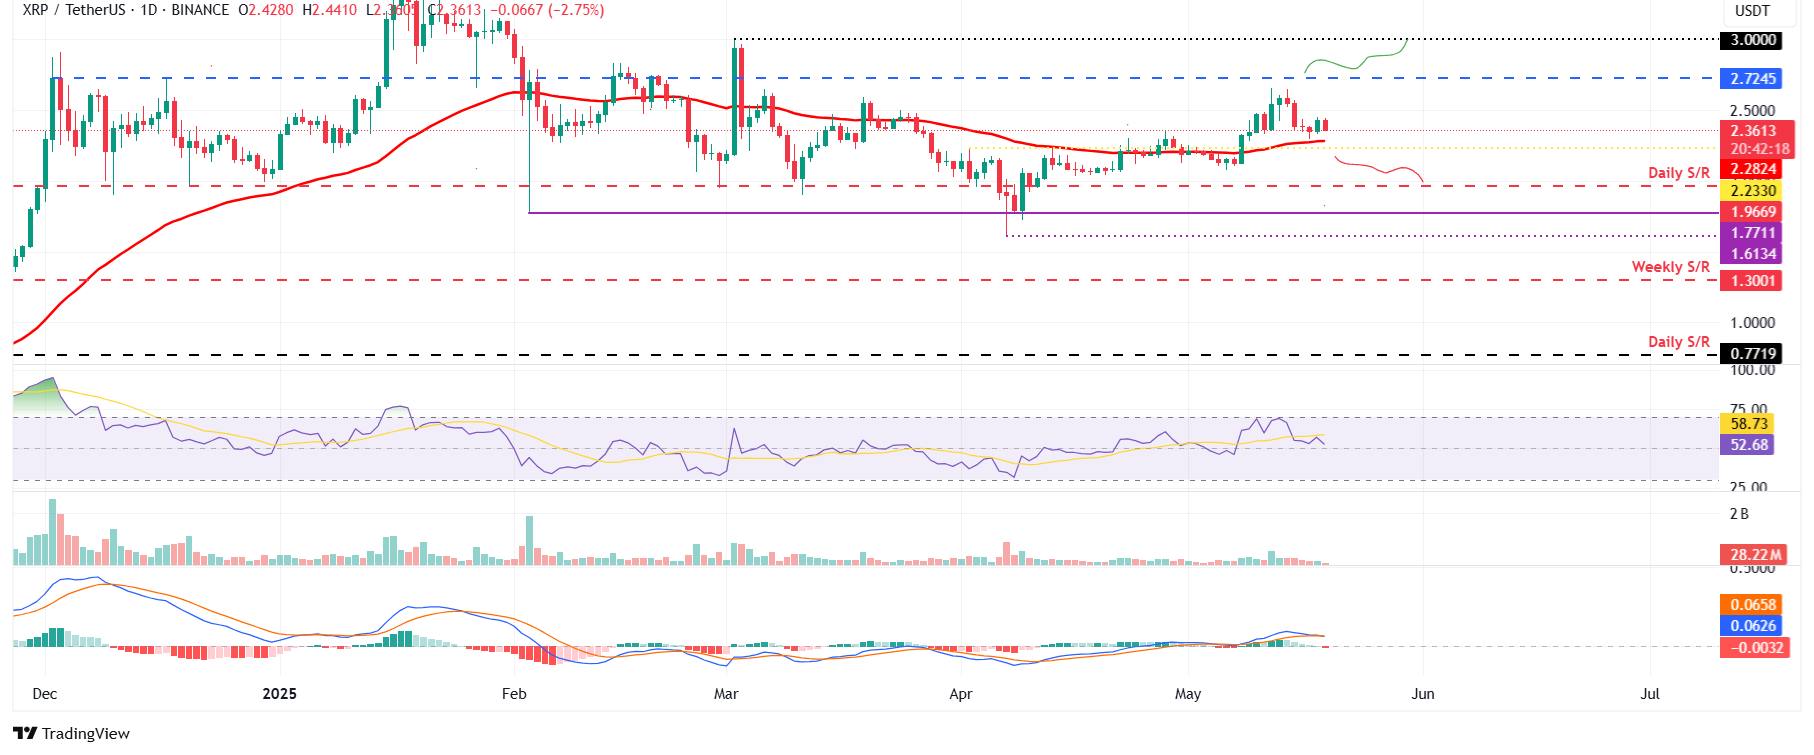
XRP/USDT daily chart
Conversely, if the 50-day EMA holds as support, XRP could trigger a rally to retest its $2.72 resistance level.
Bitcoin, altcoins, stablecoins FAQs
Bitcoin is the largest cryptocurrency by market capitalization, a virtual currency designed to serve as money. This form of payment cannot be controlled by any one person, group, or entity, which eliminates the need for third-party participation during financial transactions.
Altcoins are any cryptocurrency apart from Bitcoin, but some also regard Ethereum as a non-altcoin because it is from these two cryptocurrencies that forking happens. If this is true, then Litecoin is the first altcoin, forked from the Bitcoin protocol and, therefore, an “improved” version of it.
Stablecoins are cryptocurrencies designed to have a stable price, with their value backed by a reserve of the asset it represents. To achieve this, the value of any one stablecoin is pegged to a commodity or financial instrument, such as the US Dollar (USD), with its supply regulated by an algorithm or demand. The main goal of stablecoins is to provide an on/off-ramp for investors willing to trade and invest in cryptocurrencies. Stablecoins also allow investors to store value since cryptocurrencies, in general, are subject to volatility.
Bitcoin dominance is the ratio of Bitcoin's market capitalization to the total market capitalization of all cryptocurrencies combined. It provides a clear picture of Bitcoin’s interest among investors. A high BTC dominance typically happens before and during a bull run, in which investors resort to investing in relatively stable and high market capitalization cryptocurrency like Bitcoin. A drop in BTC dominance usually means that investors are moving their capital and/or profits to altcoins in a quest for higher returns, which usually triggers an explosion of altcoin rallies.
Bài viết đề xuất


