
Bitcoin Price Forecast: BTC stabilizes around $83,000 ahead of US PPI data and weekly jobless claims
- Bitcoin hovers around $83,100 on Thursday after recovering nearly 3% so far this week.
- Market participants await US PPI data and weekly jobless claims for further economic cues on Thursday.
- CryptoQuant weekly report highlights how Bitcoin could be at the start of a bear market.
Bitcoin (BTC) hovers around $83,100 on Thursday after recovering nearly 3% this week as February’s US Consumer Price Index (CPI) data came in softer-than-expected on Wednesday. Market participants await US Producer Price Index (PPI) data for February and initial weekly jobless claims for further economic cues on Thursday. Moreover, a CryptoQuant weekly report highlights how Bitcoin could be at the start of a bear market.
Bitcoin shows mild recovery as US CPI data shows softer inflation
Bitcoin price recovered slightly on Wednesday and closed above $83,680. This mild recovery was fueled by the US CPI data, which showed both headline and core inflation cooling faster than expected in February. The softer inflation report fueled speculation that the US Federal Reserve (Fed) could cut interest rates sooner than anticipated, supporting price recovery in risky assets like Bitcoin.
However, the uncertainty surrounding US President Donald Trump's aggressive trade tariffs fuels concerns about a potential economic slowdown, pushing investors toward traditional safe-haven assets rather than risky assets.
Suppose there is low inflation and weak jobs. In that case, the chances of Fed rate cuts increase, boosting risky assets by enhancing risk appetite and vice versa for higher inflation.
Therefore, market participants are awaiting Thursday’s US PPI data for February and weekly jobless claims for further economic cues.
BITCOIN Act of 2025, 1 million BTC in 5 years — says Congressman Nick Begich
Congressman Nick Begich of Alaska announced on Tuesday that he has introduced the BITCOIN Act of 2025 in the House of Representatives. The bill aims to establish a US Strategic Bitcoin Reserve (SBR) to strengthen America’s financial security and economic independence.
The BITCOIN Act directs the acquisition of 1 million Bitcoin over five years, mirroring US Gold reserves' scale and strategic importance.
“Not a single taxpayer dollar will be used,” Begich said during the Bitcoin for America Summit.
He continued, “President Trump’s Executive Order laid the foundation for a long-term national strategy on Bitcoin, and today, we are delivering durable and permanent authority to make that vision a reality.”
If approved, the BITCOIN Act would mark a transformative step for US financial policy, positioning Bitcoin as a strategic national asset and could rally its price.
Bitcoin valuation metrics indicate “we are in bearish territory” – CryptoQunat report
CryptoQuant weekly report highlights how Bitcoin could be at the start of a bear market. The report shows that all BTC valuation metrics are in bearish territory.
The graph below shows that the Bitcoin Bull-Bear Market Cycle Indicator is currently at its most bearish level of this cycle (light blue areas in the left chart). Meanwhile, the MVRV Ratio Z-score has fallen below its 365-day moving average (marked by red circles on the right chart), indicating that the upward price momentum has weakened. Historically, valuation metrics at these levels have signaled either a sharp correction or the start of a bear market.
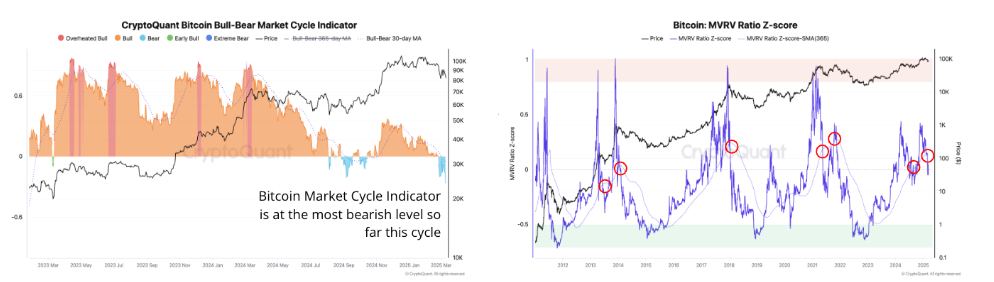
Bitcoin Bull-Bear Market Cycle Indicator (Left) chart. Bitcoin MVRV Ratio Z-score (Right) chart. Source: CryptoQuant
The report further explains that the US-based spot Exchange Traded Funds (ETFs) have become net sellers of Bitcoin this year, putting additional downward pressure on the token’s price. So far in 2025, cumulative purchases by US Bitcoin spot ETFs stand at -0.2K BTC, indicating that ETFs have been net sellers. This contrasts with net purchases of 165K Bitcoin in the same period of 2024. In US Dollar (USD) terms, ETFs have bought $0.7 billion in Bitcoin, significantly down from purchases of $8.7 billion in the same period of 2024.
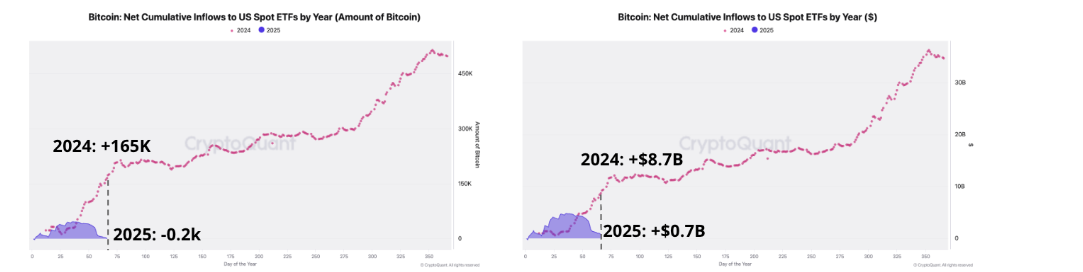
Bitcoin Net cumulative inflows to US spot ETFs by year chart. Source: CrytpoQuant.
The report explains that if Bitcoin’s price fails to hold the current support level between $75,000 and $78,000 – slightly below the lower band of Trader’s On-chain Realized Price – its next target could be $63,000. This lower level represents the Trader’s minimum On-chain Realized Price minimum band (dashed blue line), which serves as ultimate support during deep price corrections.
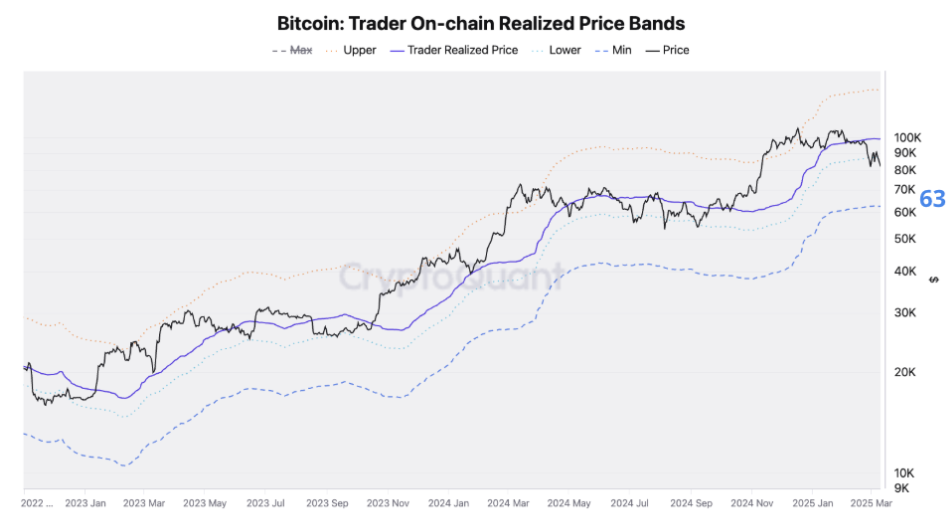
Bitcoin Trader on-chain realized price bands. Source: CryptoQuant
Bitcoin Price Forecast: RSI indicator shows bullish divergence
Bitcoin price broke below its 200-day Exponential Moving Average (EMA) at $85,648 on Sunday and declined 9.14% until the next day. However, BTC pushed lower, found support around the $76,600 level, and recovered 6.47% until Wednesday. At the time of writing on Thursday, it hovers at around $83,100.
The Relative Strength Index (RSI) indicator suggests a strength in momentum on the daily chart. The lower low in the Bitcoin price formed on Tuesday does not reflect the RSI higher high for the same period. This development is termed a bullish divergence, often leading to a trend reversal or short-term rally.
If bullish divergence plays a part, BTC could extend the recovery to $85,000.
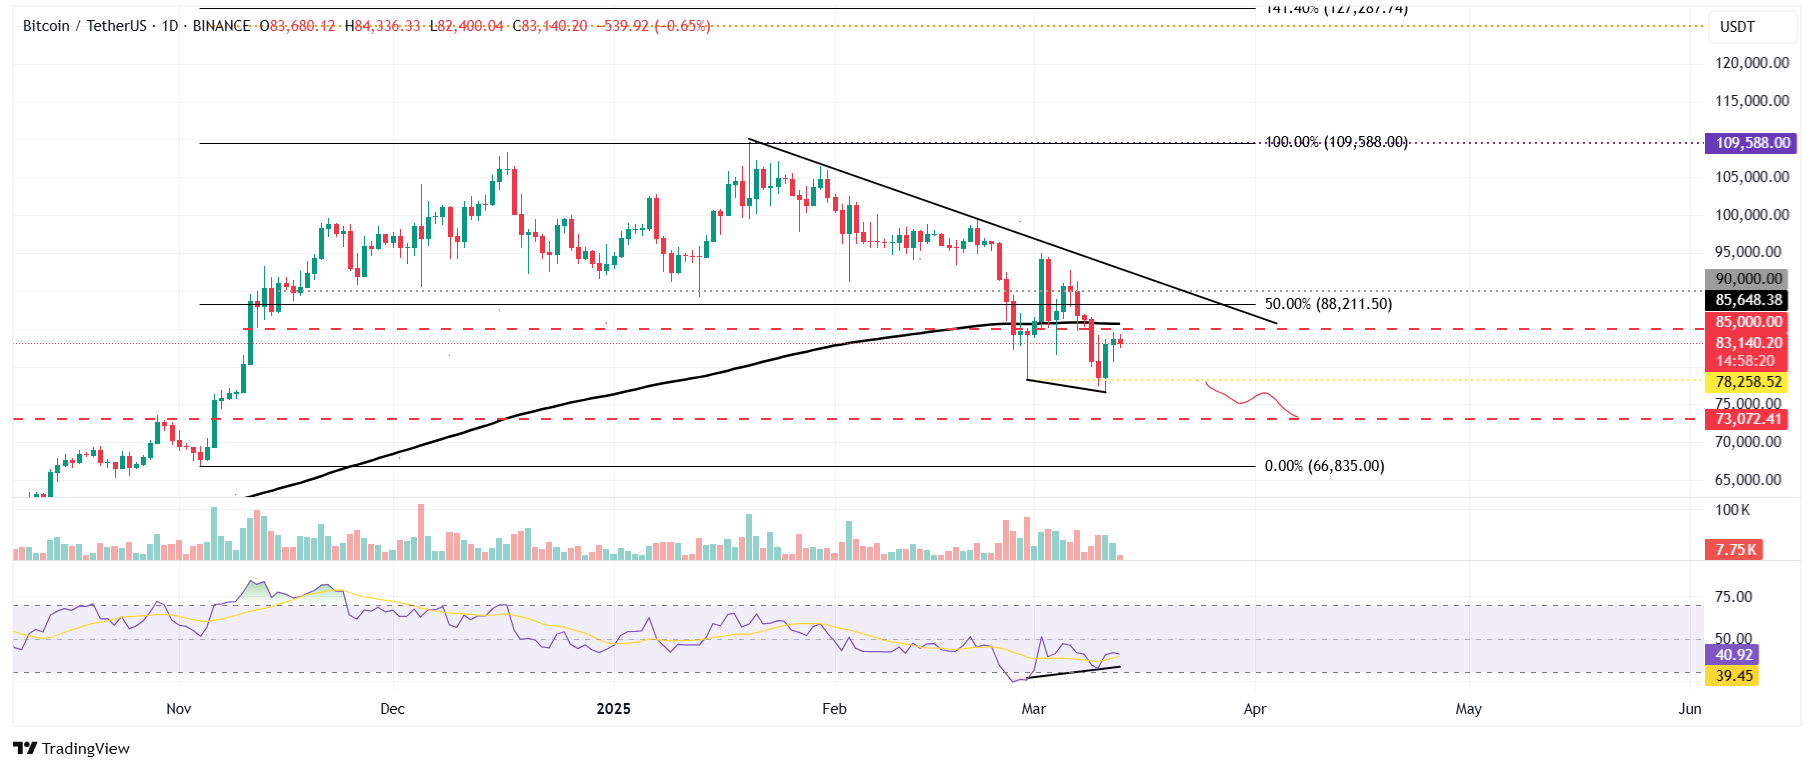
BTC/USDT daily chart
However, if BTC corrects and closes below $78,258 (February 28 low), it could extend the decline to retest its next support level at $73,072.
Bitcoin, altcoins, stablecoins FAQs
Bitcoin is the largest cryptocurrency by market capitalization, a virtual currency designed to serve as money. This form of payment cannot be controlled by any one person, group, or entity, which eliminates the need for third-party participation during financial transactions.
Altcoins are any cryptocurrency apart from Bitcoin, but some also regard Ethereum as a non-altcoin because it is from these two cryptocurrencies that forking happens. If this is true, then Litecoin is the first altcoin, forked from the Bitcoin protocol and, therefore, an “improved” version of it.
Stablecoins are cryptocurrencies designed to have a stable price, with their value backed by a reserve of the asset it represents. To achieve this, the value of any one stablecoin is pegged to a commodity or financial instrument, such as the US Dollar (USD), with its supply regulated by an algorithm or demand. The main goal of stablecoins is to provide an on/off-ramp for investors willing to trade and invest in cryptocurrencies. Stablecoins also allow investors to store value since cryptocurrencies, in general, are subject to volatility.
Bitcoin dominance is the ratio of Bitcoin's market capitalization to the total market capitalization of all cryptocurrencies combined. It provides a clear picture of Bitcoin’s interest among investors. A high BTC dominance typically happens before and during a bull run, in which investors resort to investing in relatively stable and high market capitalization cryptocurrency like Bitcoin. A drop in BTC dominance usually means that investors are moving their capital and/or profits to altcoins in a quest for higher returns, which usually triggers an explosion of altcoin rallies.
Bài viết đề xuất


