


Top Altcoins Price Forecast: Ripple, Cardano, and Solana capped and vulnerable to downfall
- Ripple hovers around $0.9600 on Thursday, capped by a short-term resistance level around $0.9862.
- Cardano risks extending losses below $0.1500 after a more than 2% decline the previous day.
- Solana edges below $75, extending the previous day’s 2% losses as intense downside momentum pushes it into oversold territory.
Top altcoins, Ripple (XRP), Cardano (ADA), and Solana (SOL), remain vulnerable to further losses as selling pressure persists. Nvidia CEO Jensen Huang resignation and inflation concerns continue to keep broader market conditions volatile.
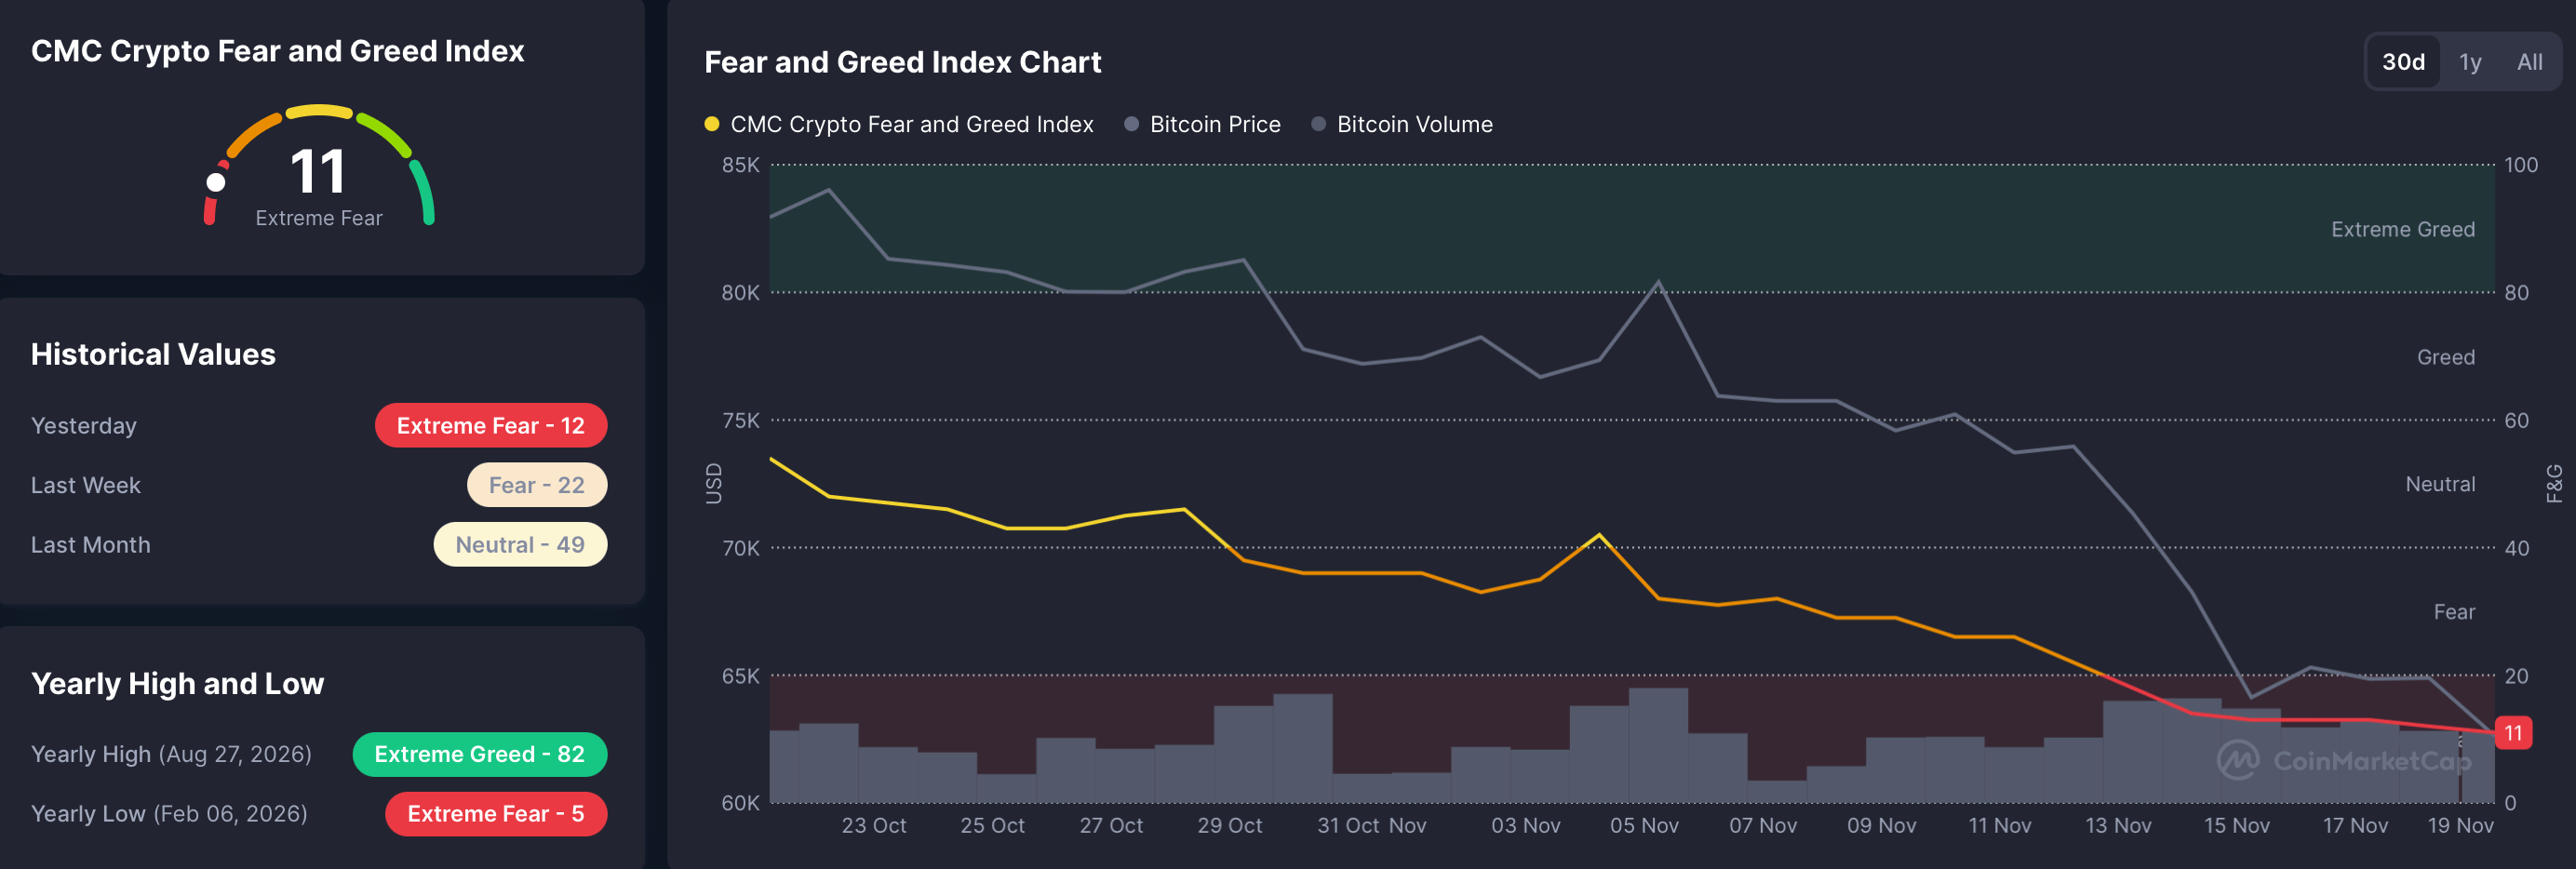
CoinMarketCap’s Fear and Greed Index sits at a four-month low of 11 on Thursday, suggesting intense risk-off sentiment in the market. In addition, the release of October’s Fed meeting minutes on Wednesday reinforces the odds of a rate hike in December, as previously reported by FXStreet.
The technical outlook for XRP, ADA, and SOL indicates a persistent bearish bias, with downside momentum remaining dominant.
Ripple risks further declines below $1
Ripple trades at $0.9687 at press time on Thursday, extending a bearish near-term bias well below both the 50- and 200-day Exponential Moving Averages (EMAs) at $1.1992 and $1.3204, respectively. From a technical perspective, XRP remains below the broken downward trendline resistance at around $1.2279, keeping the broader structure capped.
The Moving Average Convergence Divergence (MACD) line remains below the zero line, while the Relative Strength Index (RSI) hovers near 30, hinting at oversold conditions but not yet signaling a decisive rebound.
On the topside, initial resistance is seen at $0.9862, followed by a more notable barrier at $1.0692. Above these, the 50-day EMA at $1.1992 and the trendline resistance near $1.2279 form a dense supply zone, marking a distant structural ceiling.
On the downside, the next meaningful support sits at $0.8930, where a sustained break would expose the pair to renewed selling pressure despite the increasingly stretched momentum backdrop.
Cardano eyes a decline below $0.1500
Cardano trades at $0.1510 at press time on Thursday, maintaining its steady decline over the last six weeks. ADA extends its decline well below both the 50-day EMA at $0.1929 and the 200-day EMA at $0.2239, suggesting the broader downtrend remains intact.
Momentum conditions remain weak, with the RSI at 27, in oversold territory and the MACD line negative, suggesting that selling pressure persists even as the short-term downside may be stretched.
The immediate resistance for ADA is located at the 50-day EMA near $0.1929, followed by a more significant barrier at the 200-day EMA around $0.2239, where any recovery rally would likely struggle.
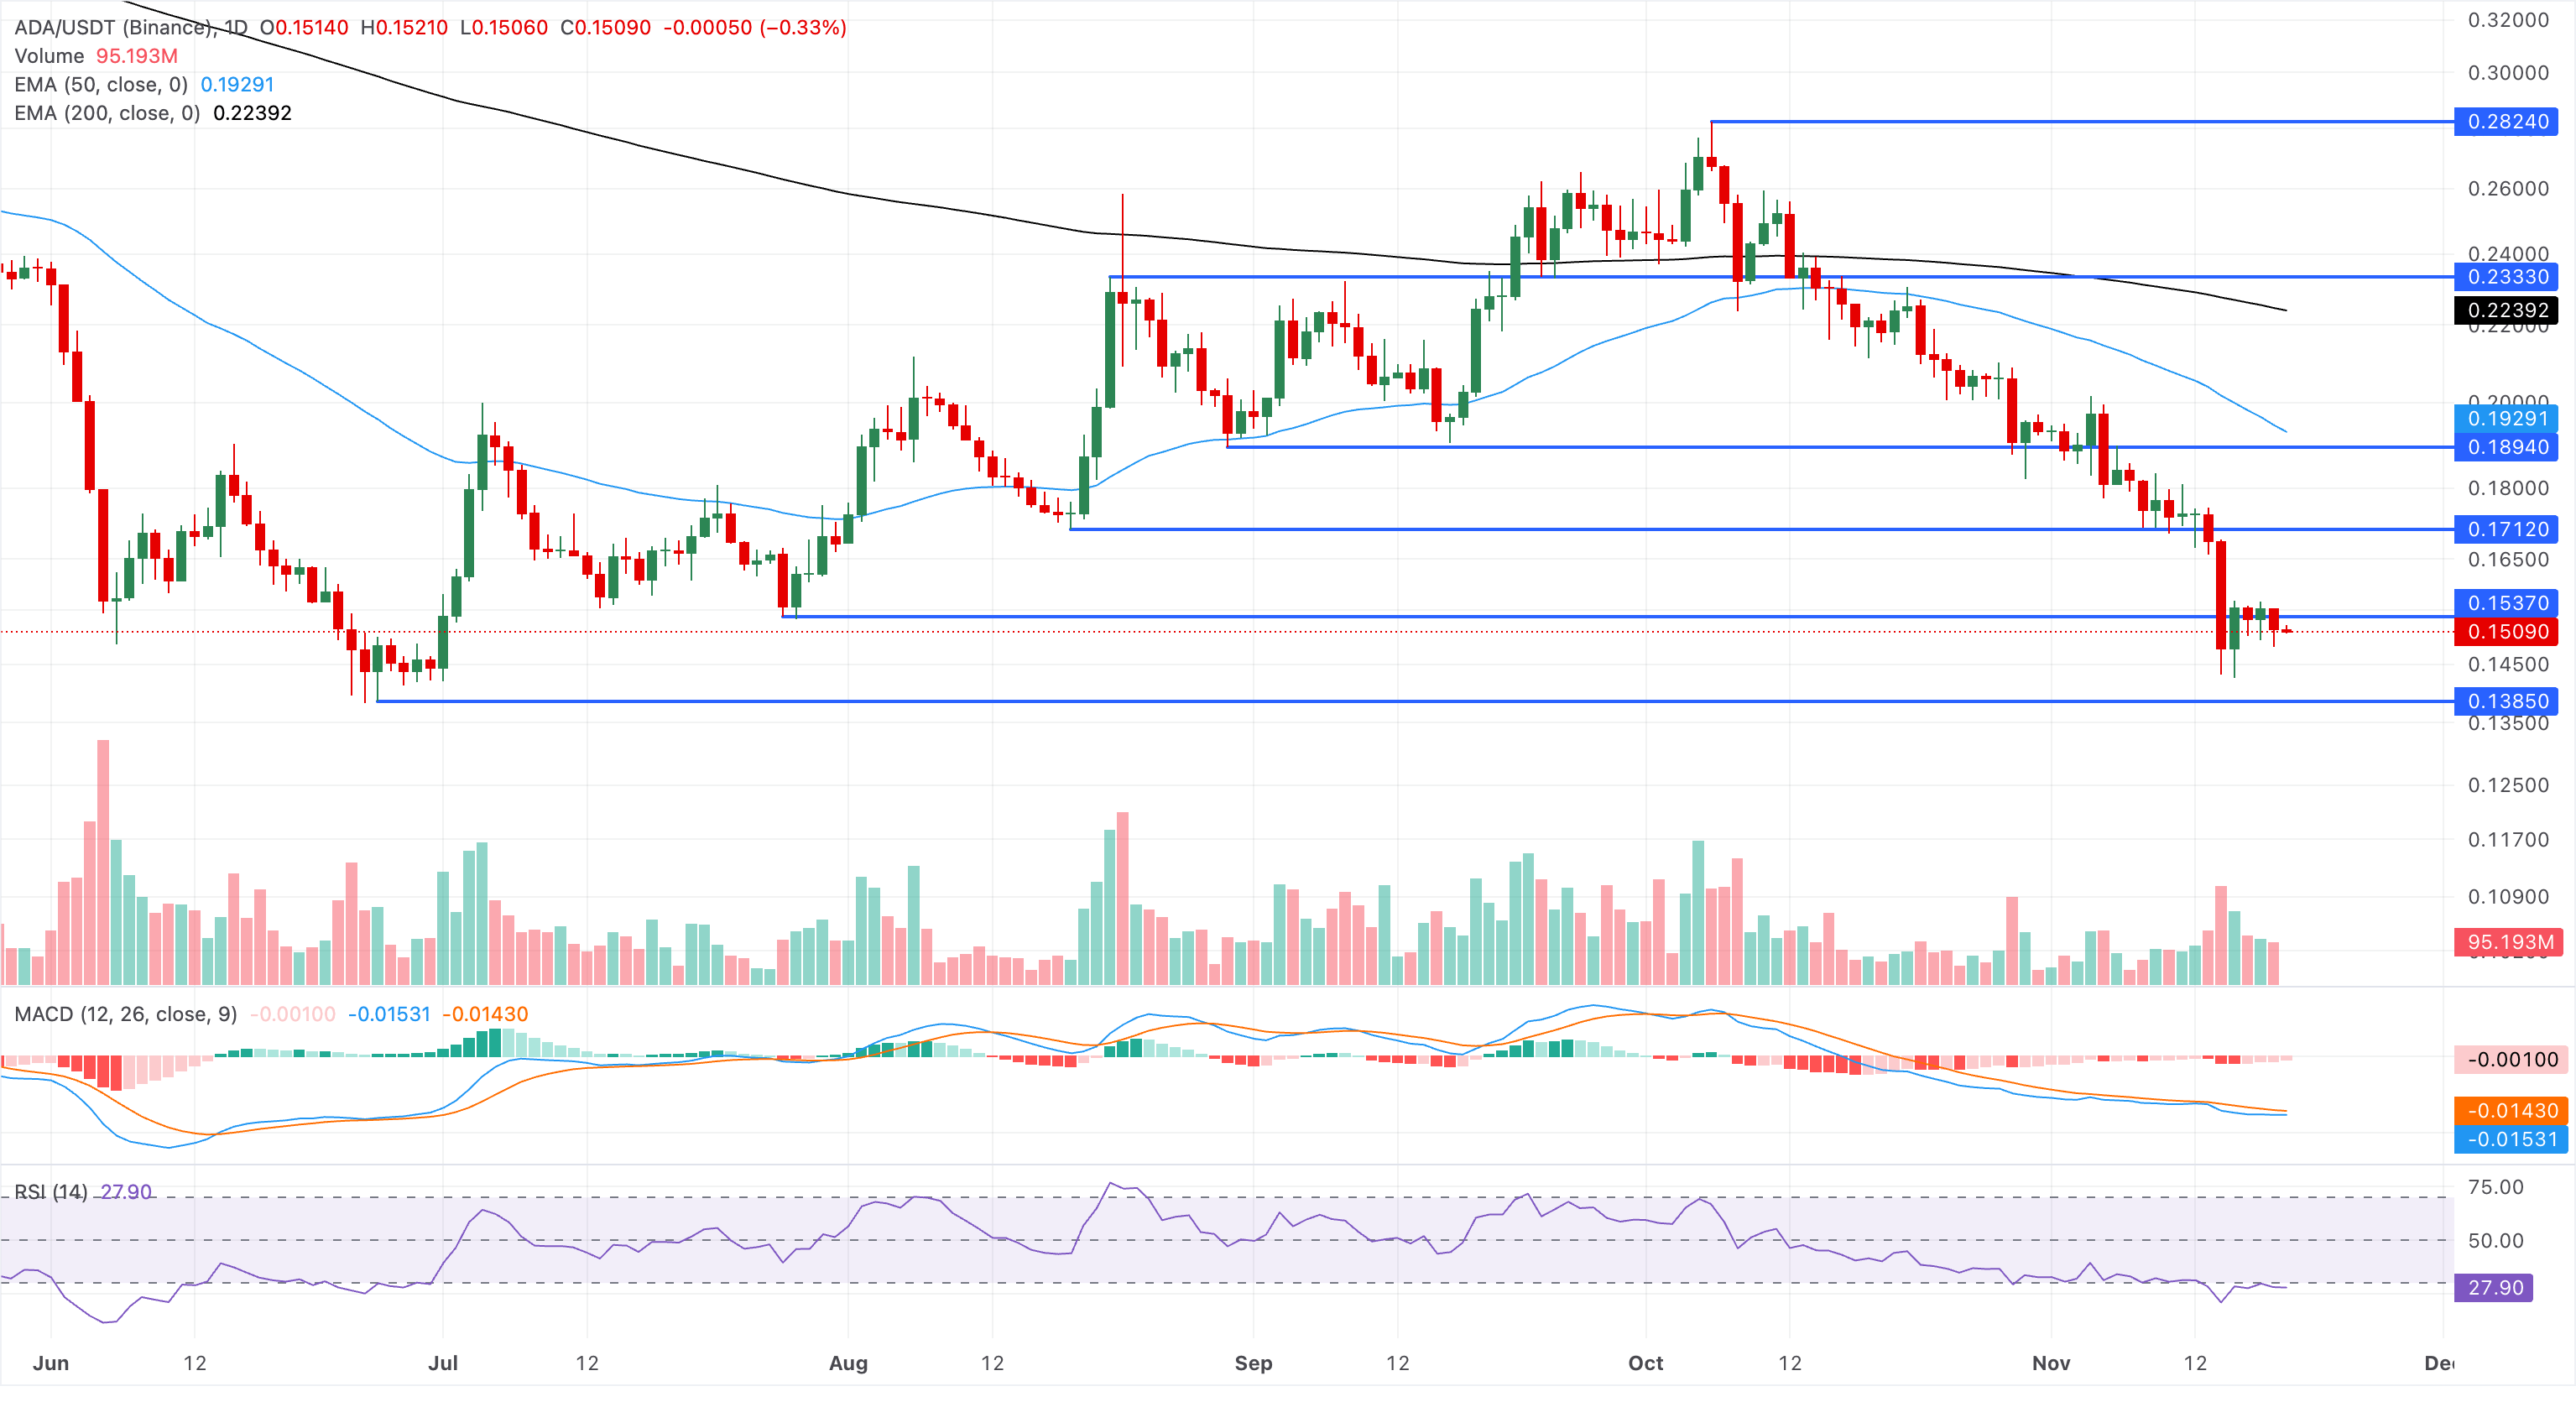
Looking down, the $0.1385 support level marked by the June 26 low could serve as a more sustainable base for buyers to halt the decline.
Solana capped below $75 faces downside pressure
Solana is down to $73.32 at press time on Thursday after a 2% decline the previous day. SOL maintains a bearish near-term bias, with the price well below the 50-day and 200-day EMAs at $92.28 and $96.76, respectively.
Downside momentum remains firm despite deeply oversold conditions, with the RSI at 27 and the MACD showing a negative reading but continuing to recover, hinting at fading selling pressure.
On the topside, initial resistance is seen at $77.60, followed by a more notable barrier at $87.46 ahead of the prior horizontal cap at $95.82 and the EMA cluster between the 50-day at $92.28 and 200-day at $96.76.
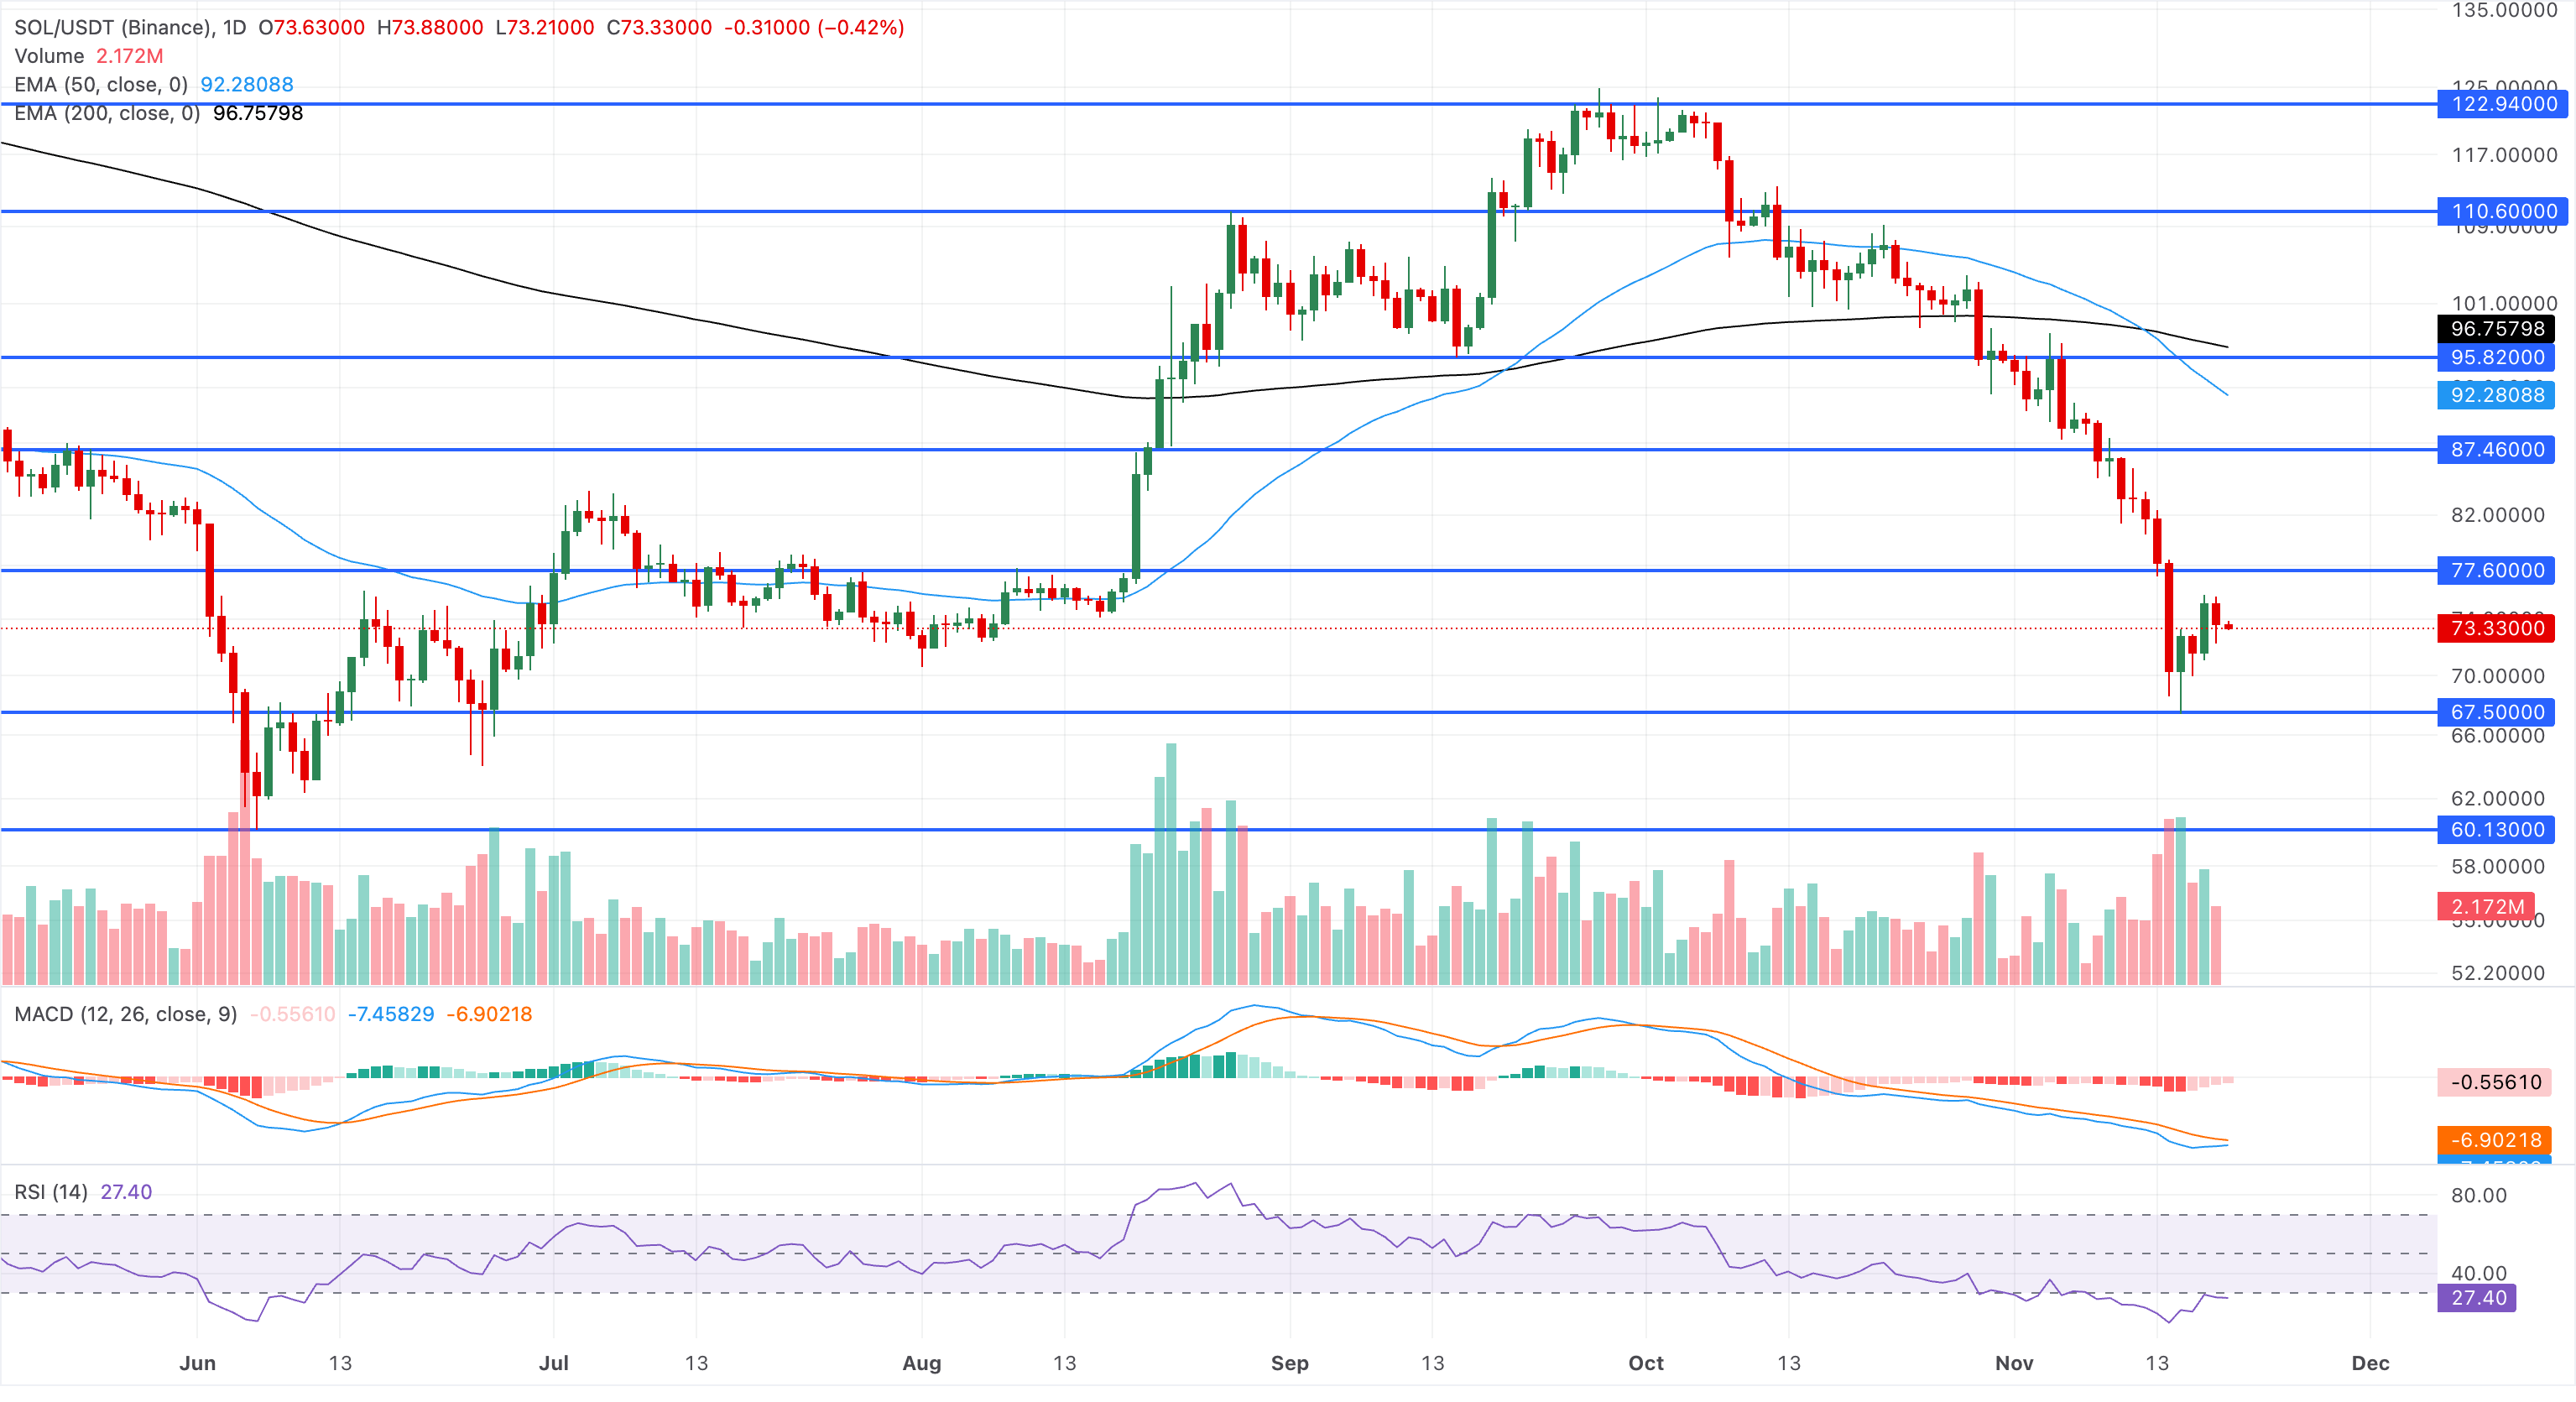
On the downside, immediate support emerges at $67.50, with a stronger structural floor near $60.13.
(The technical analysis of this story was written with the help of an AI tool. Know more.)
Bài viết đề xuất


