

Crypto Today: Ethereum, XRP hold baseline support as Bitcoin struggles to find upside strength
- Bitcoin hovers around $67,000, weighed down by risk-off sentiment as reflected by ETF outflows.
- Ethereum steadies toward the $2,000 psychological threshold despite fading institutional support.
- XRP eyes a short-term breakout above the $1.40 hurdle amid muted institutional demand and weak technicals.
The cryptocurrency market has broadly stabilised so far this week, following the turbulence that characterised price action the previous one and pushed Bitcoin (BTC) down to $60,000 on Friday.
Although volatility remains apparent, the Crypto King is trading around $67,000 at the time of writing on Thursday, weighed down by a sticky risk-off sentiment.
Altcoins, including Ethereum (ETH) and Ripple (XRP), are holding near key support levels as bulls attempt to detangle from bearish hands. Meanwhile, ETH is rising above $1,900, but remains below the $2,000 psychological threshold, underscoring a mild tailwind, while XRP eyes a short-term breakout past the immediate hurdle at $1.40.
Bitcoin, Ethereum and XRP face low institutional interest
Bitcoin outlook remains relatively dull despite its rise from Friday's dip to $60,000. A brief run above $70,000 stalled at $72,271 on Sunday, and Bitcoin now hovers around $67,000, weighed down by what appears to be low institutional interest.
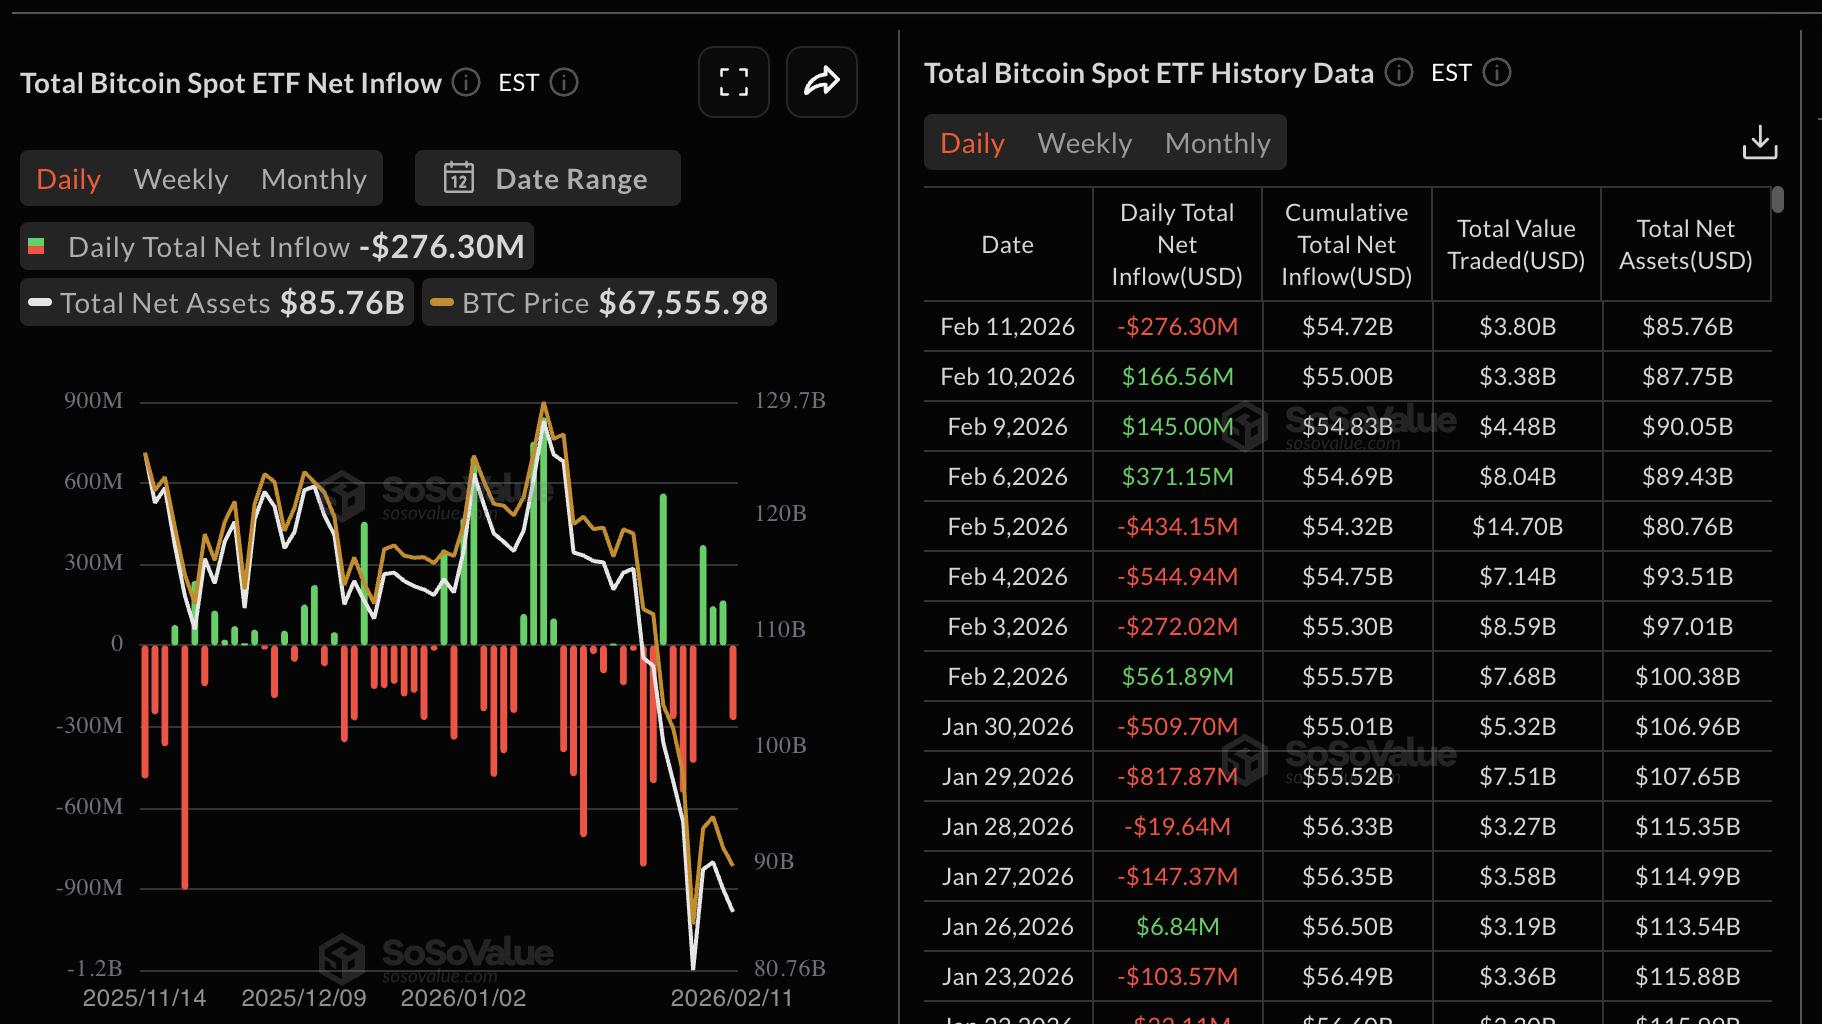
According to SoSoValue data, investors drew approximately $276 million from Bitcoin spot Exchange-Traded Funds (ETFs) on Wednesday, breaking three consecutive days of inflows. The cumulative inflow stands at $54.72 billion, and net assets at $85.76 billion.
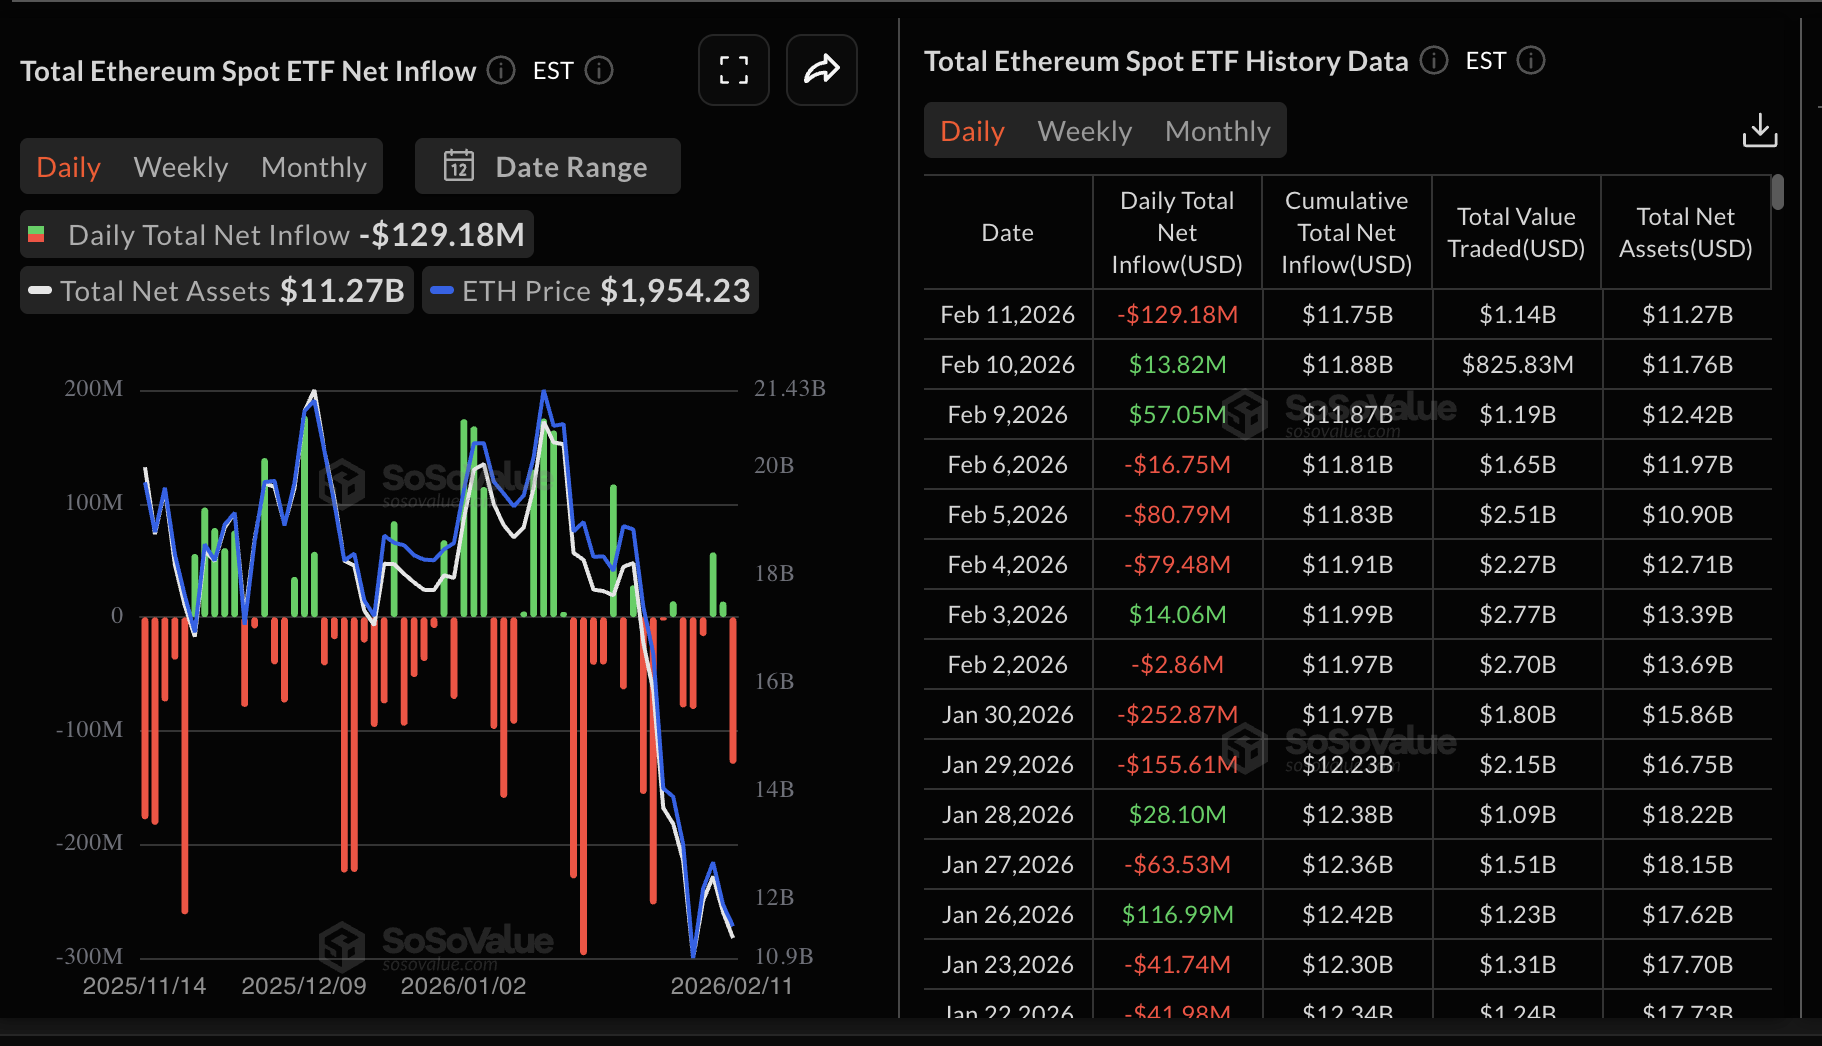
Ethereum also faces the same pressure as institutional investors rebalance their portfolios amid withdrawals from ETFs. Volatility, macroeconomic uncertainty, and shaky support for high-risk assets such as crypto led US-listed ETH spot ETFs to post $129 million in outflows on Wednesday, bringing cumulative inflows to $11.75 billion and net assets under management to $11.27 billion.
XRP spot ETFs, on the other hand, remained quiet, with zero flows on Thursday, leaving cumulative inflows at $1.23 billion and net assets under management at approximately $993 million. Before this, the ETFs had sustained a five-day streak of inflows.
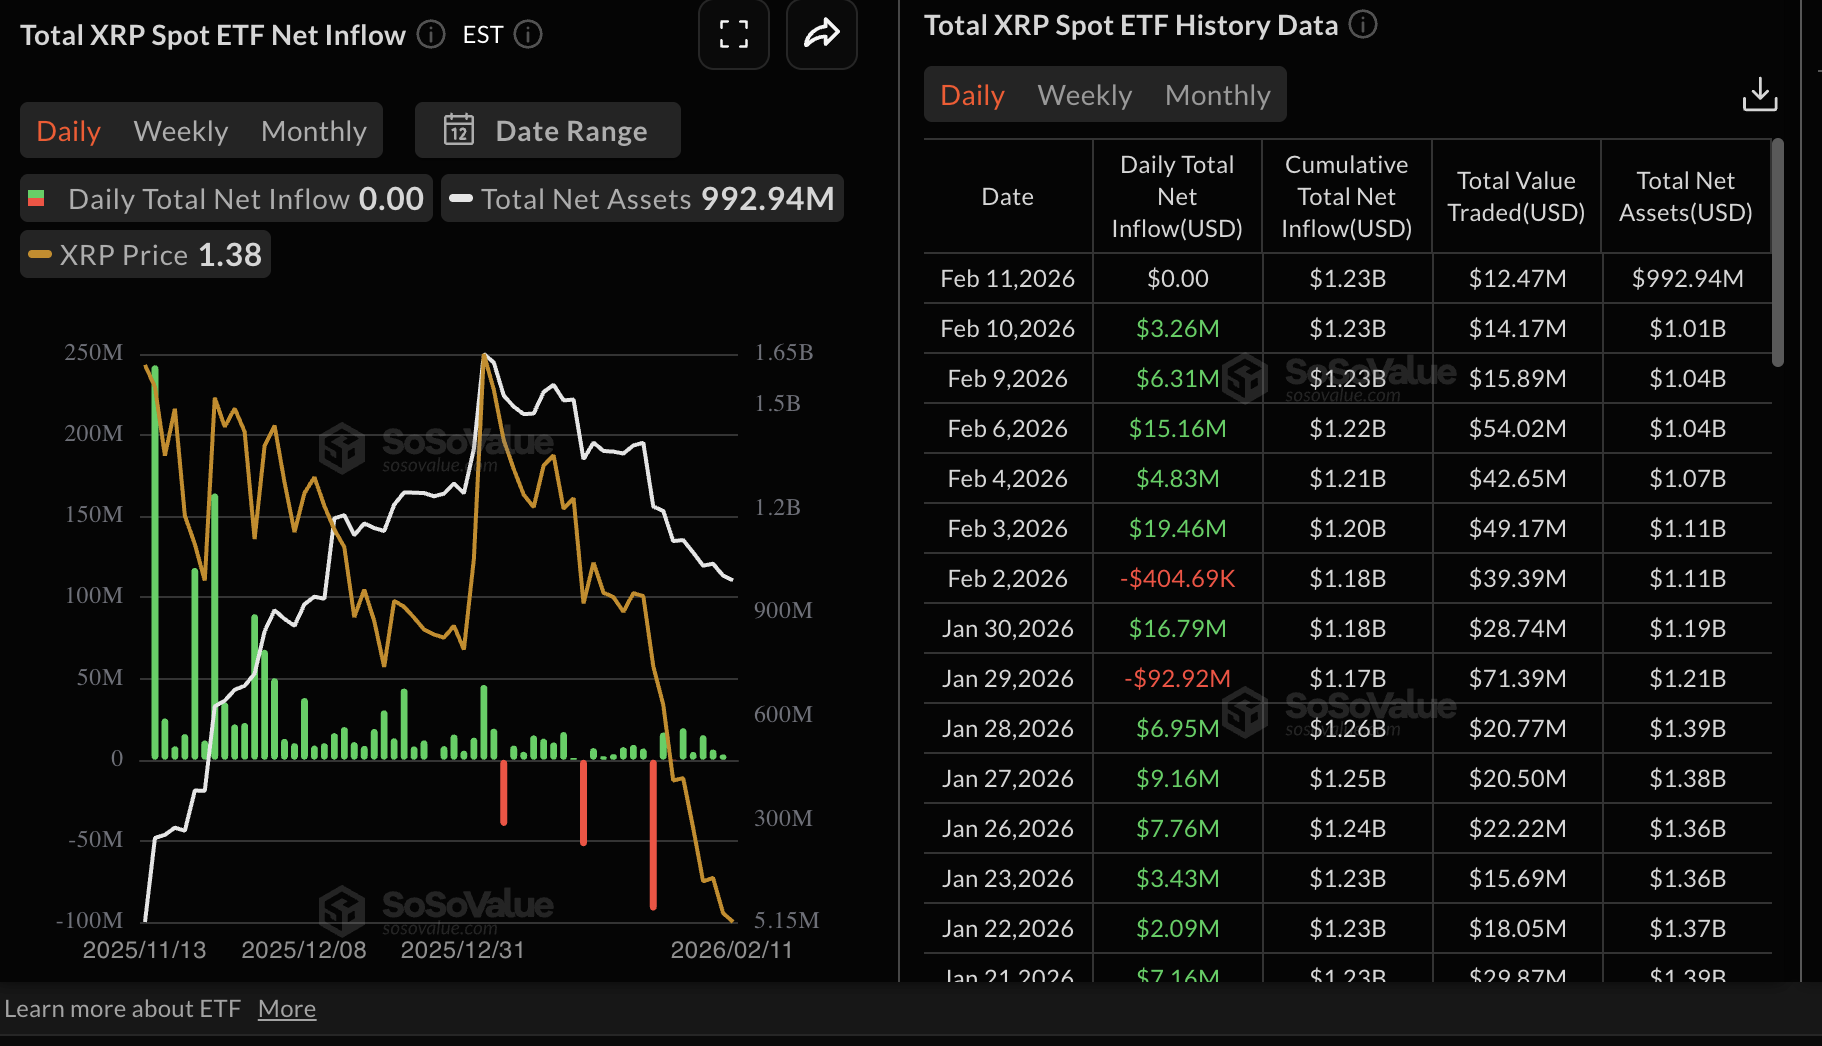
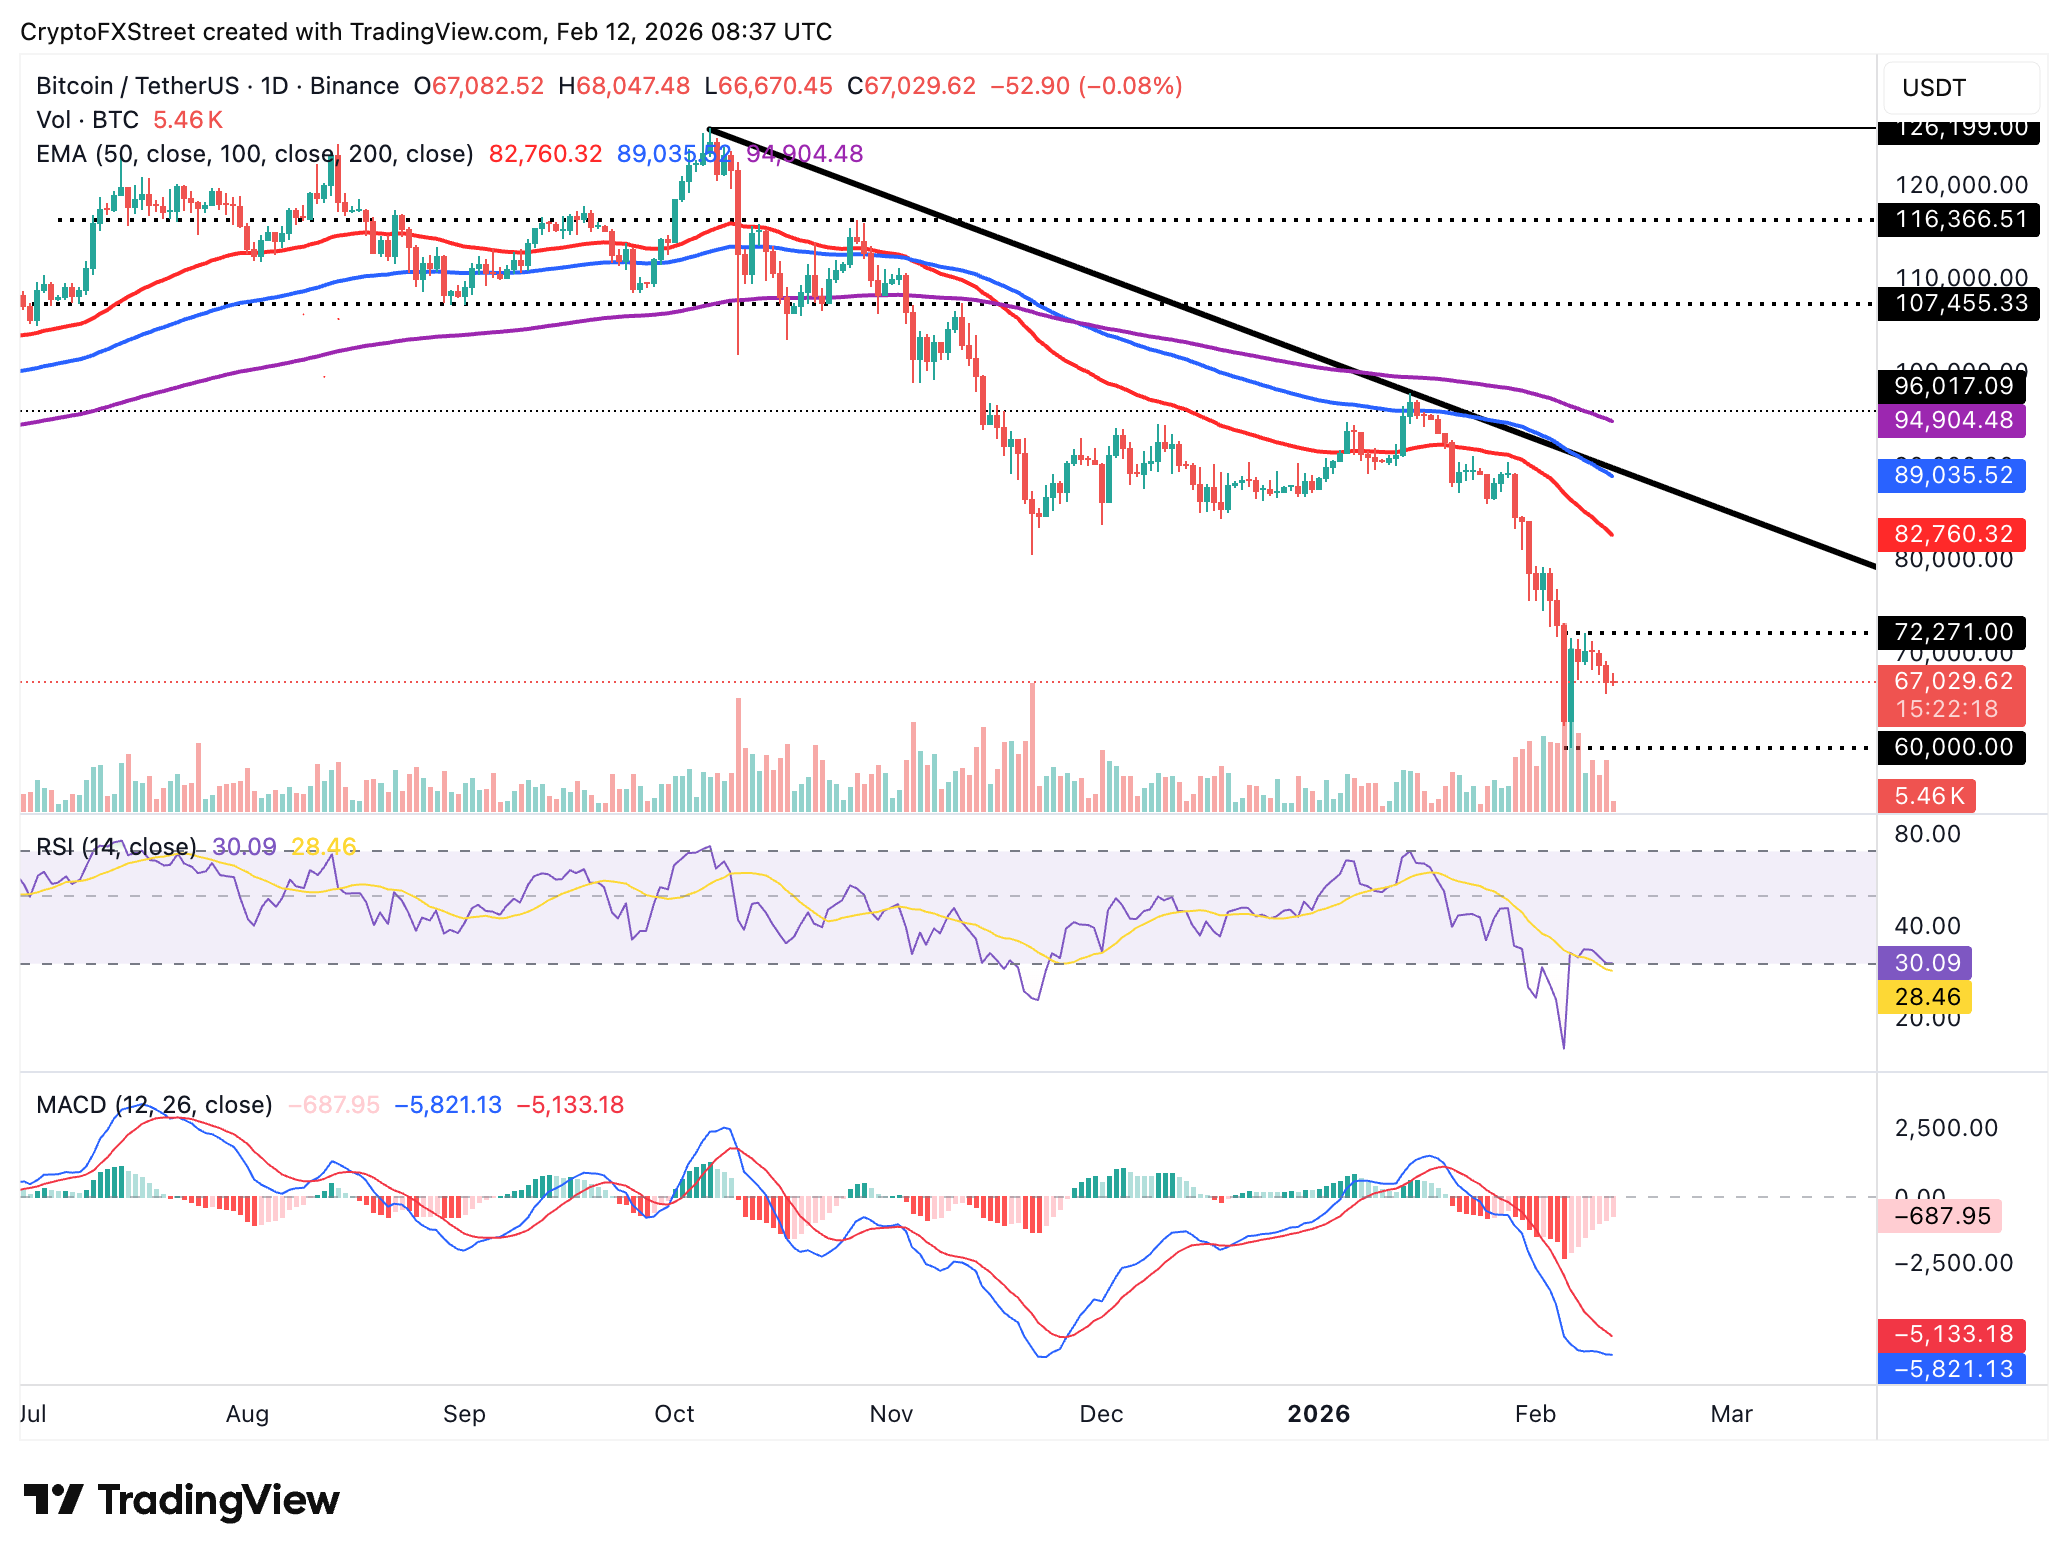
Chart of the day: Bitcoin stabilizes around key support
Bitcoin holds above $67,000 at the time of writing as bulls focus on closing the gap toward $70,000 despite a weak technical picture.
The Relative Strength Index (RSI) steadies at 30 on the daily chart after recovering from oversold conditions earlier in the week. A steady reversal toward the midline would imply that bearish pressure is easing, likely increasing the tailwind ahead of a potential upswing.
Still, the Moving Average Convergence Divergence (MACD) indicator remains below the signal line, indicating that, to some extent, bearish momentum may dampen BTC's potential recovery.
Traders should watch for the continued contraction of the red histogram bars and the MACD line rising above the signal line to confirm a gradual bullish transition. However, closing the day below $67,000 could push Bitcoin down to Wednesday's low of $65,756.
Altcoins technical outlook: Ethereum, XRP extend rebound
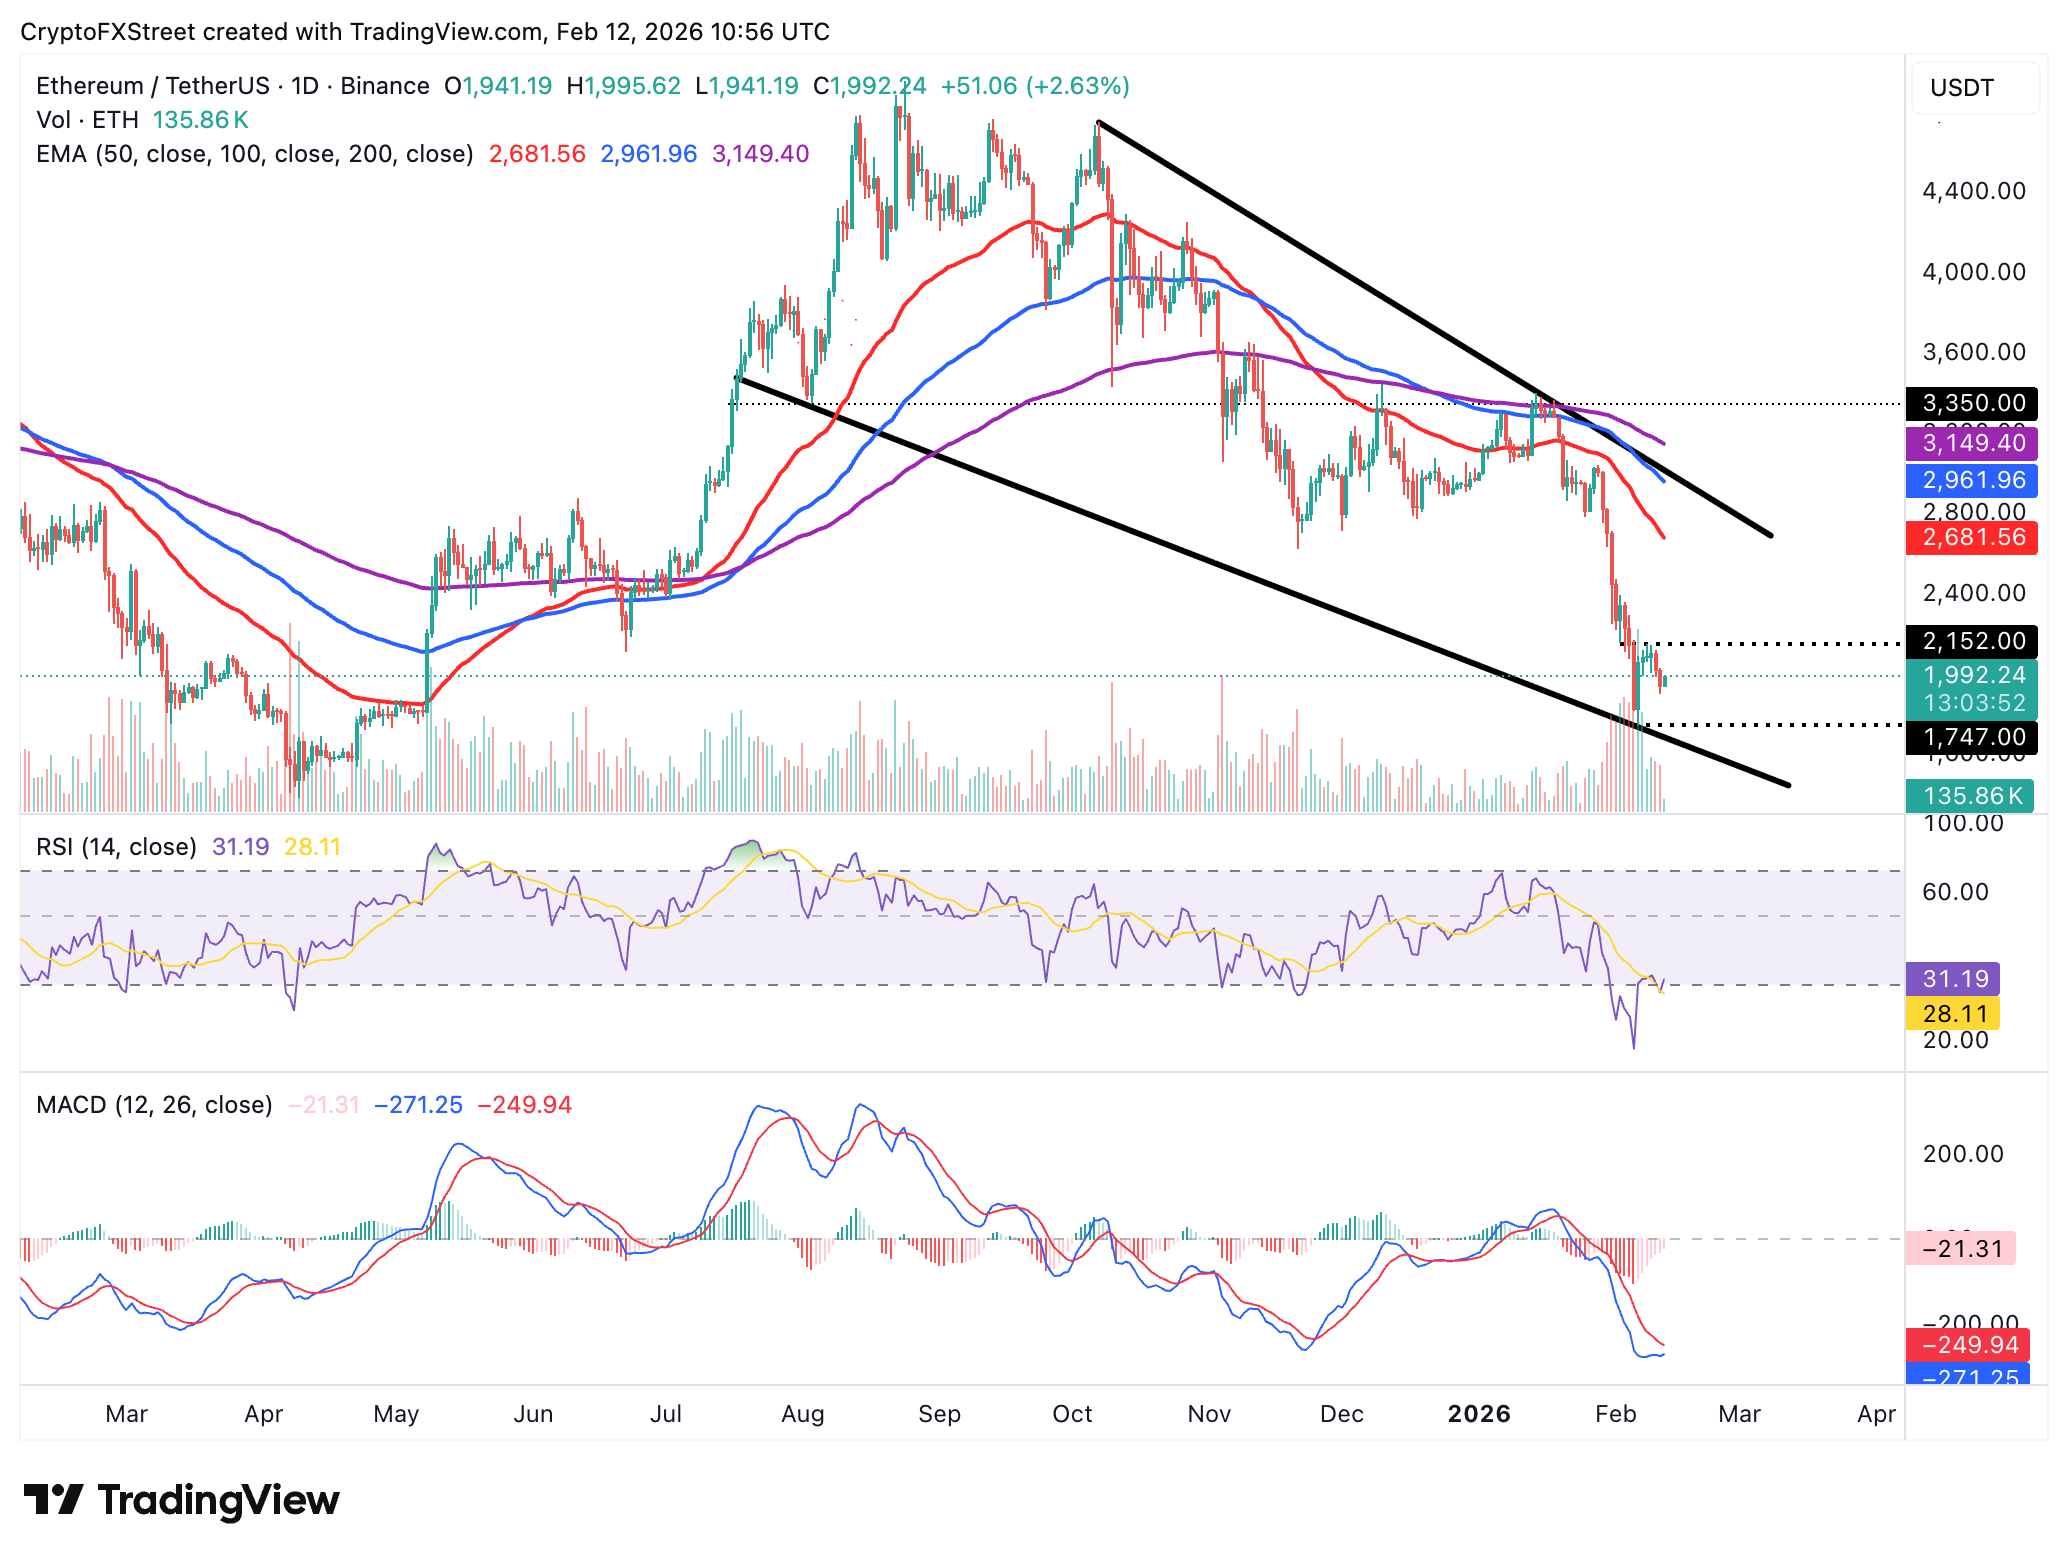
Ethereum is closing in on the $2,000 hurdle as crypto prices generally recover on Thursday. The leading smart contract token has seen the RSI rise to 31 from oversold levels on the daily chart, suggesting a reduction in bearish momentum. Extended recovery in the RSI toward the midline could affirm a short-term bullish outlook toward the February 4 high at $2,296.
A daily close above the immediate resistance at $2,000 would be required to reinforce the bullish grip. However, ETH may resume its downtrend amid the aforementioned decline in institutional interest.
The MACD indicator remains below its signal line, suggesting that Ethereum remains under bearish influence. If investors focus on the bearish outlook and reduce their risk exposure, the risk of a correction toward Friday's low at $1,747 will increase.
As for XRP, bulls are intent on taking control and accelerating price recovery above $1.40. Key technical indicators support the short-term recovery. For instance, the RSI has risen to 35 on the daily chart, supporting the ongoing reversal.
The MACD indicator line is closing the gap toward the signal line as the red histogram bars contract, suggesting that bearish momentum is easing, albeit gradually. A decisive break above the $1.40 supply zone could boost XRP toward Friday's high at $1.54.
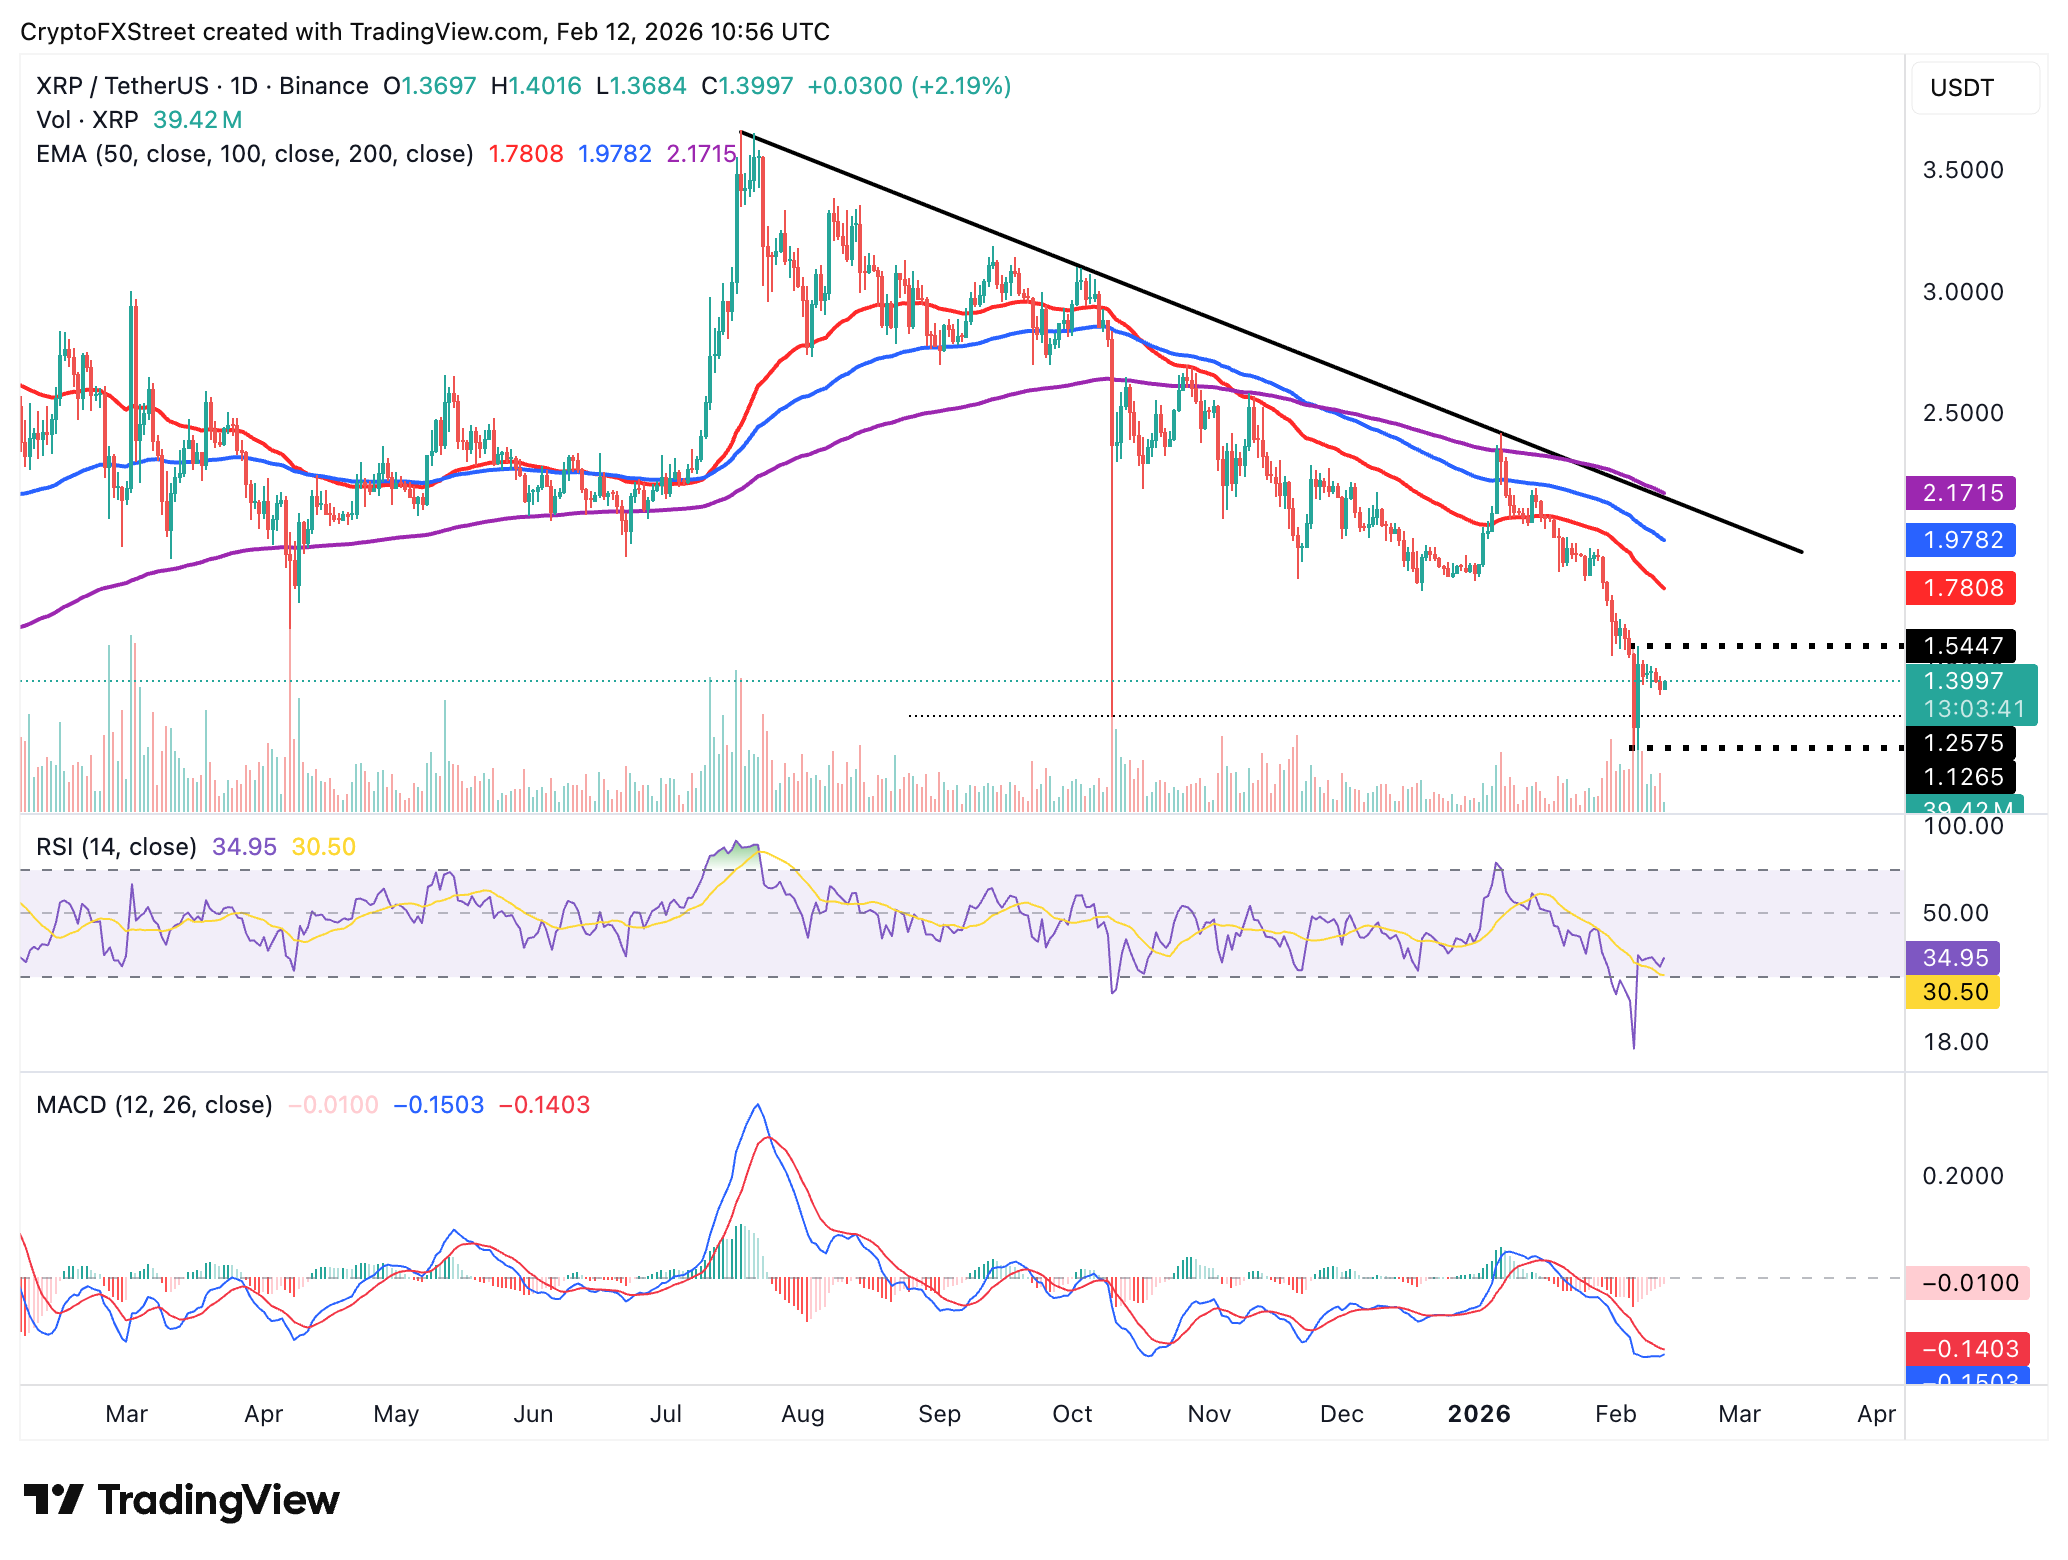
However, XRP still holds well below the 50-day Exponential Moving Average (EMA) at $1.78, the 100-day EMA at $1.98 and the 200-day EMA at $2.17. All three moving averages are sloping downward, limiting the upside and emphasizing the overall bearish trend.
Crypto ETF FAQs
An Exchange-Traded Fund (ETF) is an investment vehicle or an index that tracks the price of an underlying asset. ETFs can not only track a single asset, but a group of assets and sectors. For example, a Bitcoin ETF tracks Bitcoin’s price. ETF is a tool used by investors to gain exposure to a certain asset.
Yes. The first Bitcoin futures ETF in the US was approved by the US Securities & Exchange Commission in October 2021. A total of seven Bitcoin futures ETFs have been approved, with more than 20 still waiting for the regulator’s permission. The SEC says that the cryptocurrency industry is new and subject to manipulation, which is why it has been delaying crypto-related futures ETFs for the last few years.
Yes. The SEC approved in January 2024 the listing and trading of several Bitcoin spot Exchange-Traded Funds, opening the door to institutional capital and mainstream investors to trade the main crypto currency. The decision was hailed by the industry as a game changer.
The main advantage of crypto ETFs is the possibility of gaining exposure to a cryptocurrency without ownership, reducing the risk and cost of holding the asset. Other pros are a lower learning curve and higher security for investors since ETFs take charge of securing the underlying asset holdings. As for the main drawbacks, the main one is that as an investor you can’t have direct ownership of the asset, or, as they say in crypto, “not your keys, not your coins.” Other disadvantages are higher costs associated with holding crypto since ETFs charge fees for active management. Finally, even though investing in ETFs reduces the risk of holding an asset, price swings in the underlying cryptocurrency are likely to be reflected in the investment vehicle too.
Bài viết đề xuất


