
Curve DAO Price Forecast: CRV coils below $0.433 as whale accumulation fuels breakout hopes
- Curve DAO price struggles below key resistance on Thursday, following a breakout above the descending trendline last week.
- On-chain data suggests improving sentiment, as certain whale wallets are accumulating CRV tokens alongside rising daily active addresses.
- Technical outlook suggests upside, with a confirmed breakout targeting the $0.548 level.
Curve DAO (CRV) price is struggling to close above the key resistance at $0.433 on Thursday after a bullish breakout last week. On-chain indicators point to improving sentiment, with whale accumulation increasing alongside rising daily active addresses. If buyers can maintain momentum and confirm a breakout, CRV could extend its recovery toward the $0.548 resistance area.
CRV whales wallets buy dips
Santiment’s Supply Distribution data supports a bullish outlook for Curve DAO, as certain whales are buying CRV at recent price dips.
The metric indicates that whales holding between 10 million and 100 million CRV tokens (blue line) have accumulated a total of 33 million CRV tokens from early January to Thursday. During the same period, wallets holding between 100,000 and 1 million ADA tokens (red line) and 1 million and 10 million CRV tokens (yellow line) have shed 29 million tokens.
This shows that the second cohort of whales could have fallen prey to the capitulation event. In contrast, the first set of wallets seized the opportunity and accumulated CRV at a discount.
 [09-1767850897319-1767850897320.58.56, 08 Jan, 2026].png)
Santiment’s Daily Active Addresses index, which tracks network activity over time, also paints a bullish picture for CRV. A rise in the metric signals increased blockchain usage, while a decline in addresses indicates lower demand for the network.
In CRV’s case, Daily Active Addresses rose from 945 on December 26 to 1388 on Thursday, the highest level since October 14. This indicates that demand for Curve DAO’s blockchain usage is increasing, which bodes well for CRV’s price.
 [10-1767850987726-1767850987728.36.11, 08 Jan, 2026].png)
Curve DAO Price Forecast: CRV could extend gains if it closes above key resistance
Curve DAO price broke above the descending trendline (drawn by joining multiple highs since early August) on Friday and rose nearly 7% in the next three days. However, CRV failed to close above the weekly resistance at $0.433 and declined slightly towards the 50-day EMA at $0.413. As of Thursday, CRV is attempting to break above this weekly resistance level.
If CRV closes above the weekly level at $0.433 on a daily basis, it could extend the rally toward the November 10 high of $0.548, which coincides with the 200-day EMA.
The Relative Strength Index (RSI) on the daily chart reads 59, above the neutral level of 50, indicating bullish momentum is gaining traction. In addition, the Moving Average Convergence Divergence (MACD) indicator shows a bullish crossover and rising green histogram bars above the neutral level, further supporting the bullish outlook.
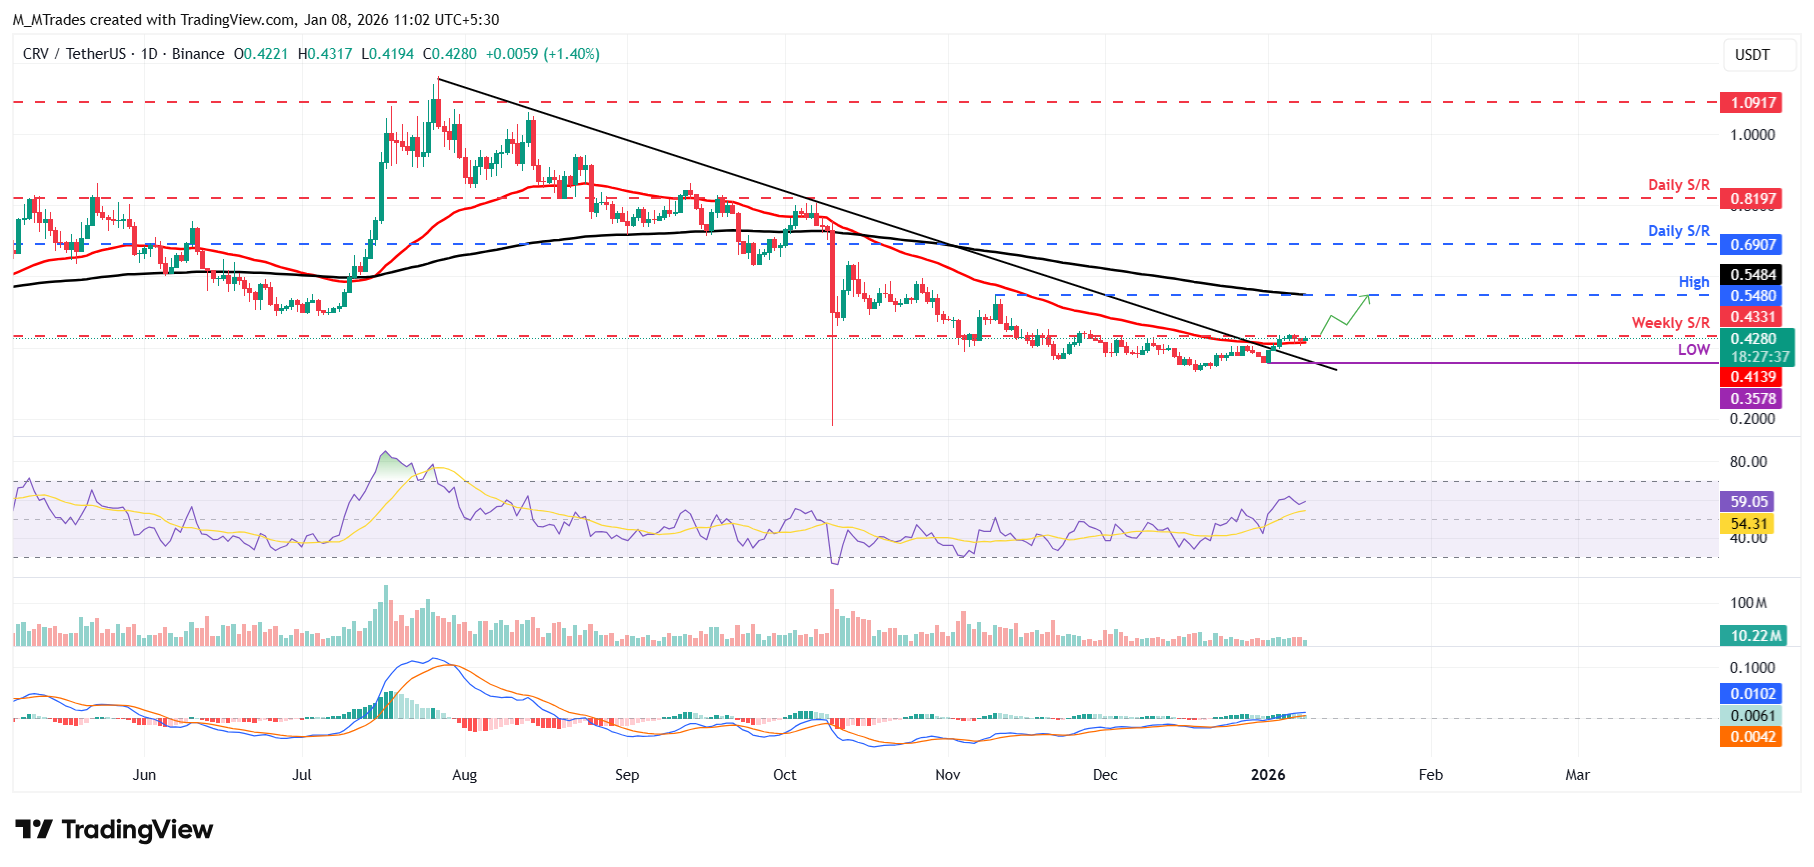
However, if CRV closes below the 50-day EMA at $0.413 on a daily basis, it could extend the decline toward the January 1 low of $0.357.
Bài viết đề xuất


