
Quant Price Forecast: QNT eyes breakout rally as whales expand holdings
- Quant gains 11% on Thursday, approaching the resistance of a consolidation range.
- Derivatives data reveal an increase in buy-side activity, suggesting a resurgence in risk-on sentiment.
- Large wallet investors expand holdings by nearly 2% of the on-chain supply, suggesting increased demand.
Quant (QNT) price is up 11% by press time on Thursday, advancing towards the upper band of a consolidation range. The short-term recovery aligns with a surge in demand from large wallet investors, known as whales, and a risk-on shift among derivatives traders.
The technical outlook remains optimistic for Quant as the Moving Average Convergence Divergence (MACD) momentum indicator triggers a buy signal.
Whale interest, positive shift in QNT derivatives flash bullish potential
A spike in interest of large wallet investors, or whales, for any cryptocurrency generally follows a price surge, as smart money is known to enter before a rally. Santiment data shows that investors with 10,000 to 1 million QNT tokens now hold 57.83% of the on-chain supply, up from 56.98% as of October 1. This indicates an inflow of 130,000 QNT, advancing the holding to 8.61 million, from 8.48 million in the same time.
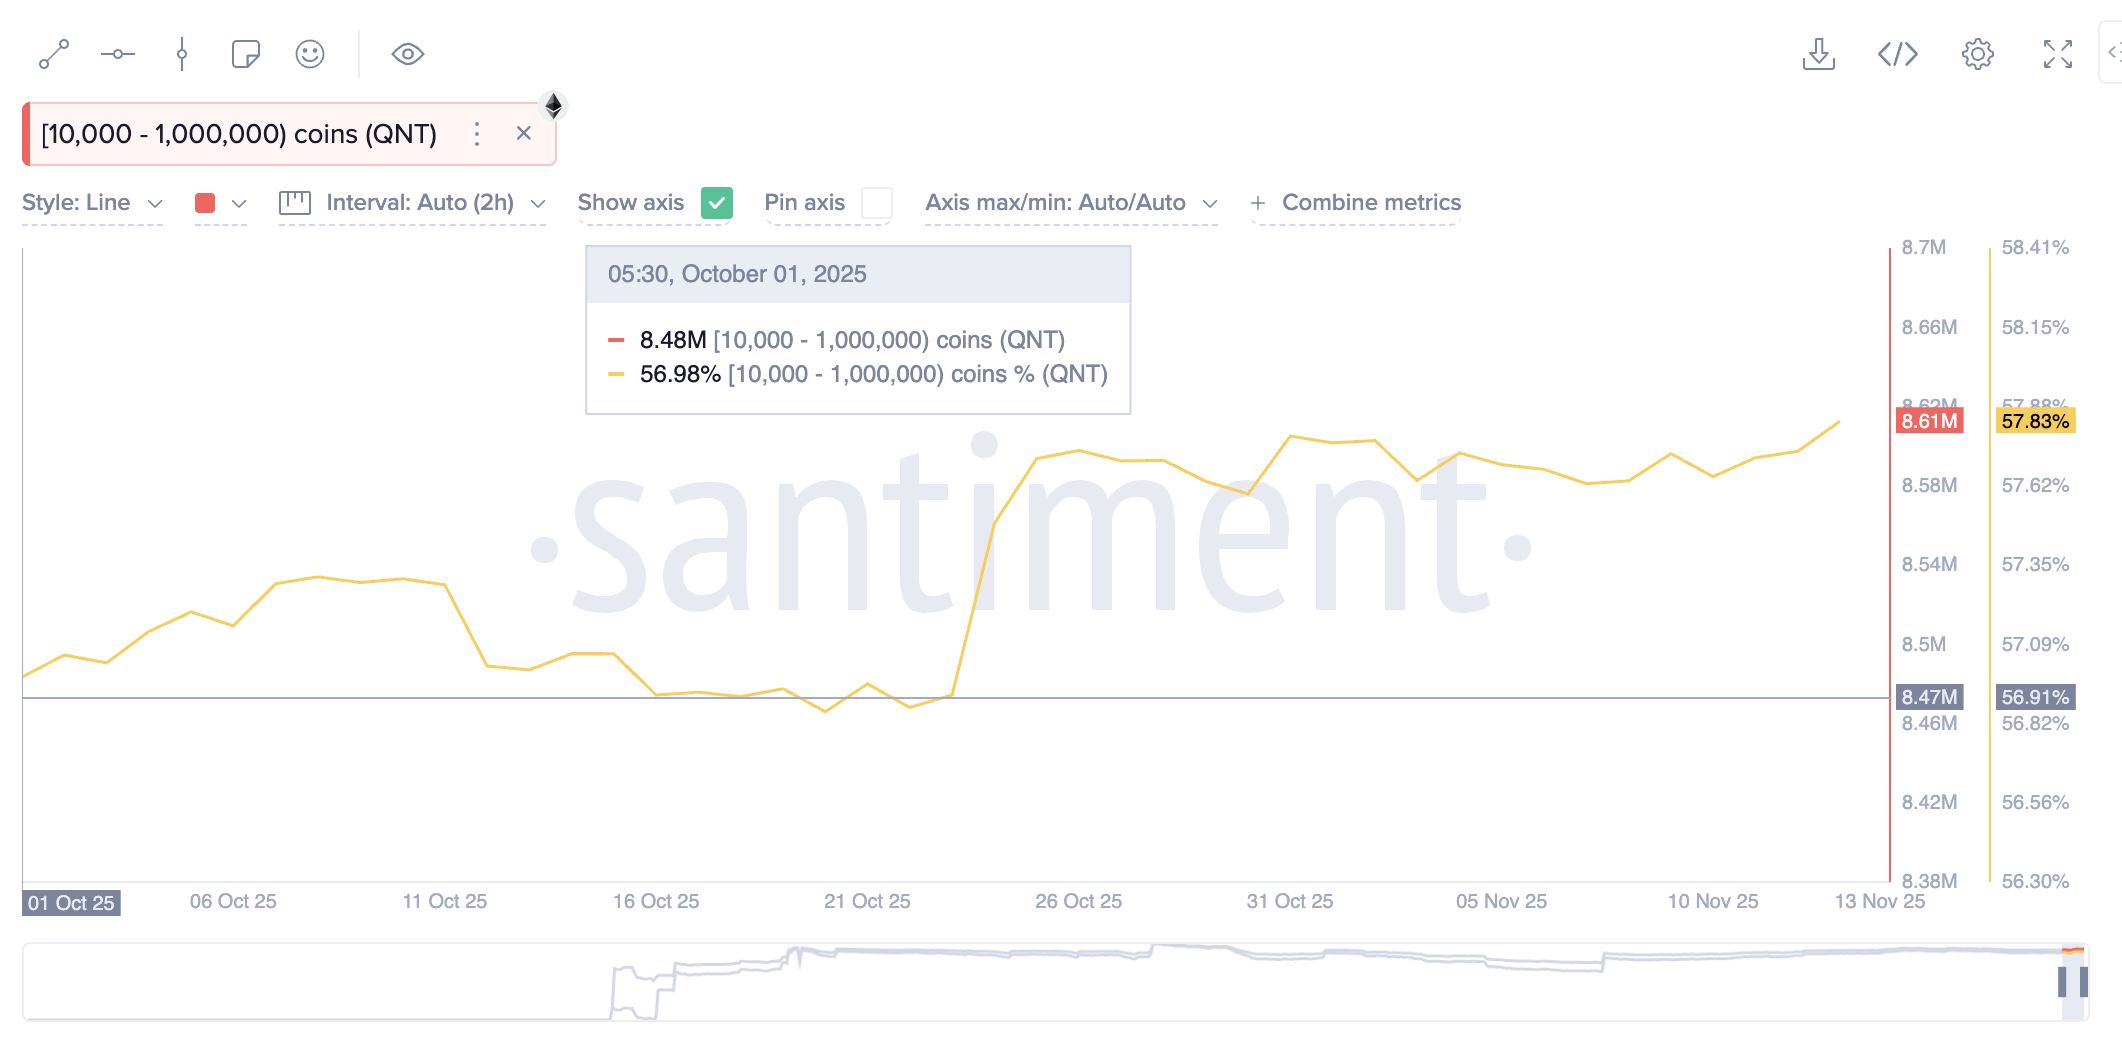
With the rising confidence of whales, the surge in demand for QNT is likely to follow the retail segment.
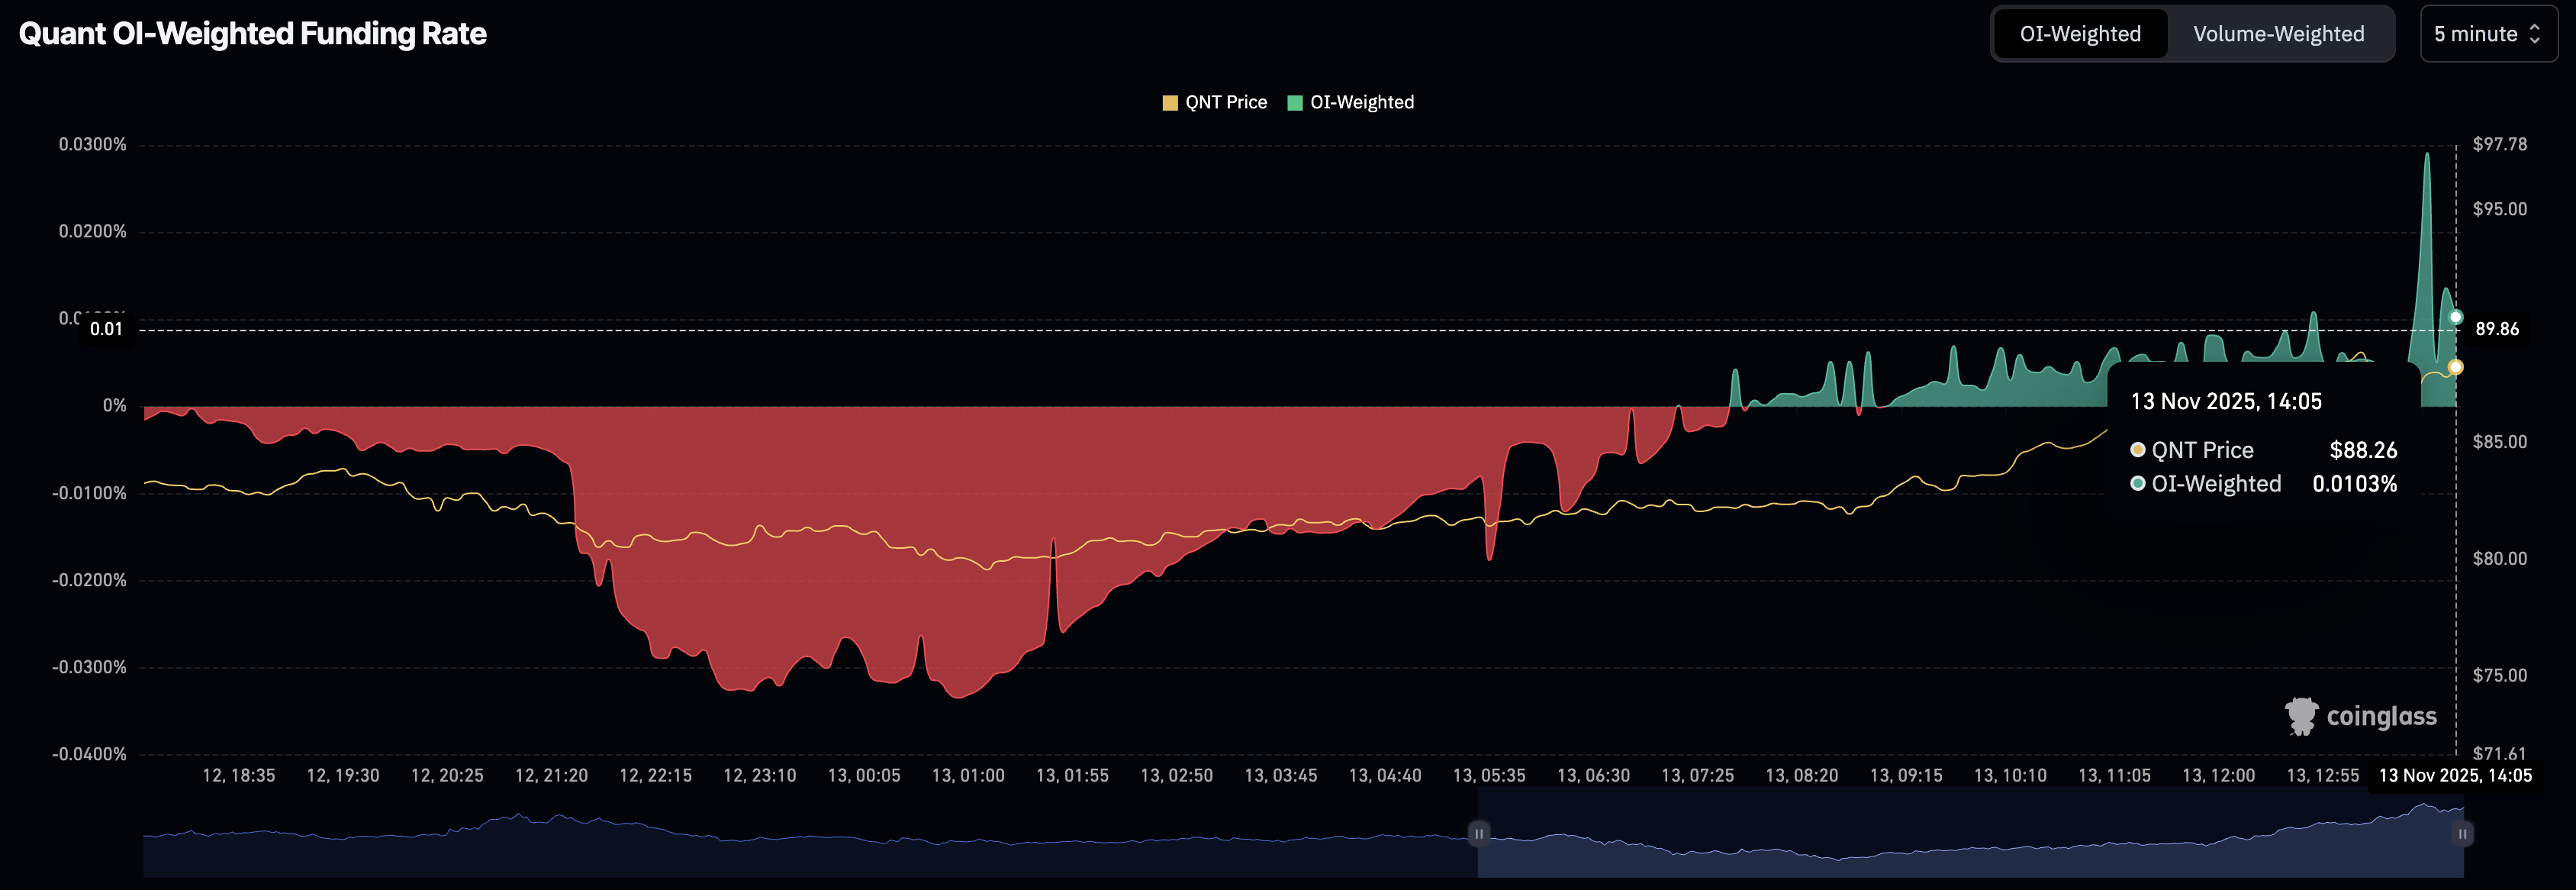
Corroborating the shift in retail sentiment, derivatives data indicate a rise in traders acquiring long positions. The Open Interest (OI)-weighted funding rate from CoinGlass tracks the aggregate funding rates across exchanges to identify crowded trades. Typically, positive rates indicate bulls are paying a premium to bears to negate the leverage-caused imbalance between swap and spot prices, and vice versa.
In Quant’s case, the OI-weighted funding rate stands at 0.0103%, largely bullish despite a dip from 0.0291% earlier in the day.
Quant aims for $100 as bulls gain traction
Quant roughly trades at $90.00 on Thursday, exceeding the $89.55 ceiling of a consolidation range formed on the 4-hour chart, with the base at $80.15 marked by Friday's low. A decisive close above this level could confirm the upside breakout of the range, unleashing the trapped momentum to the full extent.
Amid the short-term recovery, the Moving Average Convergence Divergence (MACD) crosses above the signal line on the 4-hour chart, flashing a buying opportunity as buying pressure resurfaces. Furthermore, the blue and red lines rise above the zero line, indicating a strong bullish trend.
At the same time, the Relative Strength Index (RSI) reaches 65 on the same chart, progressing towards the overbought zone as bullish candles emerge in the lookback, signalling a rise in bullish momentum.
If the potential range breakout exceeds the $94.71 high from October 13, QNT could target the $100 psychological level, followed by the previous month’s high at $110.50.
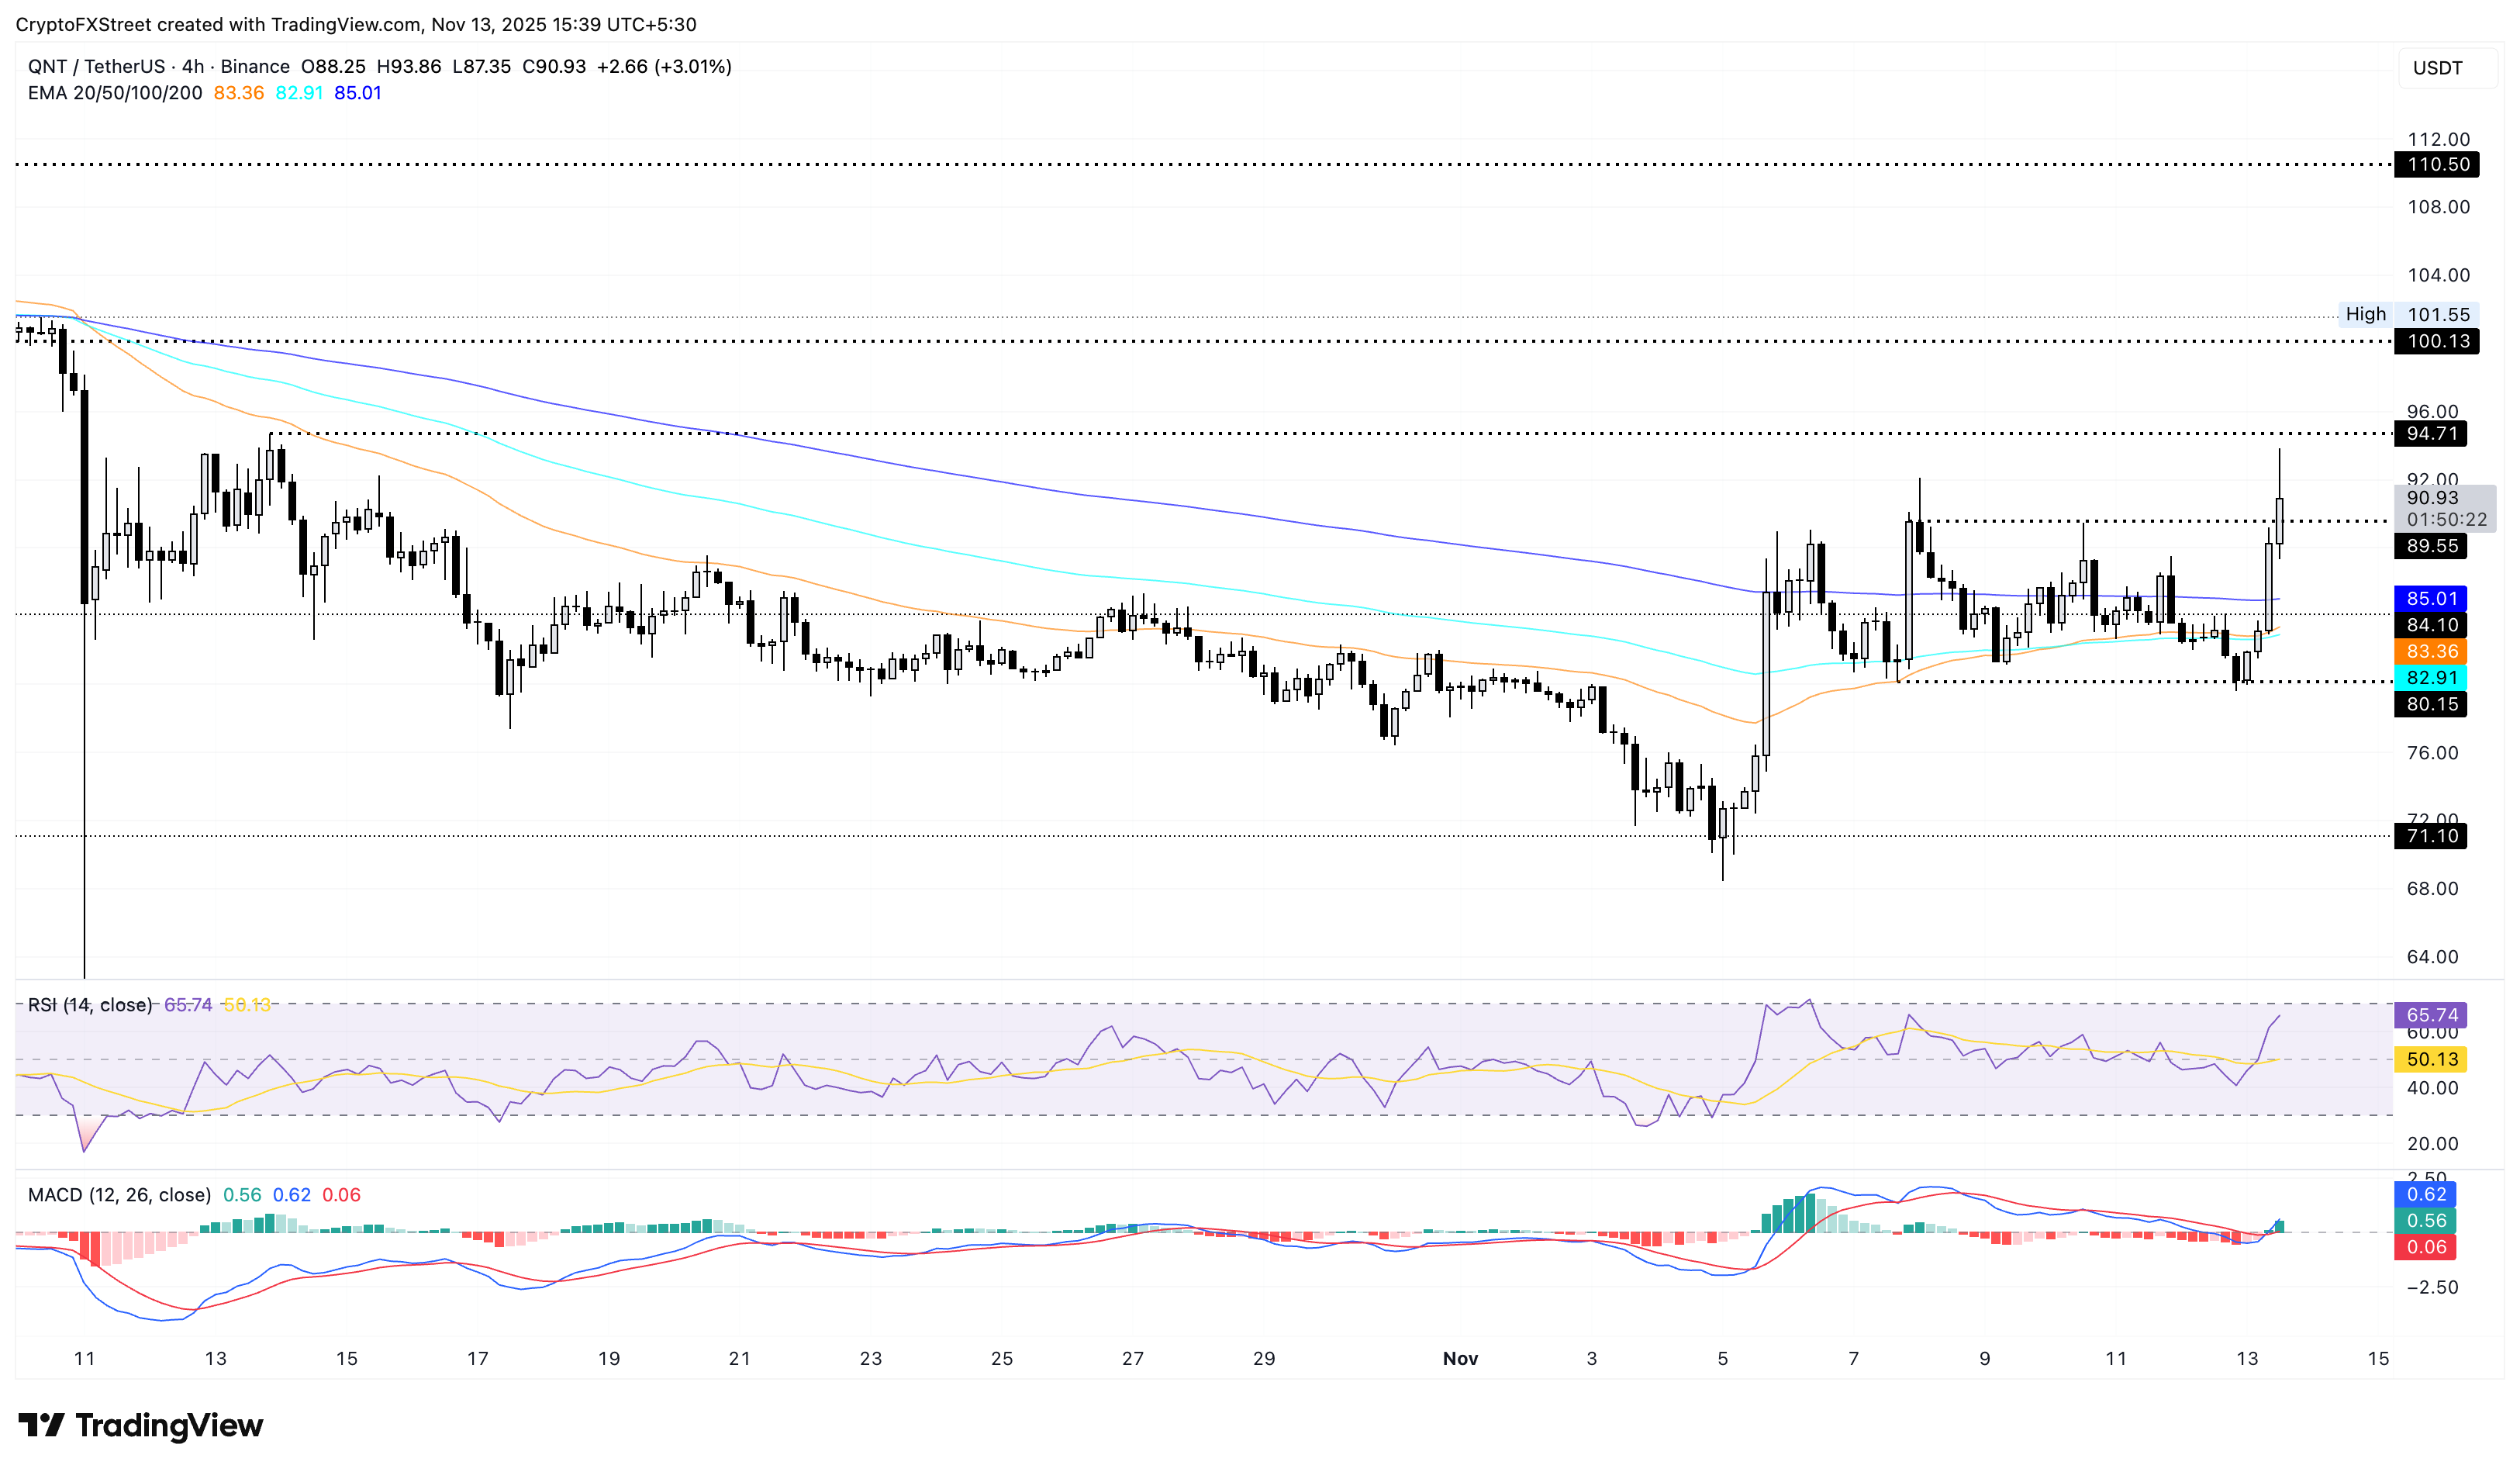
However, a pullback under the $89.55 level could result in a retest of the 200-period Exponential Moving Average (EMA) at $85.01.
Bài viết đề xuất


