
Crypto Today: Bitcoin, Ethereum, XRP hold steady as ETF inflows resume
- Bitcoin holds above $101,000 on Friday amid the resumption of ETF inflows.
- Ethereum remains above $3,300, supported by stable retail demand and signs of institutional interest returning.
- XRP defends the $2.18 support, but a Death Cross pattern highlights a weakening technical structure.
Bitcoin (BTC) holds above $101,000 at the time of writing on Friday amid improving sentiment in the broader cryptocurrency market as institutional demand returns. Meanwhile, altcoins, including Ethereum (ETH) and Ripple (XRP), are stabilizing above short-term support levels.
Data spotlight: Bitcoin, ETH stable as institutional and retail demand returns
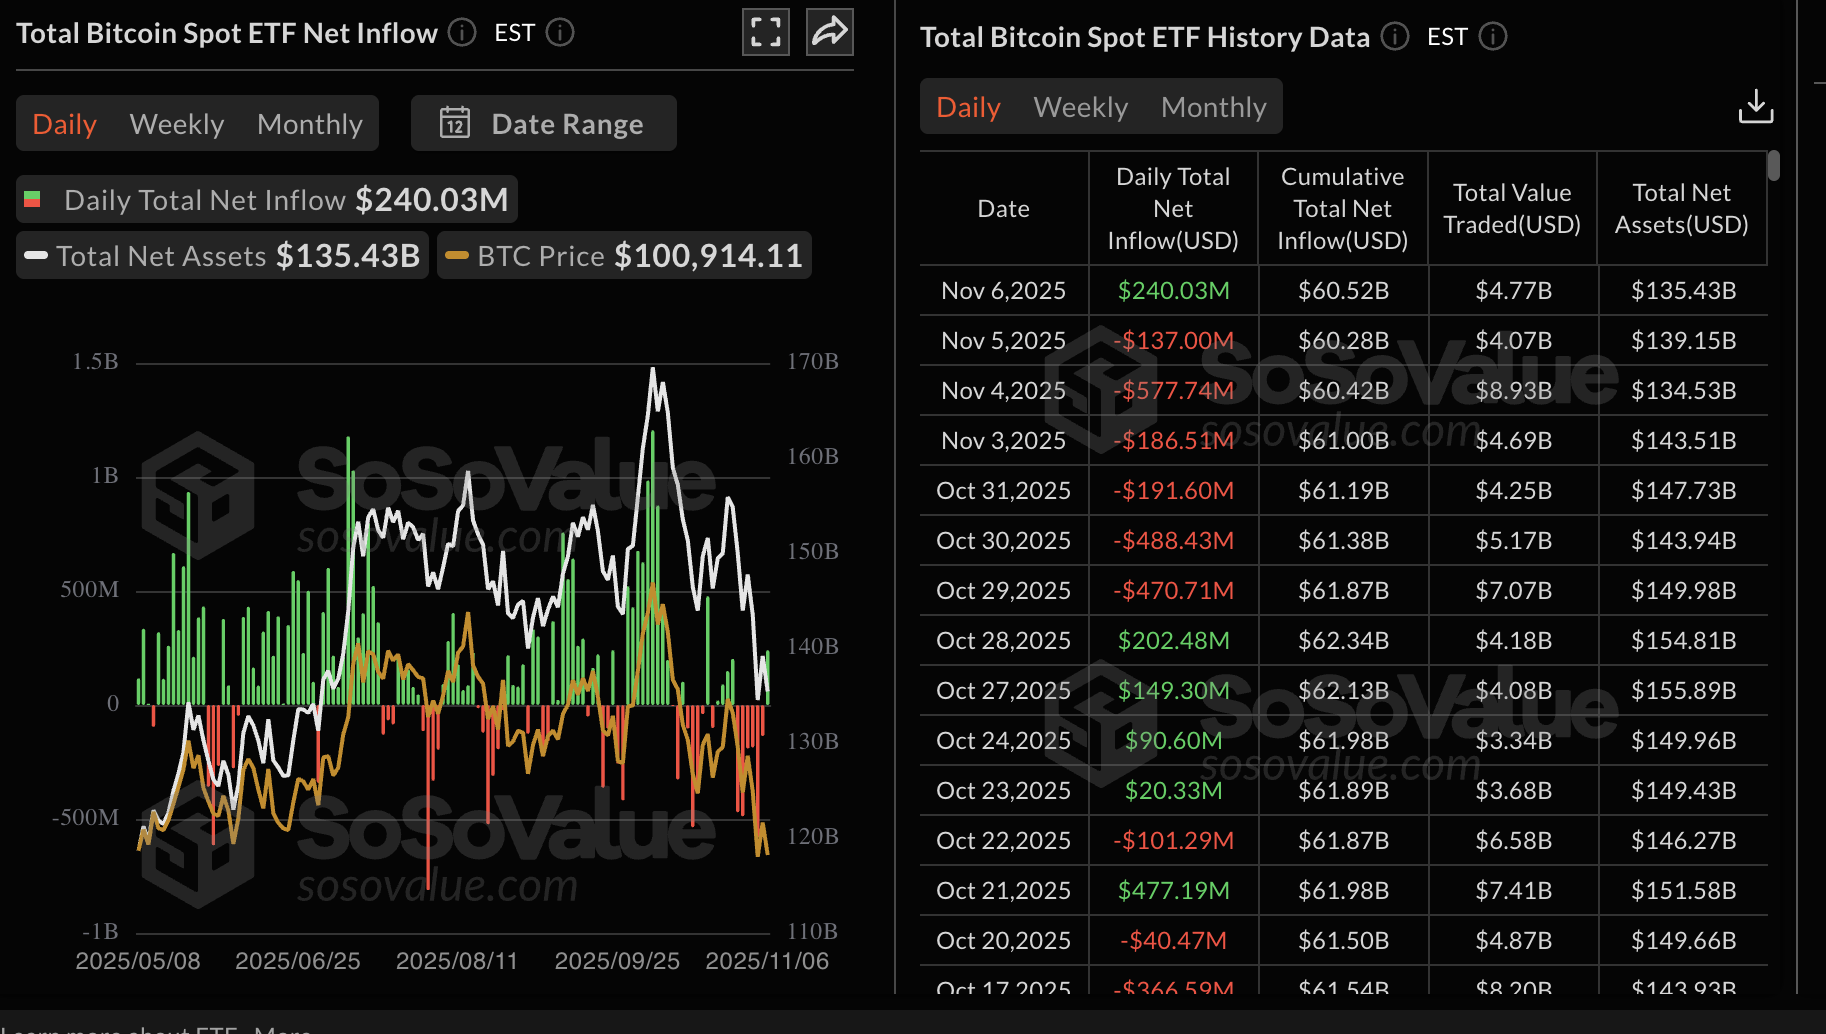
Bitcoin Exchange Traded Funds (ETFs) have resumed inflows after six consecutive days of outflows. According to SoSoValue data, US-listed BTC spot ETFs recorded approximately $240 million in inflows on Thursday, bringing the cumulative total to $60.52 billion and net assets to $135.43 billion.
BlackRock’s IBIT led with a net inflow slightly above $112 million, followed by Fidelity’s FBTC with nearly $62 million and 21Shares’ ARKB with approximately $60 million.
The resumption of ETF inflows is a major signal for improving sentiment in the crypto market. It is crucial to monitor the performance of BTC ETFs over the coming days to gauge whether institutional interest is increasing.
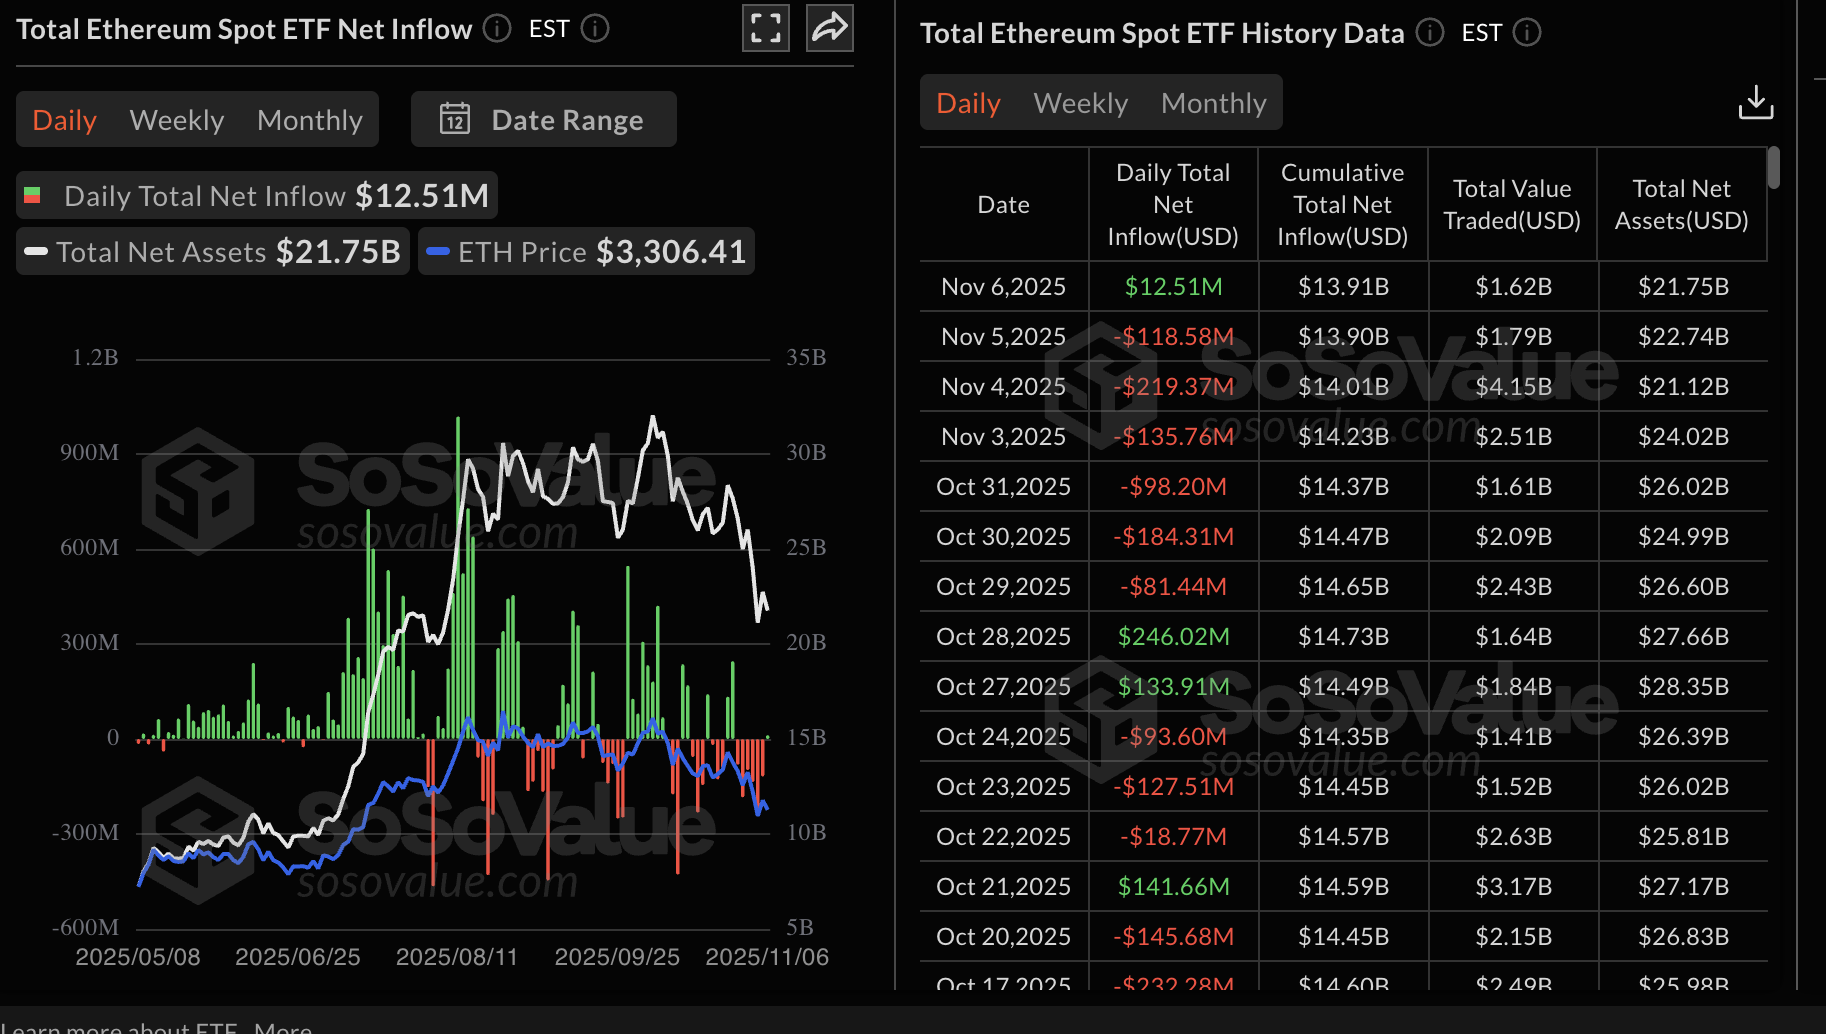
Ethereum also experienced a minor ETF inflow of approximately $12.5 million, bringing the total net inflow volume to $13.91 billion and net assets to $21.75 million.
Three of the nine US-listed ETFs recorded inflows, with one ETF (Grayscale’s ETHE) experiencing net outflows of $3.53 million. The rest of the ETFs neither experienced inflows nor outflows.
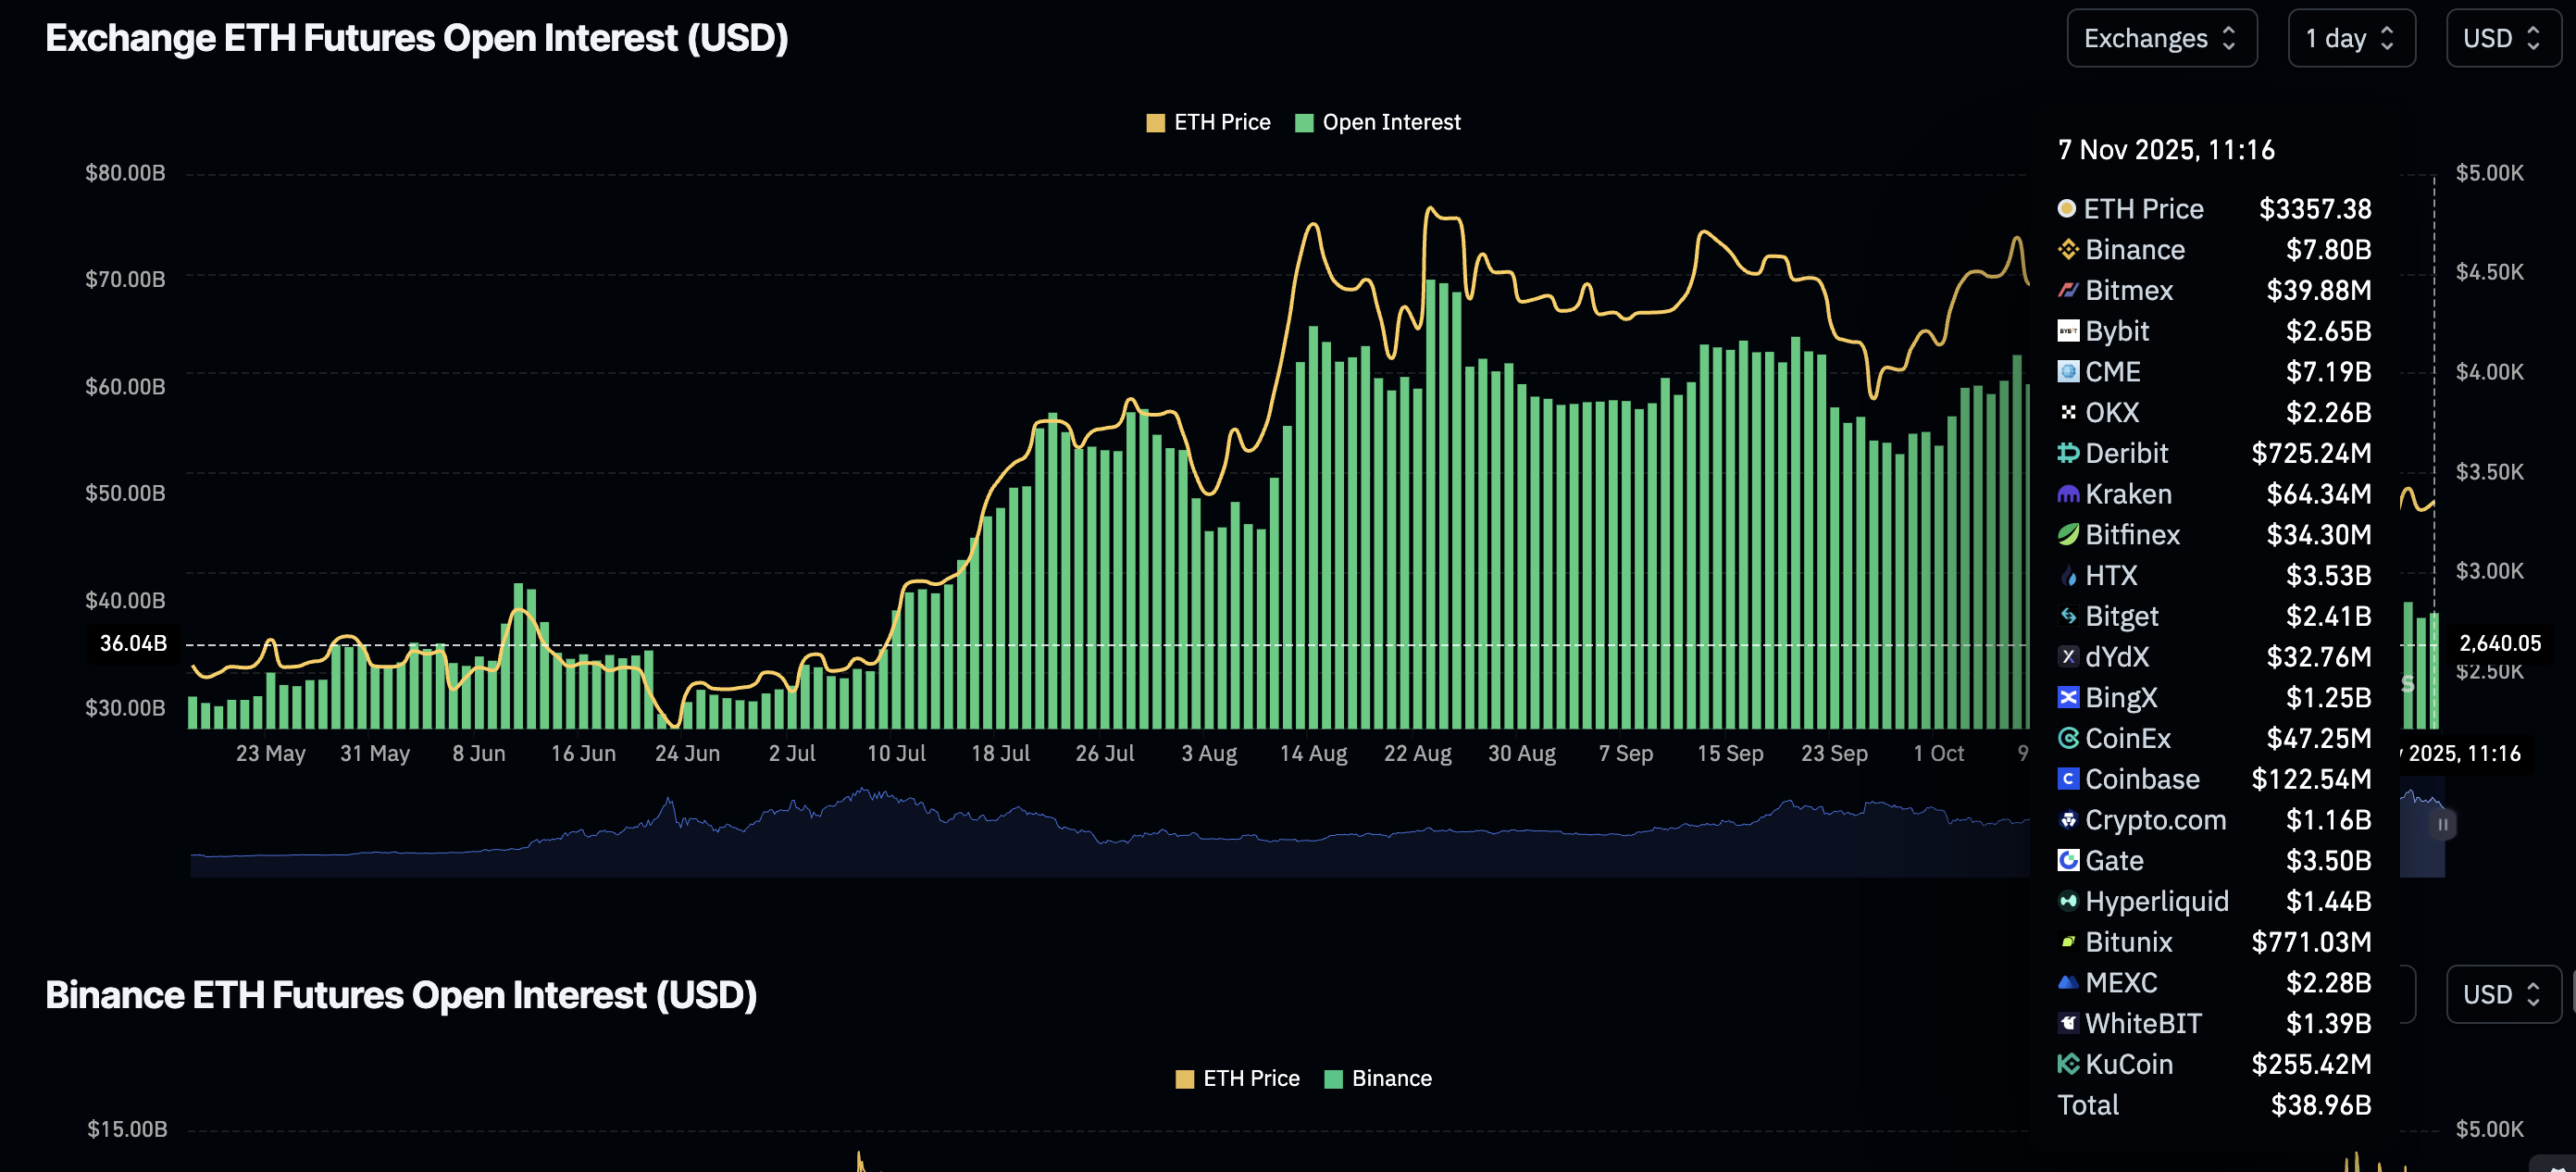
Retail demand for Ethereum has stabilized, with futures Open Interest (OI) averaging $38.96 billion on Thursday, up from $38.1 billion the previous day. Such stability is required to improve investor confidence, following a prolonged risk-off sentiment since the October 10 deleveraging event. Furthermore, a steady increase in the OI would indicate that investors are ready to return and increase their risk exposure.
Meanwhile, retail demand for XRP remains significantly suppressed, with the futures OI holding at $3.37 billion on Thursday, down from $3.54 billion the previous day. The OI has decreased by 69% from its $10.94 billion peak in mid-July after the XRP price reached an all-time high of $3.66. Investors are not convinced that XRP can turn around and sustain a recovery in the short term.
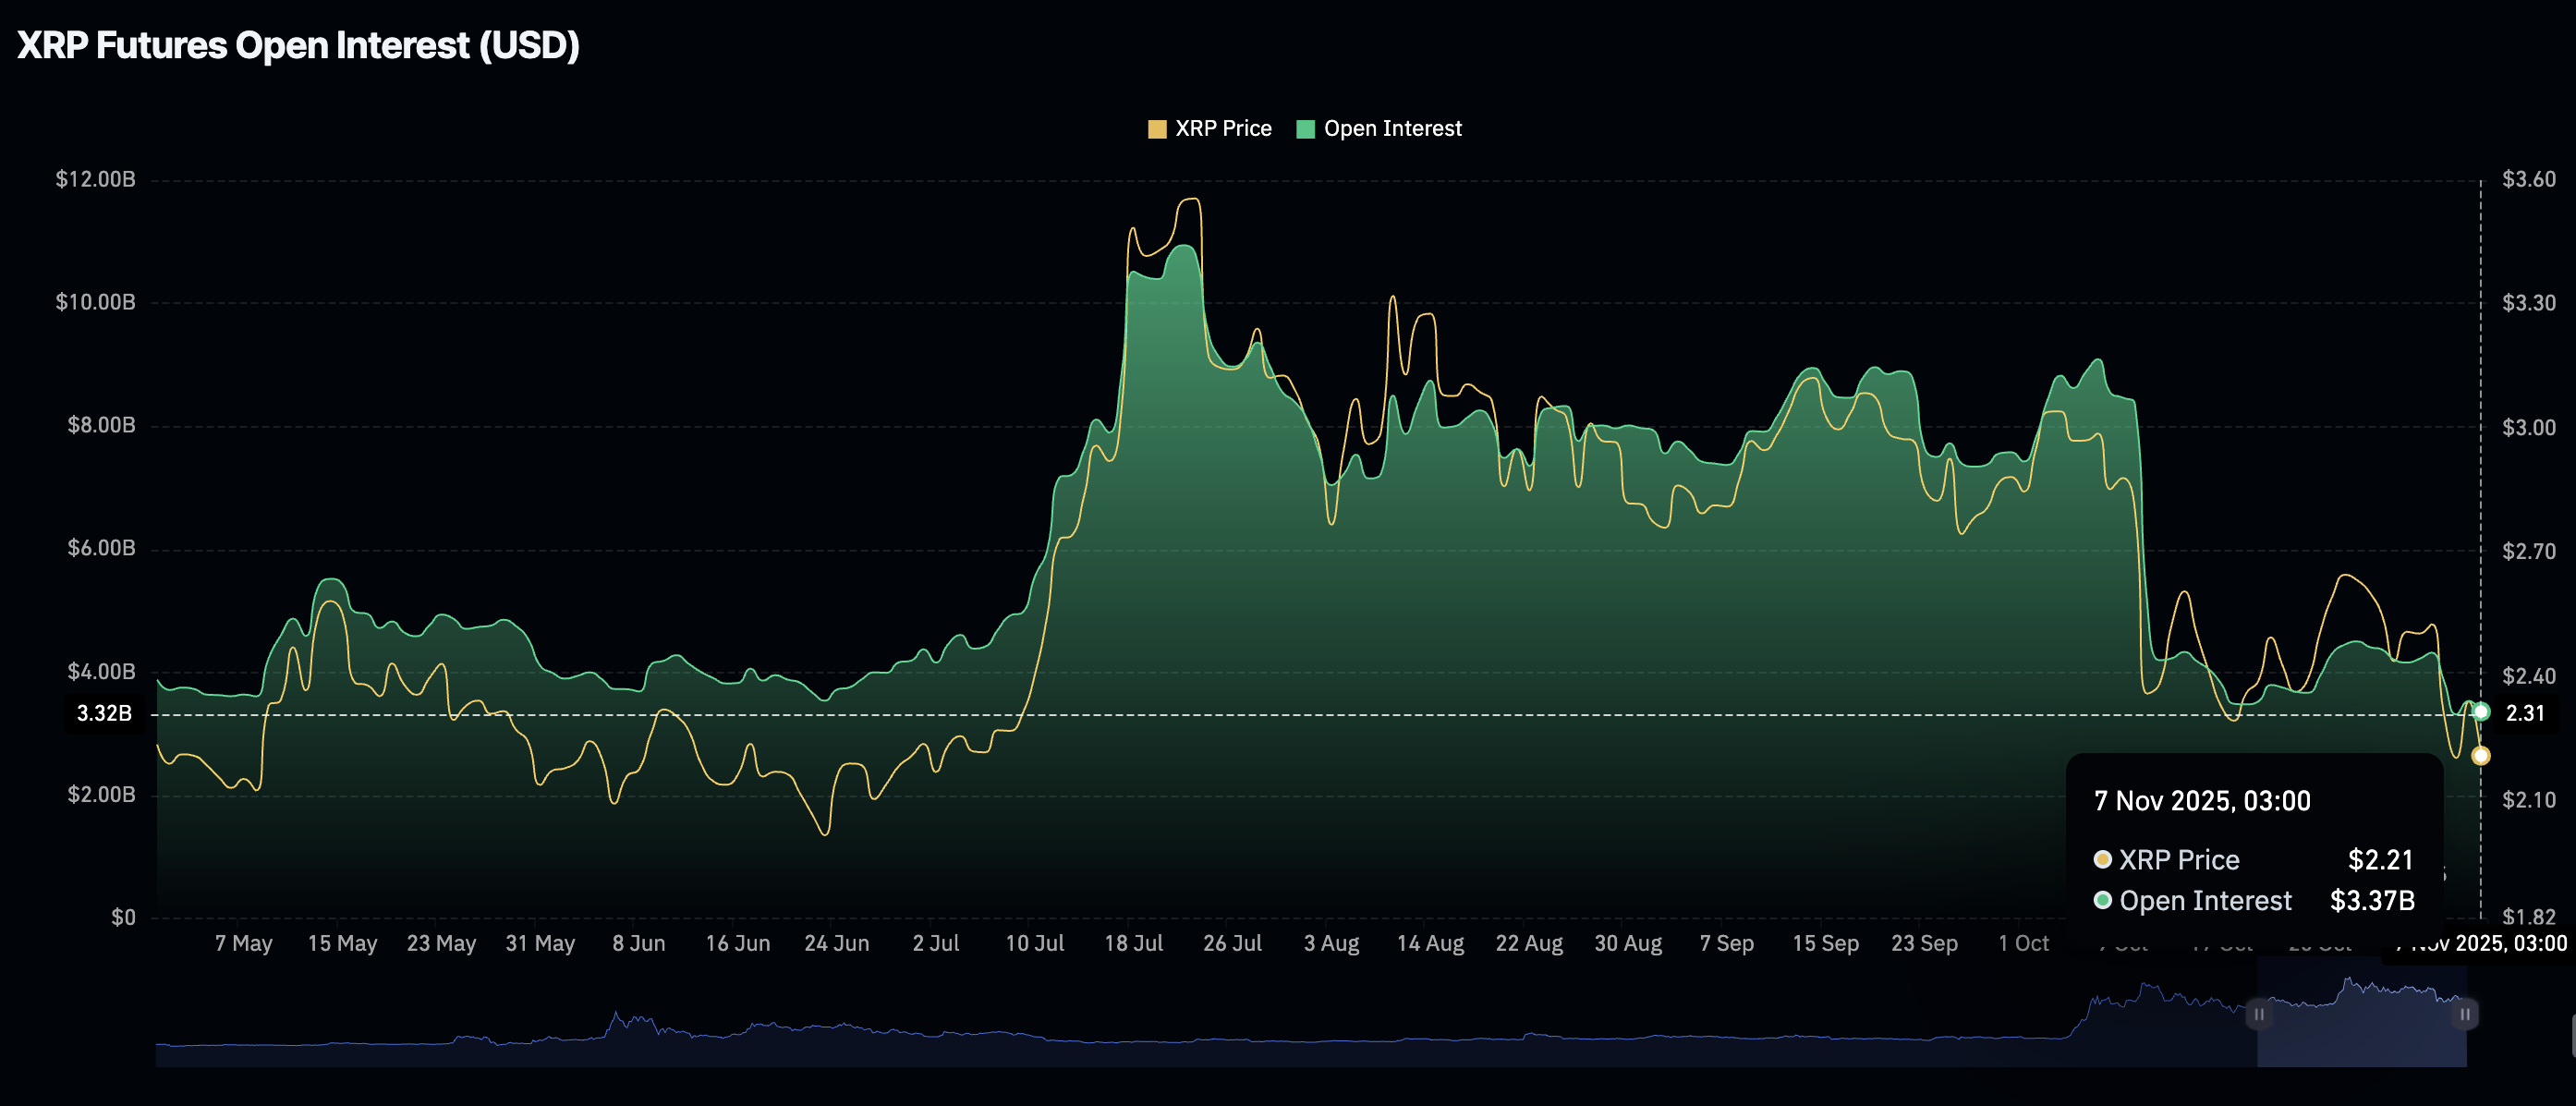
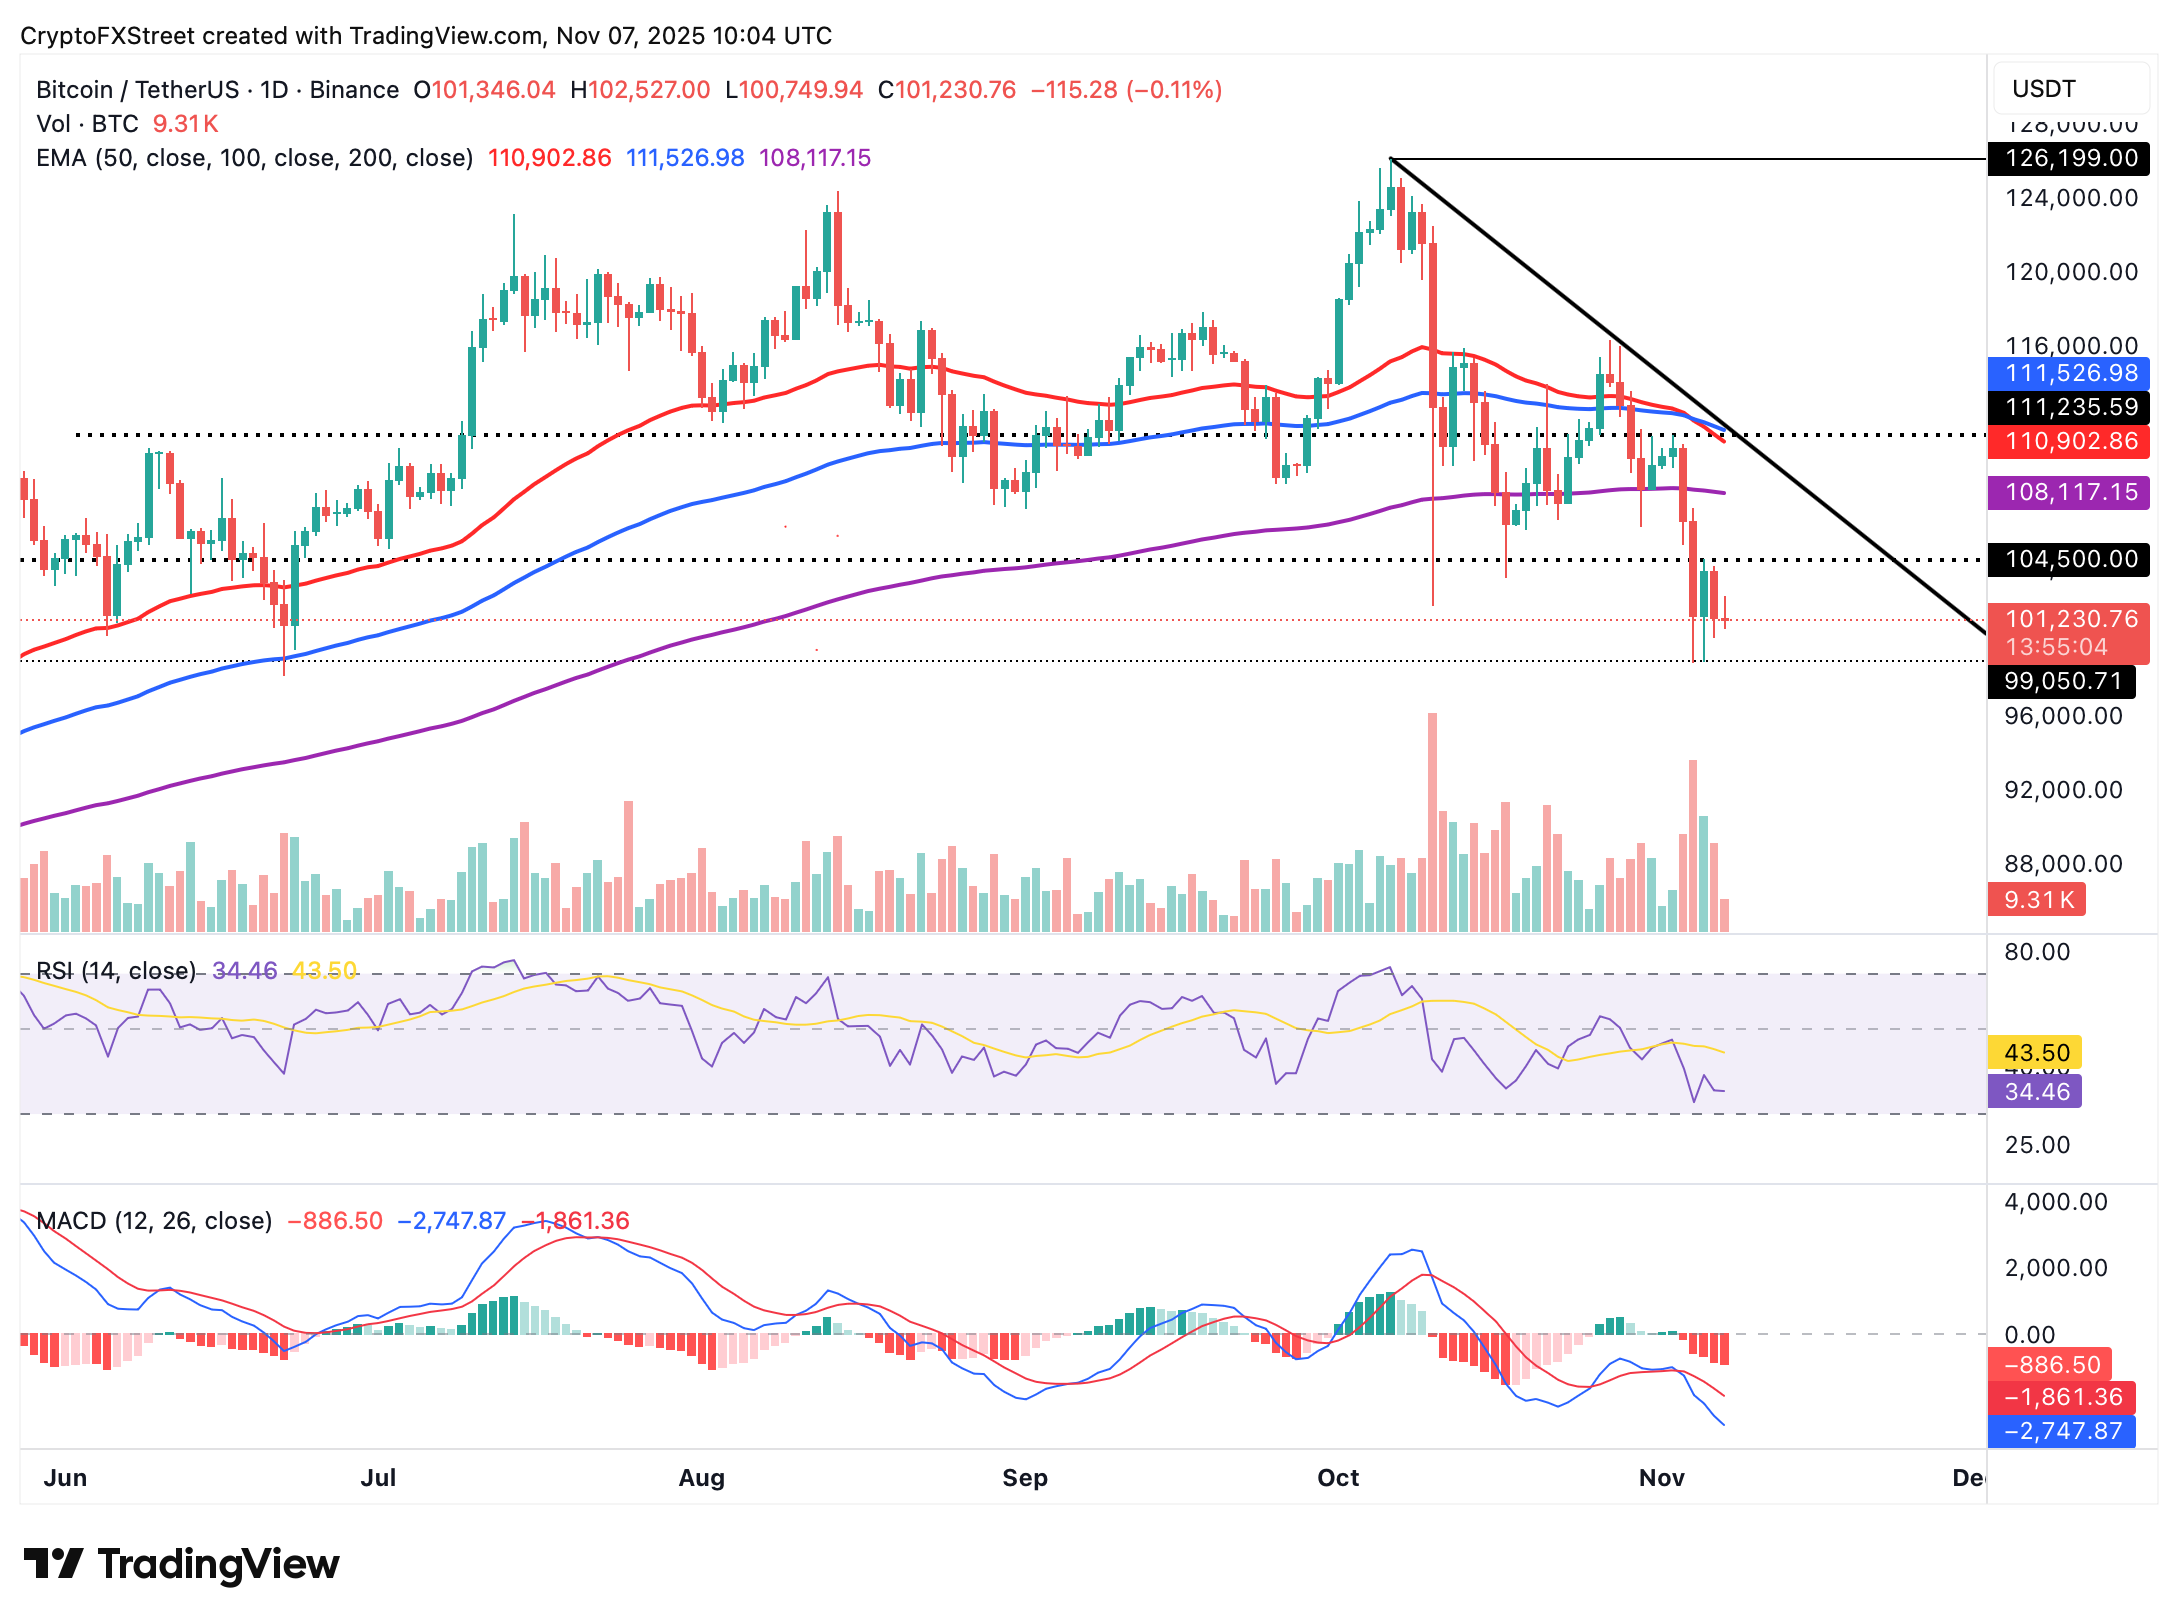
Chart of the day: Can Bitcoin sustain its recovery?
Bitcoin is trading above $101,000 at the time of writing after correcting from an intraday high of $102,527 on Friday. Despite the subtle recovery, bears are largely in control, as evidenced by the Relative Strength Index (RSI), which is at 34 on the daily chart and approaching oversold territory. Lower RSI readings indicate the bearish momentum is apparent and increasing.
The Moving Average Convergence Divergence (MACD) indicator on the same daily chart has maintained a sell signal since Monday, prompting traders to reduce risk exposure and contributing to selling pressure.
If profit-taking intensifies, it would be difficult for Bitcoin to sustain its recovery. Hence, traders should temper their bullish expectations, keeping in mind key levels such as $99,050, which was tested on Wednesday. On the flip side, the area around $104,500 represents a critical resistance that must be broken to confirm Bitcoin’s possible bullish comeback.
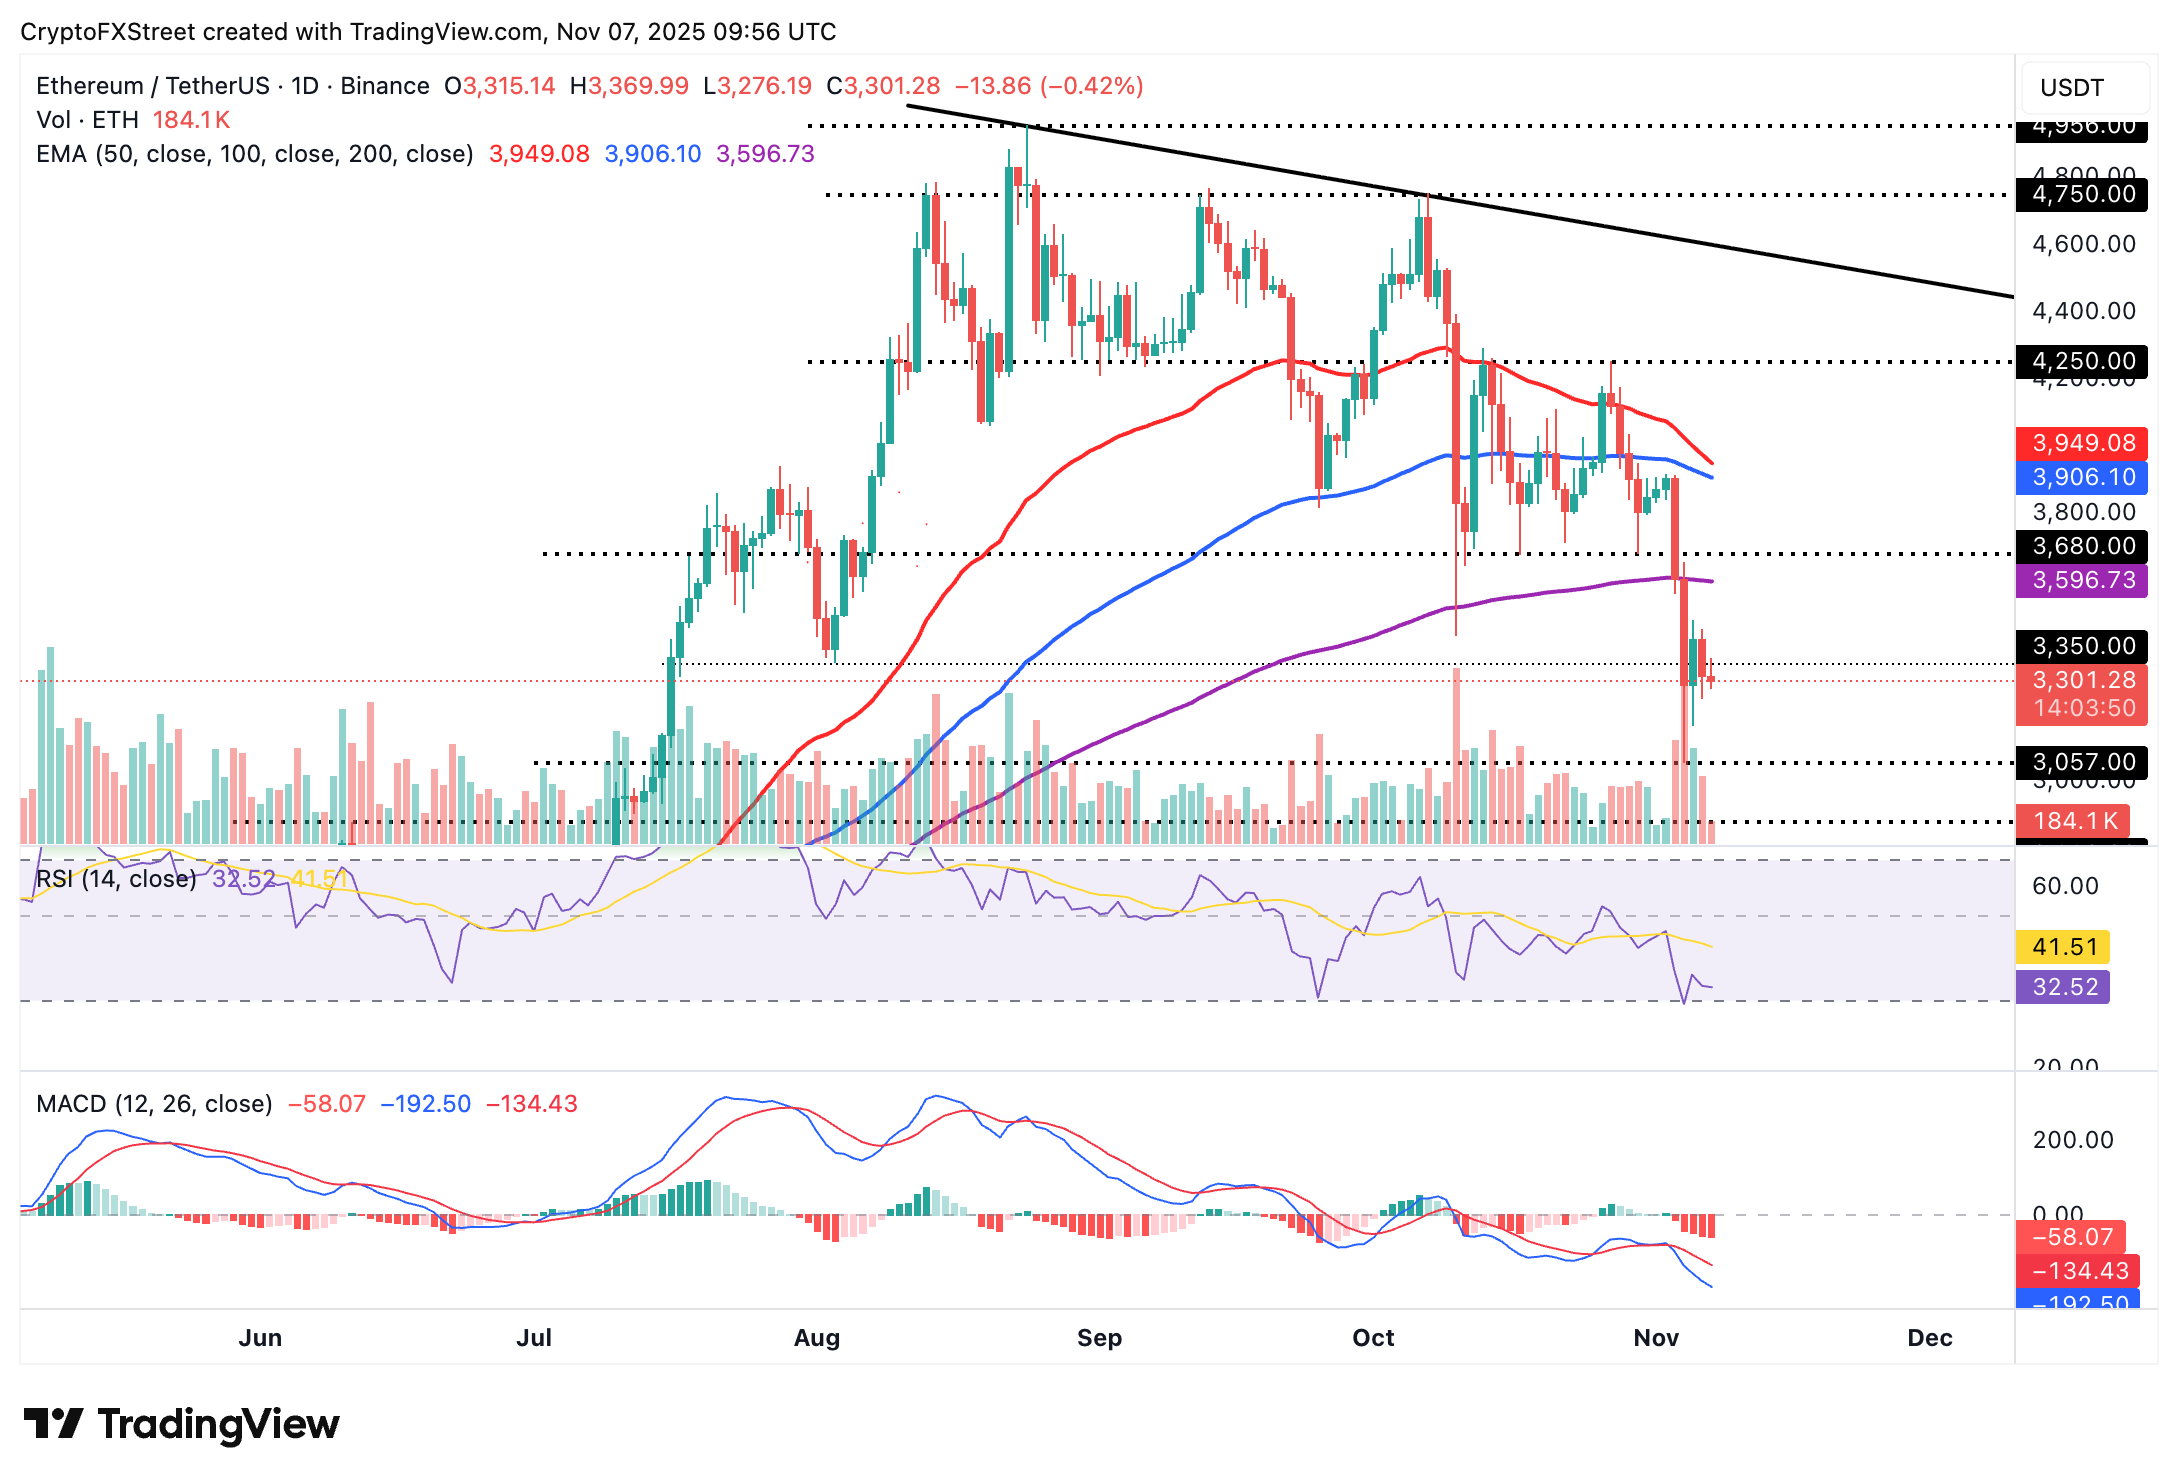
Altcoins update: Ethereum rises and then erases intraday gains
Ethereum is trading marginally below $3,300 after a correction from an intraday high of $3,369. The smart contracts token holds below key moving averages, including the 200-day Exponential Moving Average (EMA) at $3,596, the 100-day EMA at $3,905 and the 50-day EMA at $3,949, all of which reinforce the bearish sentiment.
The MACD indicator has maintained a sell signal since Monday, with the red histogram bars below the mean line reinforcing the bearish outlook. A downward-facing RSI at 32 indicates that bearish momentum is increasingly likely to hinder Ethereum’s potential recovery toward the 200-day EMA at $3,596. If the decline accelerates, key areas of interest for traders are $3,057, which was tested on Tuesday, and $2,880, previously tested in June.
As for XRP, intraday gains have been erased, resulting in a retest of the short-term support at $2.18 at the time of writing on Friday. Sellers have the upper hand, with the RSI on the daily chart falling to 36 after a brief recovery to 42 on Wednesday.
Investors are likely to lean bearishly, citing a sell signal from the MACD indicator since Tuesday. Sentiment may remain bearish as long as the blue line holds below the red signal line, as the indicator generally declines.
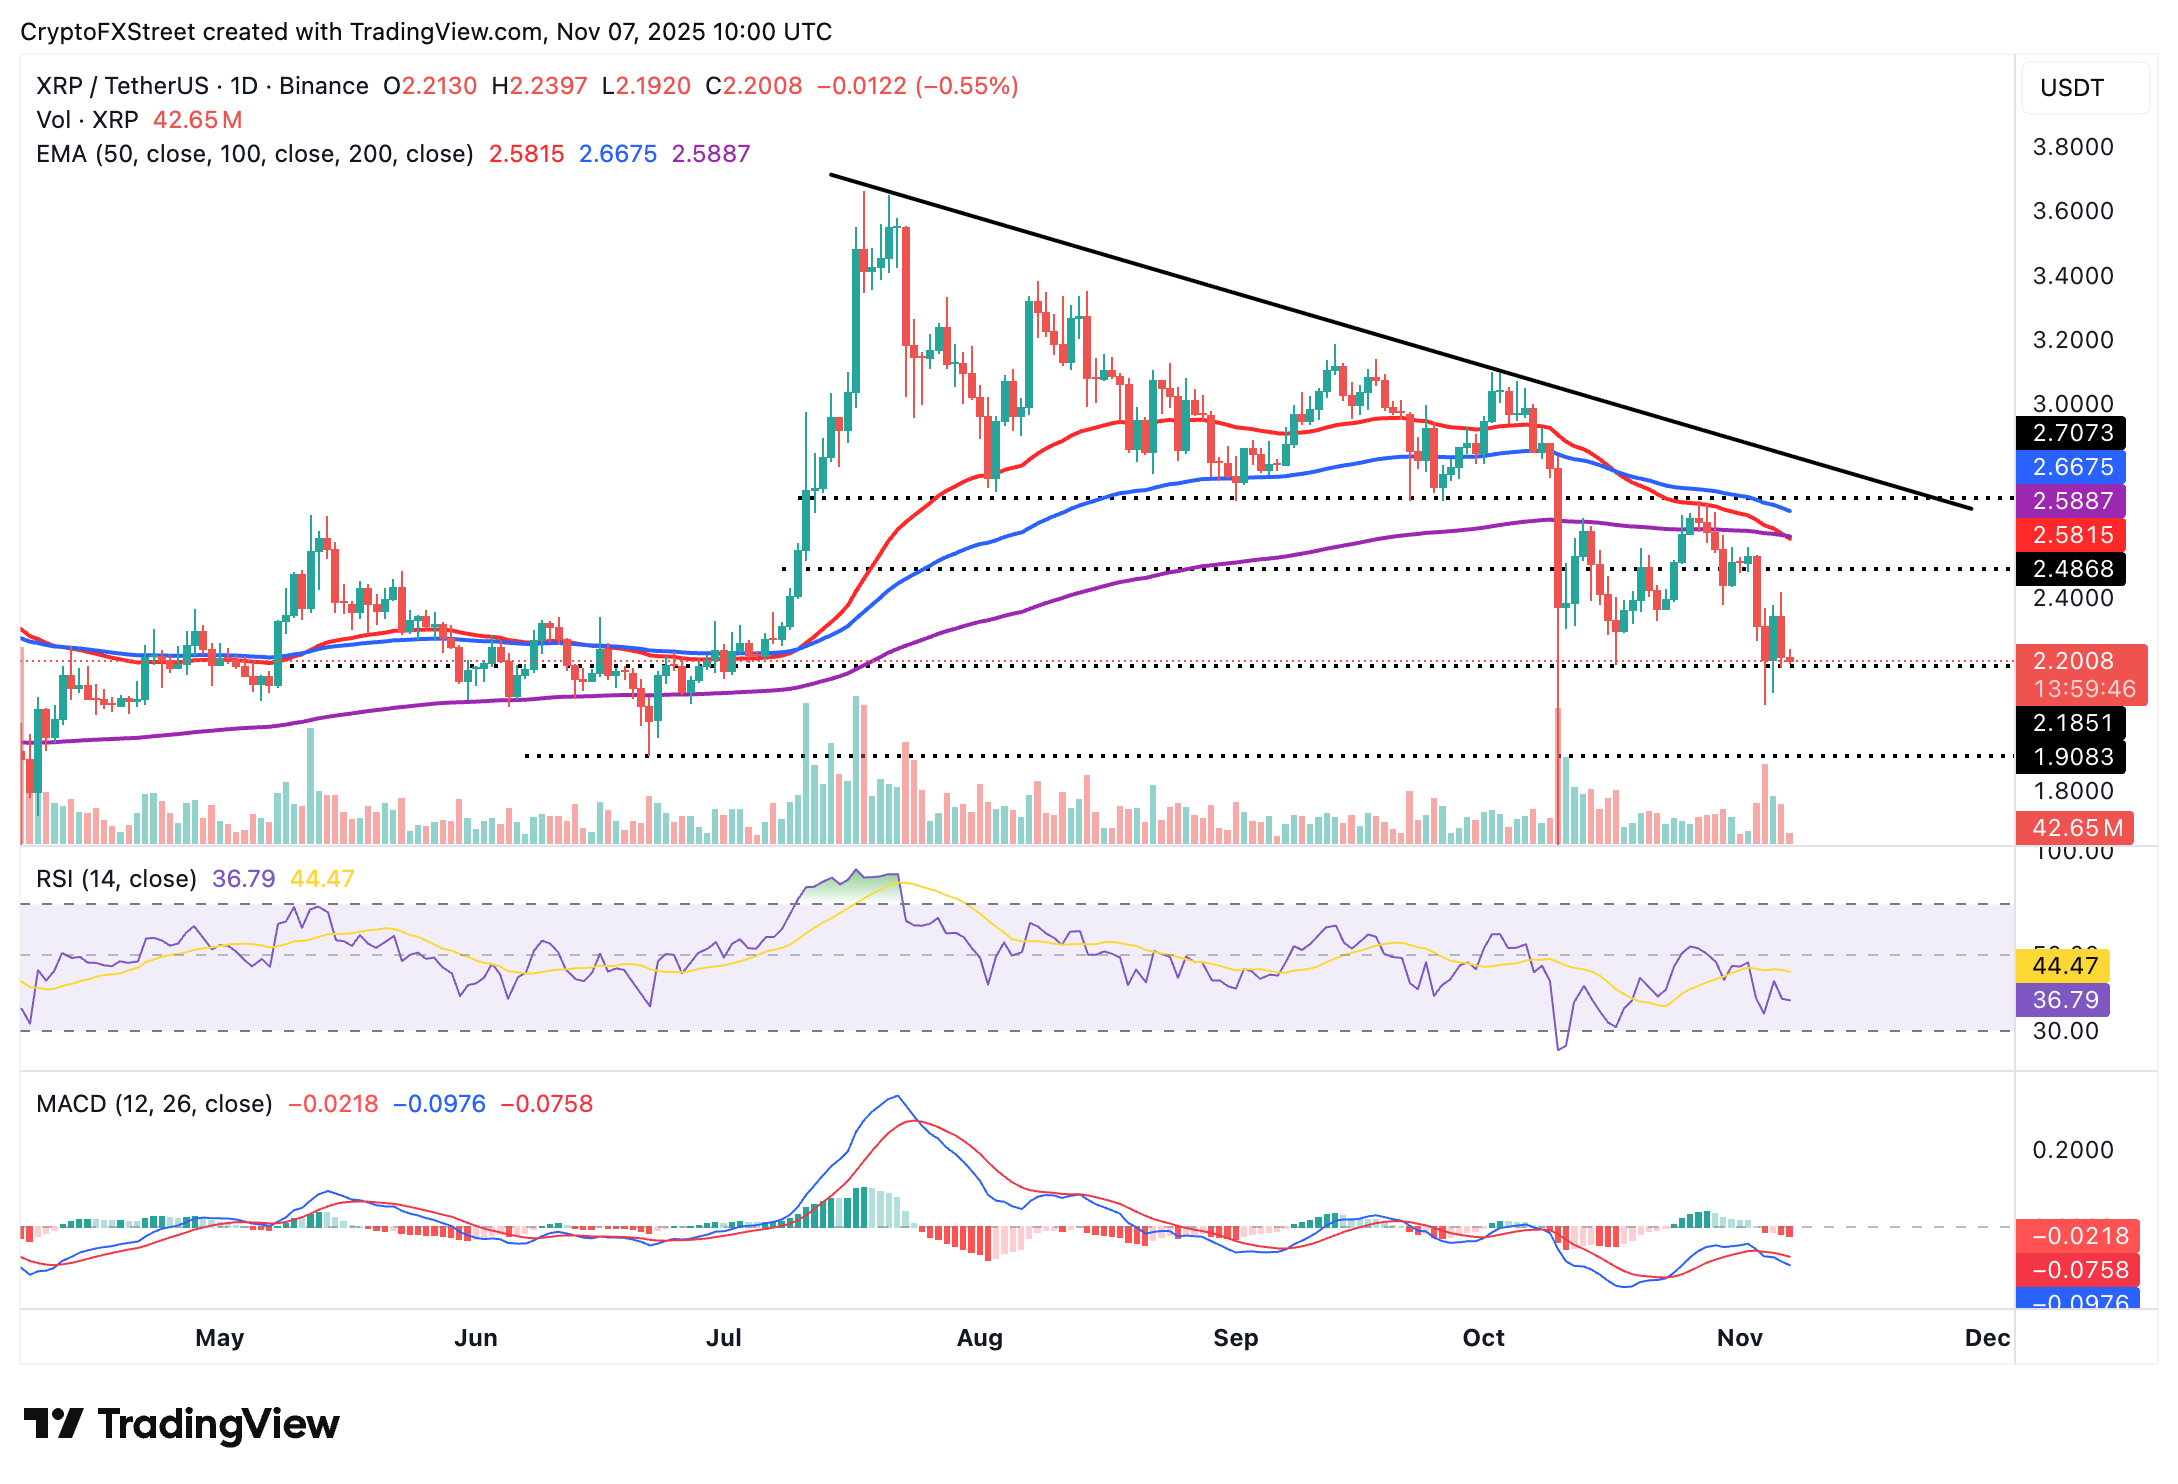
A Death Cross is a bearish pattern, which occurs when a shorter-term moving average crosses below a longer-term one. From the daily chart above, the 50-day EMA at $2.58 is on the verge of crossing below the 200-day EMA, bolstering the bearish outlook.
Still, if bulls seek exposure by buying the dip, XRP could resume its uptrend, targeting highs above the confluence of the 200-day and 50-day EMAs at $2.58.
Crypto ETF FAQs
An Exchange-Traded Fund (ETF) is an investment vehicle or an index that tracks the price of an underlying asset. ETFs can not only track a single asset, but a group of assets and sectors. For example, a Bitcoin ETF tracks Bitcoin’s price. ETF is a tool used by investors to gain exposure to a certain asset.
Yes. The first Bitcoin futures ETF in the US was approved by the US Securities & Exchange Commission in October 2021. A total of seven Bitcoin futures ETFs have been approved, with more than 20 still waiting for the regulator’s permission. The SEC says that the cryptocurrency industry is new and subject to manipulation, which is why it has been delaying crypto-related futures ETFs for the last few years.
Yes. The SEC approved in January 2024 the listing and trading of several Bitcoin spot Exchange-Traded Funds, opening the door to institutional capital and mainstream investors to trade the main crypto currency. The decision was hailed by the industry as a game changer.
The main advantage of crypto ETFs is the possibility of gaining exposure to a cryptocurrency without ownership, reducing the risk and cost of holding the asset. Other pros are a lower learning curve and higher security for investors since ETFs take charge of securing the underlying asset holdings. As for the main drawbacks, the main one is that as an investor you can’t have direct ownership of the asset, or, as they say in crypto, “not your keys, not your coins.” Other disadvantages are higher costs associated with holding crypto since ETFs charge fees for active management. Finally, even though investing in ETFs reduces the risk of holding an asset, price swings in the underlying cryptocurrency are likely to be reflected in the investment vehicle too.
Bài viết đề xuất


