
Crypto Today: Bitcoin, Ethereum, XRP descend further as retail and institutional traders exit
- Bitcoin drops toward its October low of $102,000 amid persistent ETF outflows.
- Ethereum slides below $3,500 amid shrinking retail demand, with Open Interest averaging $45 billion.
- XRP is largely in bearish hands as investors increasingly pile into short positions.
Bitcoin (BTC) declines for the second consecutive day, reflecting a sticky risk-off sentiment in the broader cryptocurrency market. Trading below $104,000 at the time of writing on Tuesday, the path of least resistance appears to be downward, targeting its October low of $102,000.
The capitulation has also put altcoins on the back foot, with Ethereum (ETH) falling below $3,500 and Ripple (XRP) trading around $2.26. As retail traders continue to de-risk due to heightened volatility, the sell-off may persist through the week.
Data spotlight: BTC, ETH, XRP hit by volatility as retail and institutional demand shrink
Interest in crypto-related financial products, including Exchange Traded Funds (ETFs), has significantly decreased over the last few weeks. Bitcoin spot US-listed ETFs experienced approximately $187 million in outflows on Monday. This marked the fourth consecutive day of outflows, bringing the cumulative total inflow volume to $$61 billion and the net assets to $143.5 billion.
ETFs have been a significant contributor to Bitcoin's rally to its record high of $126,199 reached in early October. Hence, a persistent bearish streak could accelerate the prevailing downside risks.
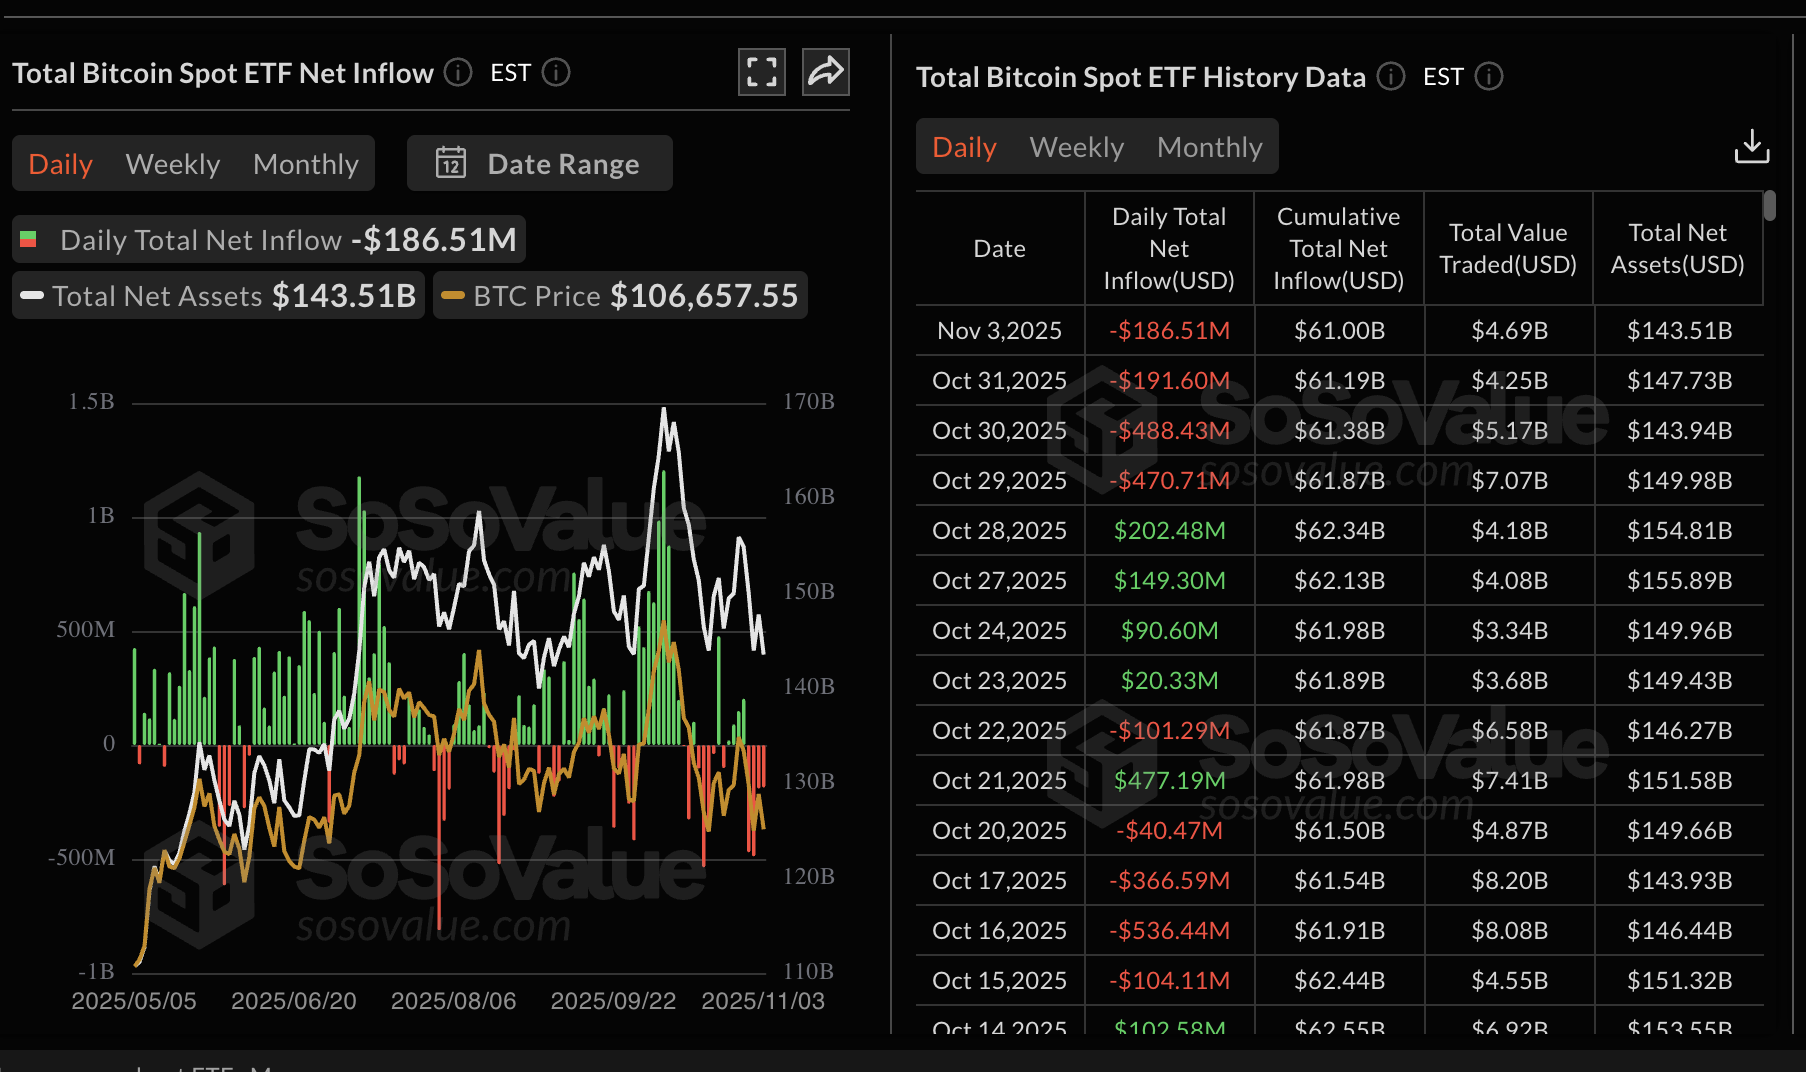
Bitcoin ETF stats | Source: SoSoValue
Ethereum is also facing the institutional investors' exodus, with US-listed ETFs posting outflows of $136 million on Monday. None of the nine ETH ETFs saw net inflows, with BlackRock's ETHA leading with -$82 million, followed by Fidelity's FETH with -$25 million. So far, Ethereum ETFs have recorded cumulative net inflows of $14.23 billion and net assets of approximately $24 billion.
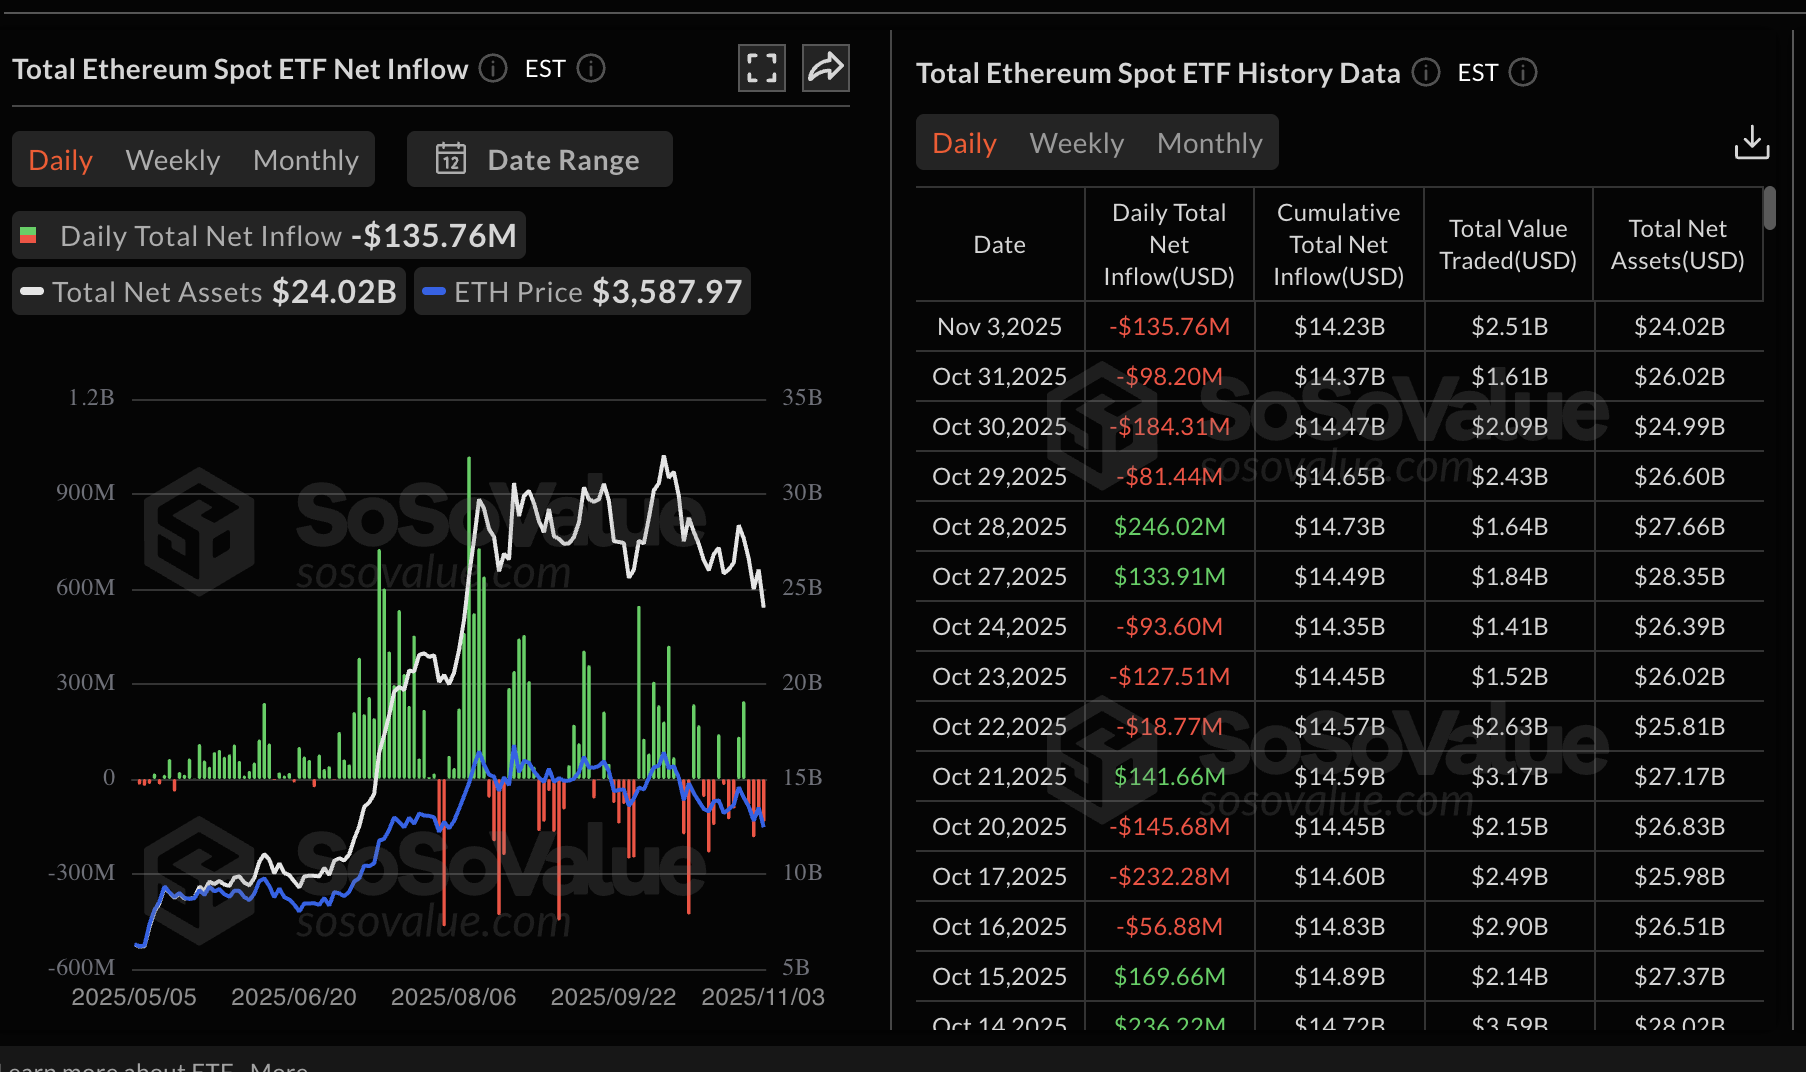
Ethereum ETF stats | Source: SoSoValue
The cross-border money remittance token, XRP, is facing a top-heavy technical structure, worsened by waning retail demand. Since the massive sell-off on October 10, which triggered crypto liquidations worth more than $19 billion in one day, the XRP Open Interest-weighted funding rate has remained significantly suppressed.
CoinGlass data shows the OI-weighted funding rate at -0.0019%, down from 0.0085% on Sunday. The sharp drop suggests traders are intentionally closing their long positions and piling into short positions, thereby depriving XRP of the tailwind needed to sustain its recovery.
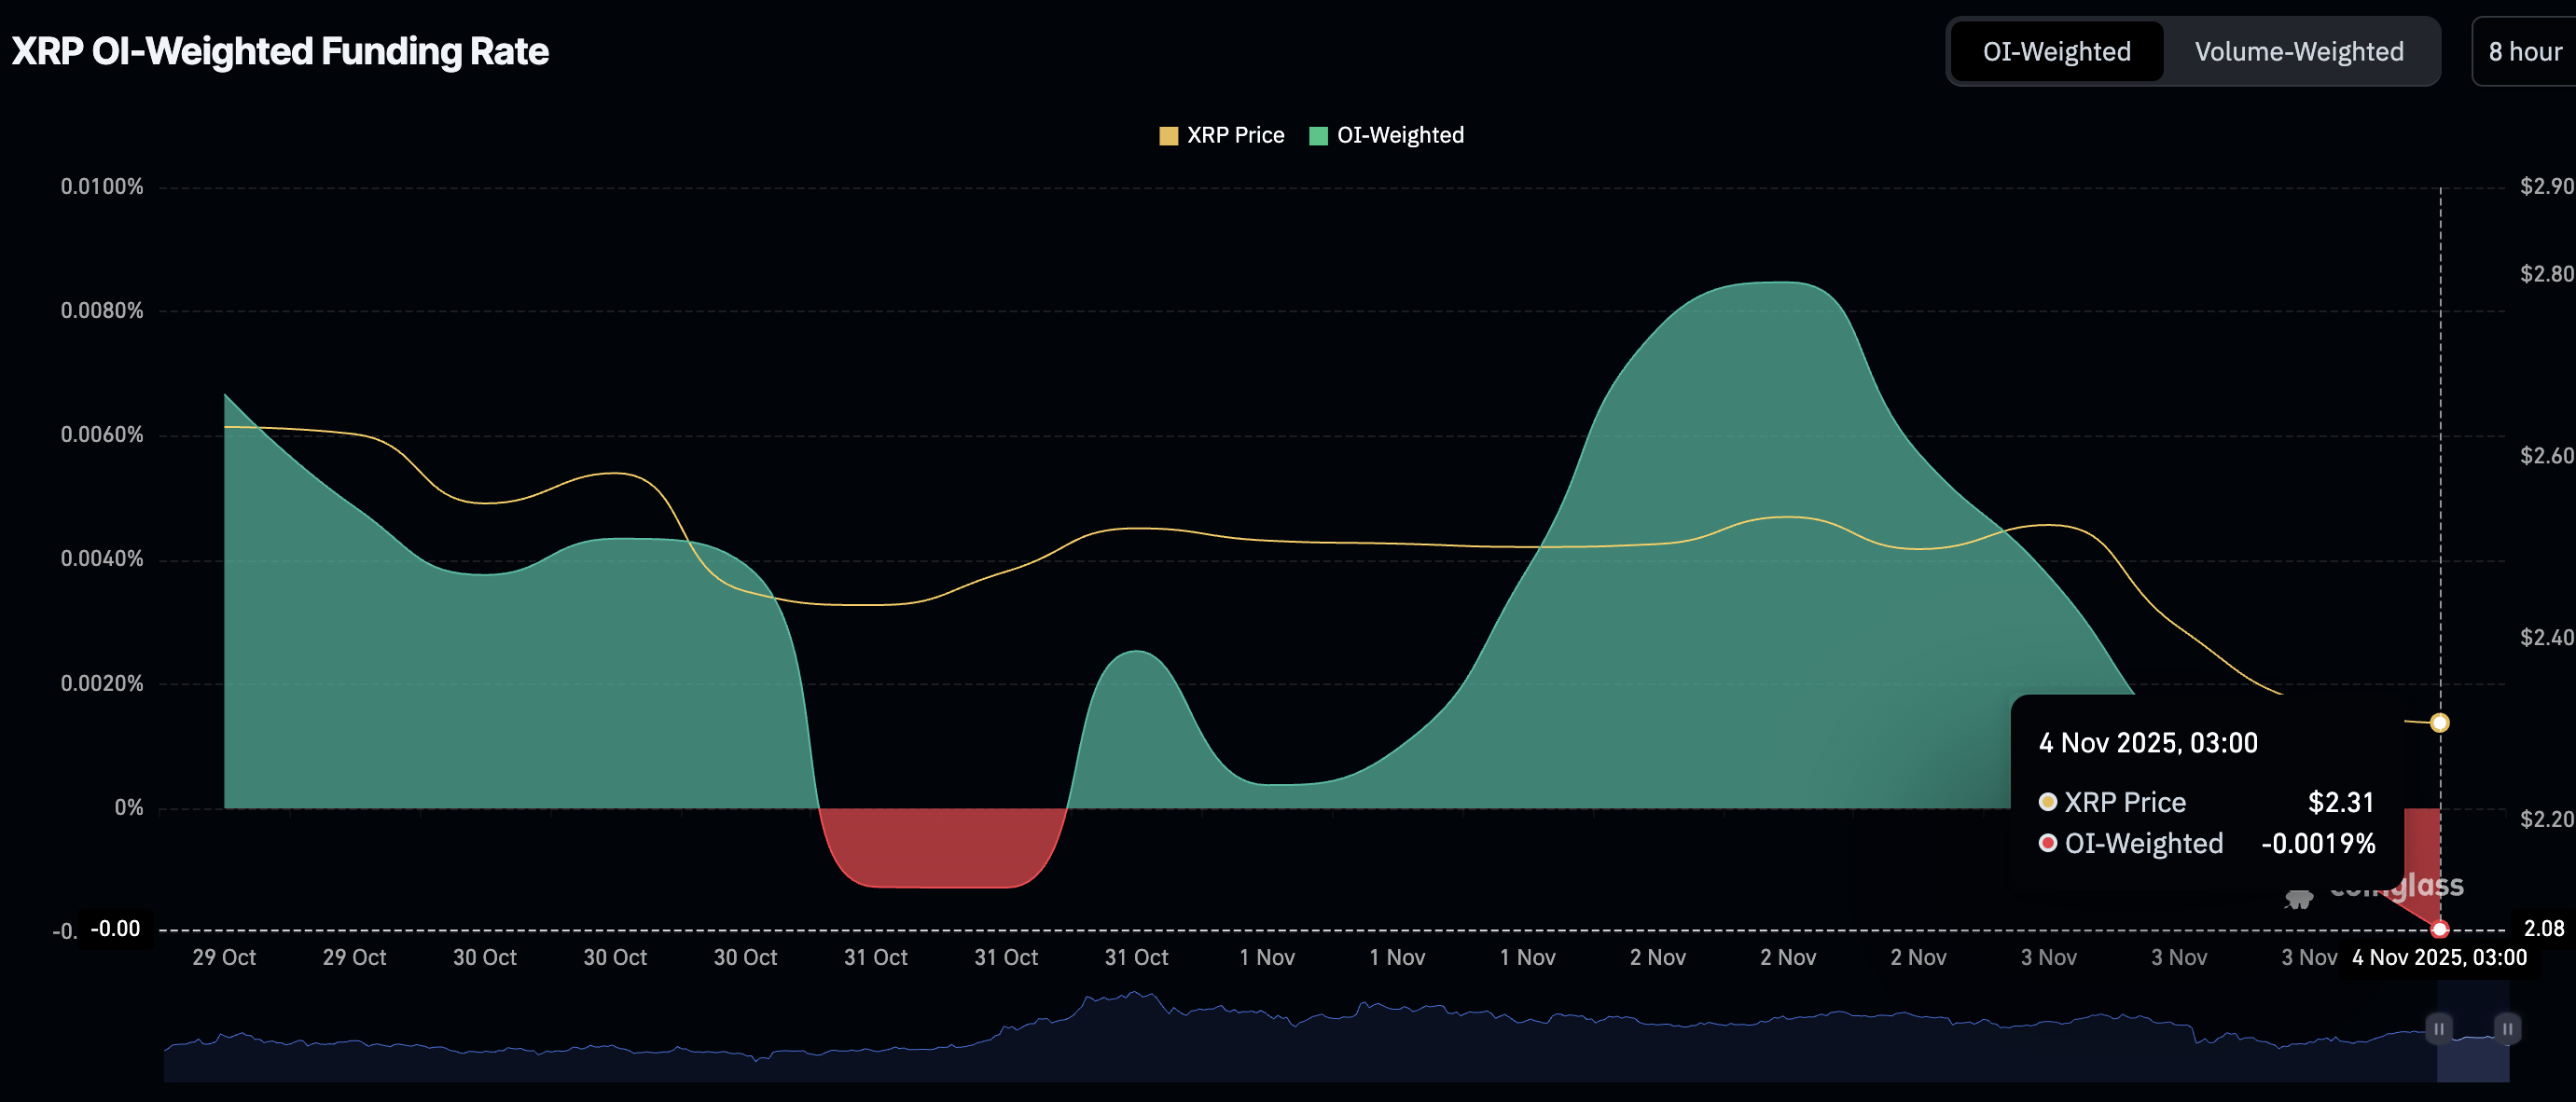
XRP OI-weighted funding | Source: CoinGlass
Chart of the day: Bitcoin extends correction
Bitcoin is trading below $104,000 at the time of writing on Tuesday, weighed down by risk-off sentiment amid macroeconomic uncertainty and a lack of price catalysts to sustain the recovery.
The Relative Strength Index (RSI) on the daily chart is at 35 and continues to fall, indicating that bearish momentum is increasing. A sell signal from the Moving Average Convergence Divergence (MACD) indicator has been maintained since Monday. Such a signal occurs when the blue MACD line crosses and settles below the red signal line, calling upon investors to reduce their risk exposure.
The next line of defense is Bitcoin's October low of $102,500. If respected and investors buy dip, a recovery could ensue toward the round-number resistance at $110,000. Otherwise, BTC may extend its down leg below $100,000 and close in on the support at $98,295, last tested in June.
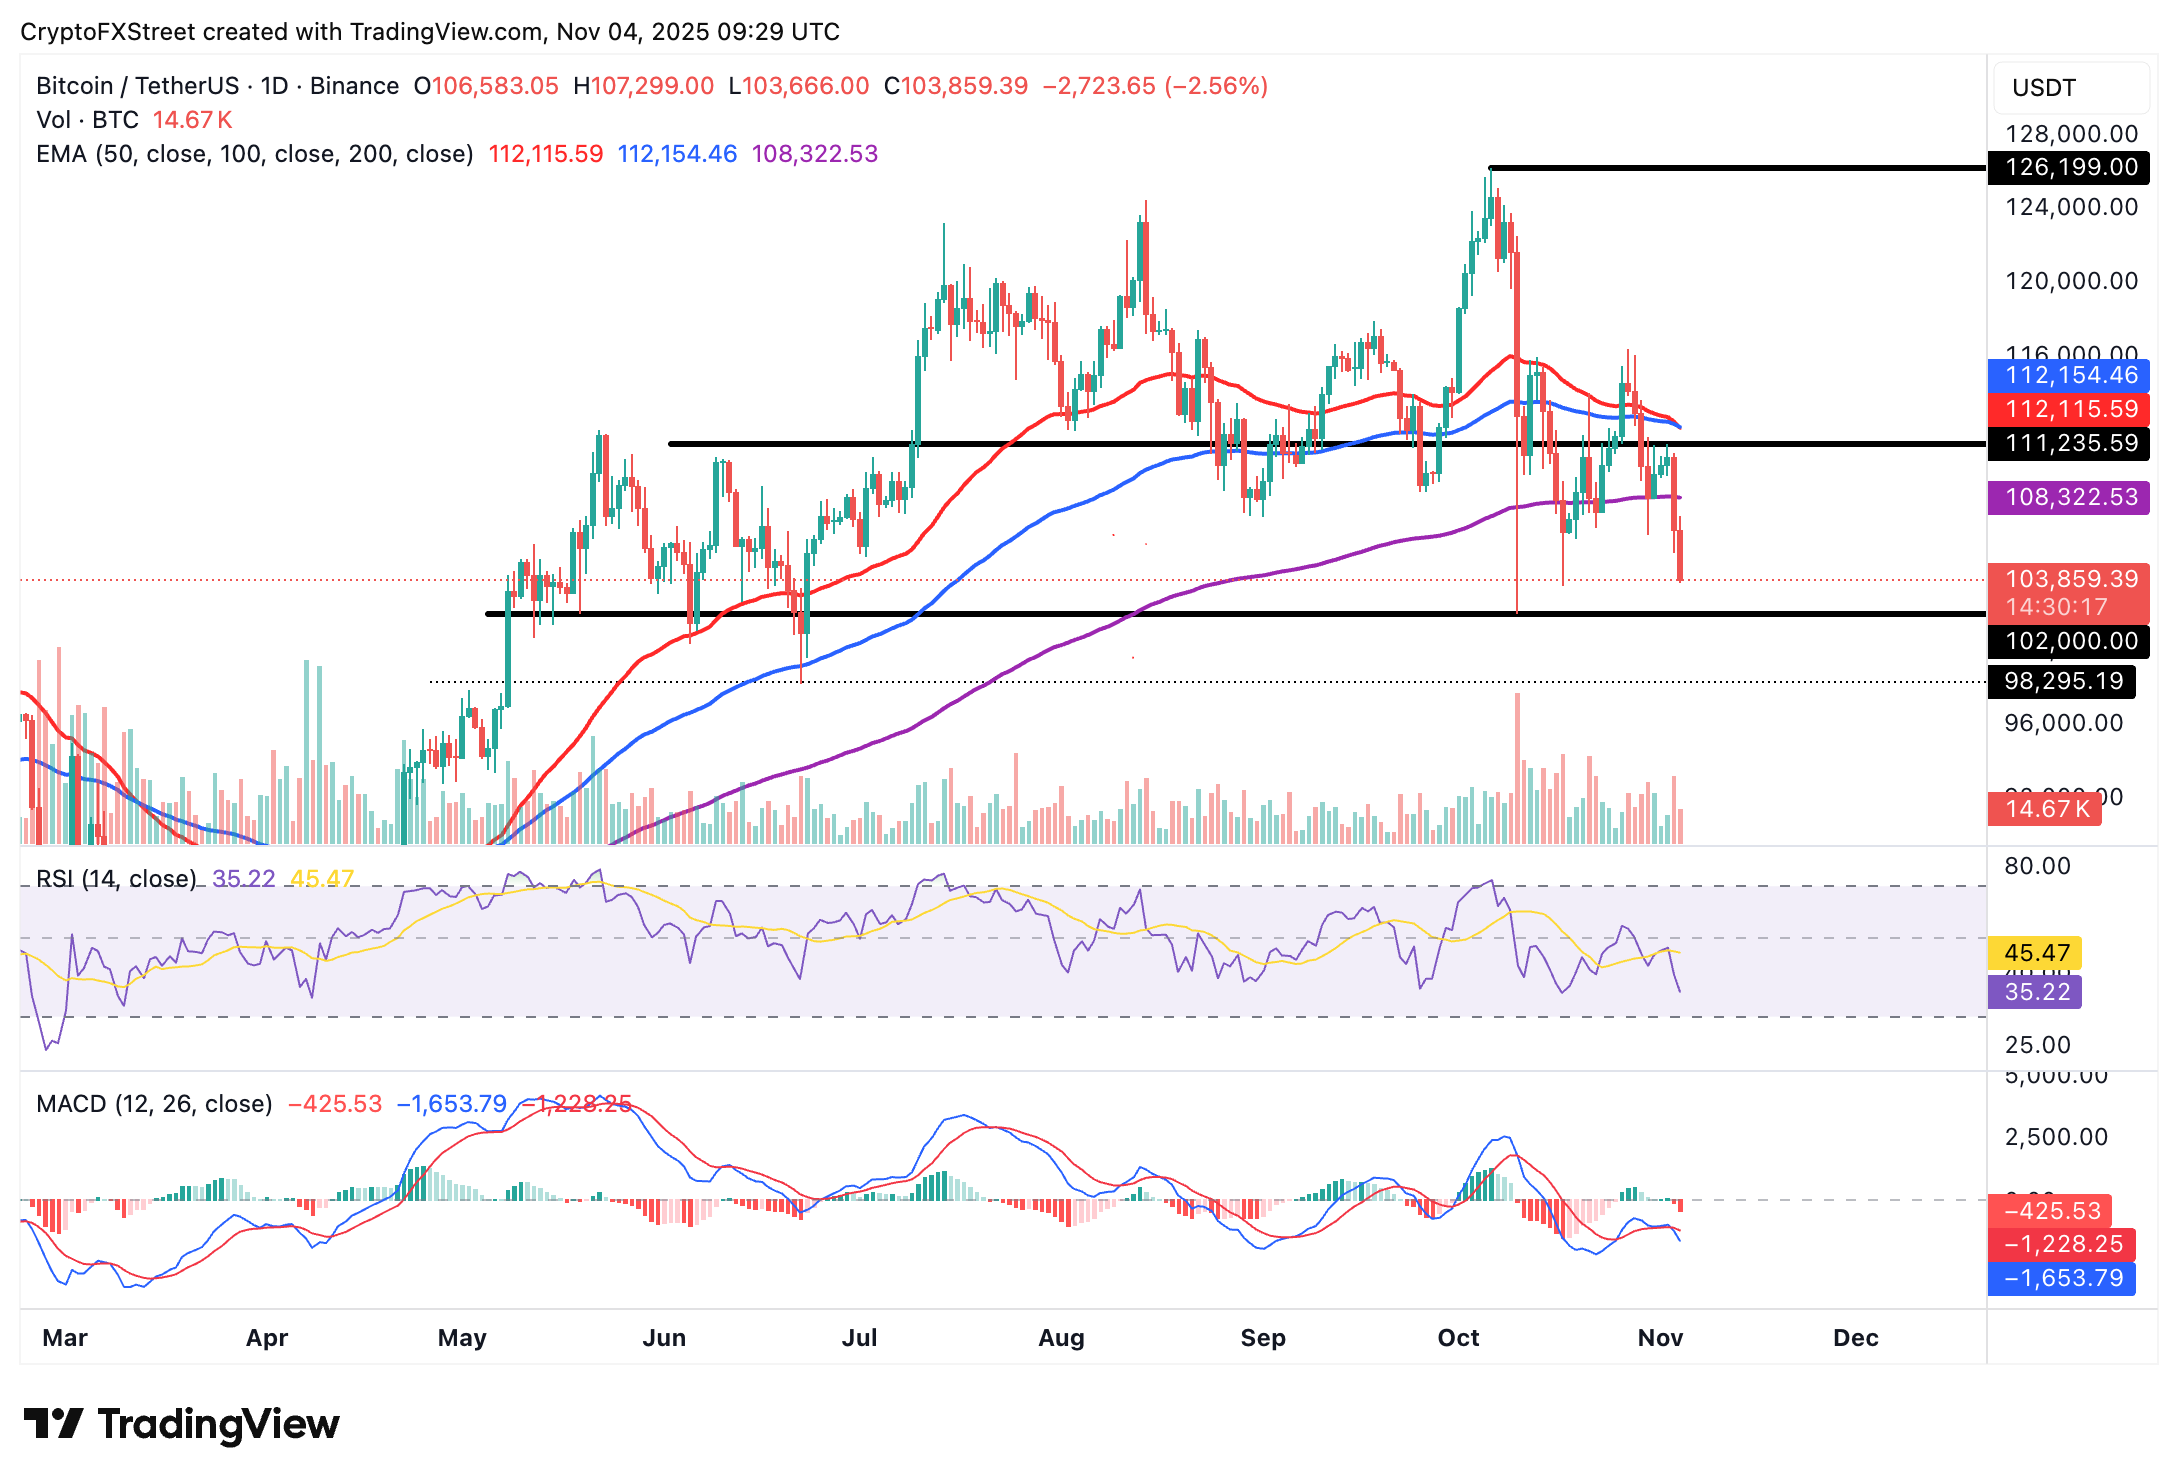
BTC/USDT daily chart
Altcoins update: Ethereum, XRP tumble as investors reduce exposure
Ethereum is trading below $3,500 at the time of writing on Tuesday, following in Bitcoin's bearish footsteps. The smart contracts token is positioned below key moving averages, including the 200-day Exponential Moving Average (EMA) at $3,606, the 100-day EMA at $3,944 and the 50-day EMA at $4,034, all of which bolster the bearish sentiment.
The RSI at 33 and declining toward oversold territory indicates that sellers have the upper hand. A MACD sell signal on the daily chart encourages traders to close their long positions in favor of short orders.
If the decline persists, the next key support is the area around $3,350, which was previously tested in early August. Still, a daily close above the 200-day EMA at $3,606 could reinforce the shift from bearish to bullish, increasing the odds of a reversal toward the 50-day EMA resistance at $4,034.
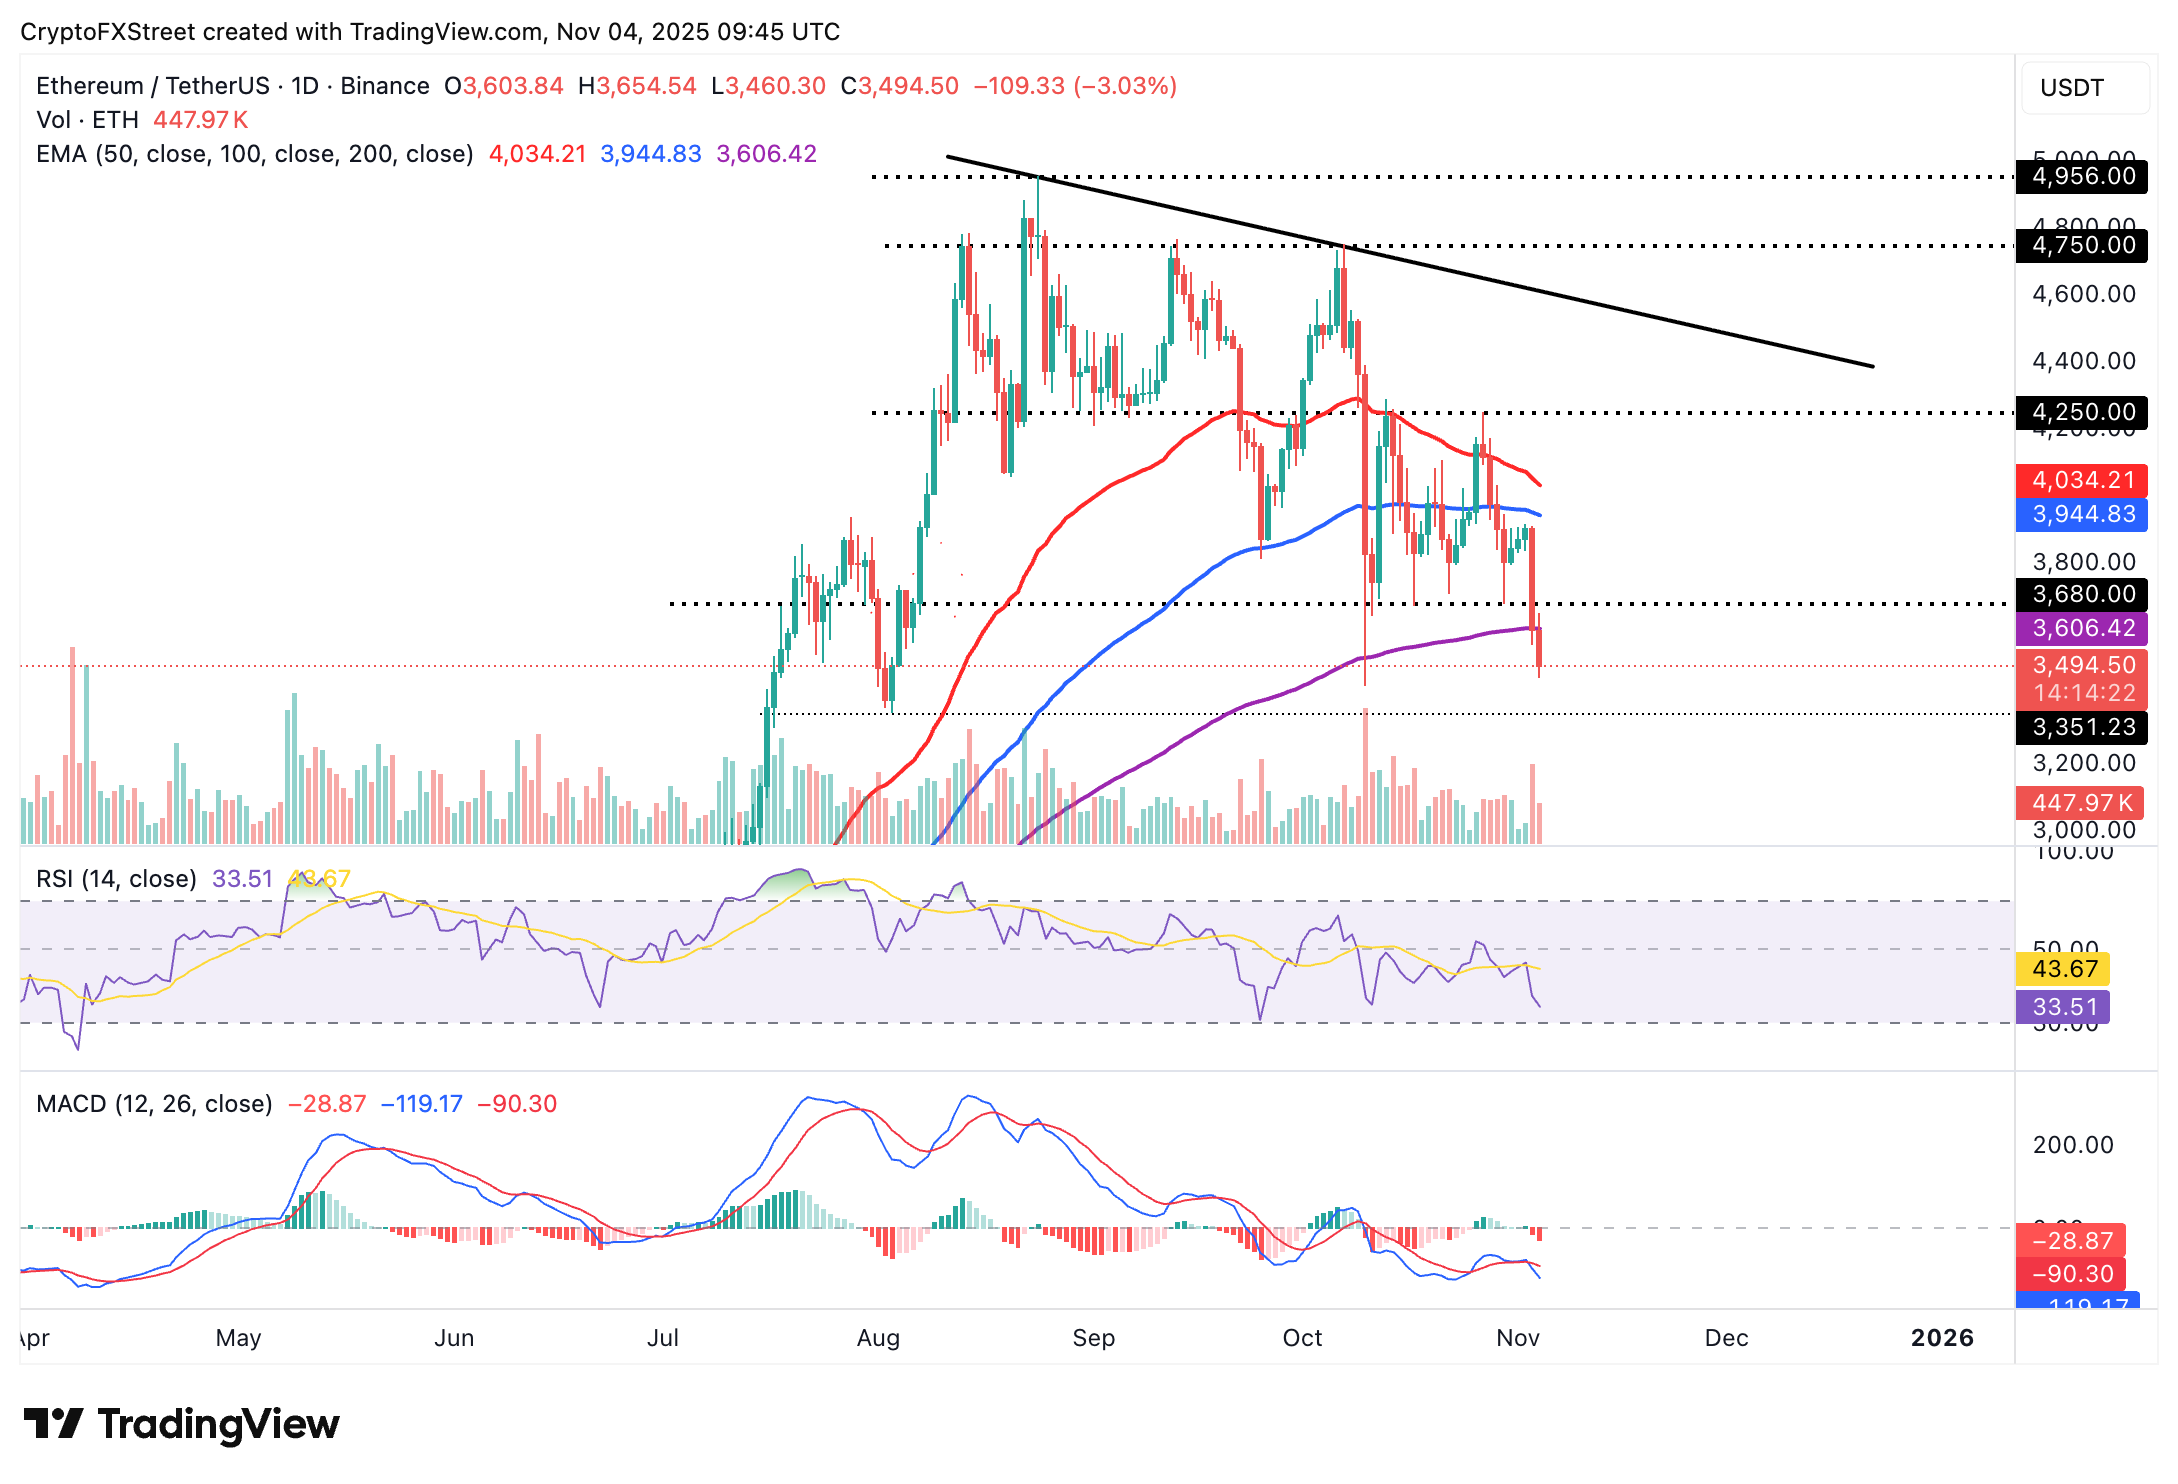
ETH/USDT daily chart
As for XRP, sellers have the upper hand at the time of writing, as the cross-border remittance token drops for the second consecutive day to around $2.26.
XRP is also positioned below key moving averages, including the 200-day EMA at $2.59, the 50-day EMA at $2.62 and the 100-day EMA at $2.69, bolstering the bearish outlook.
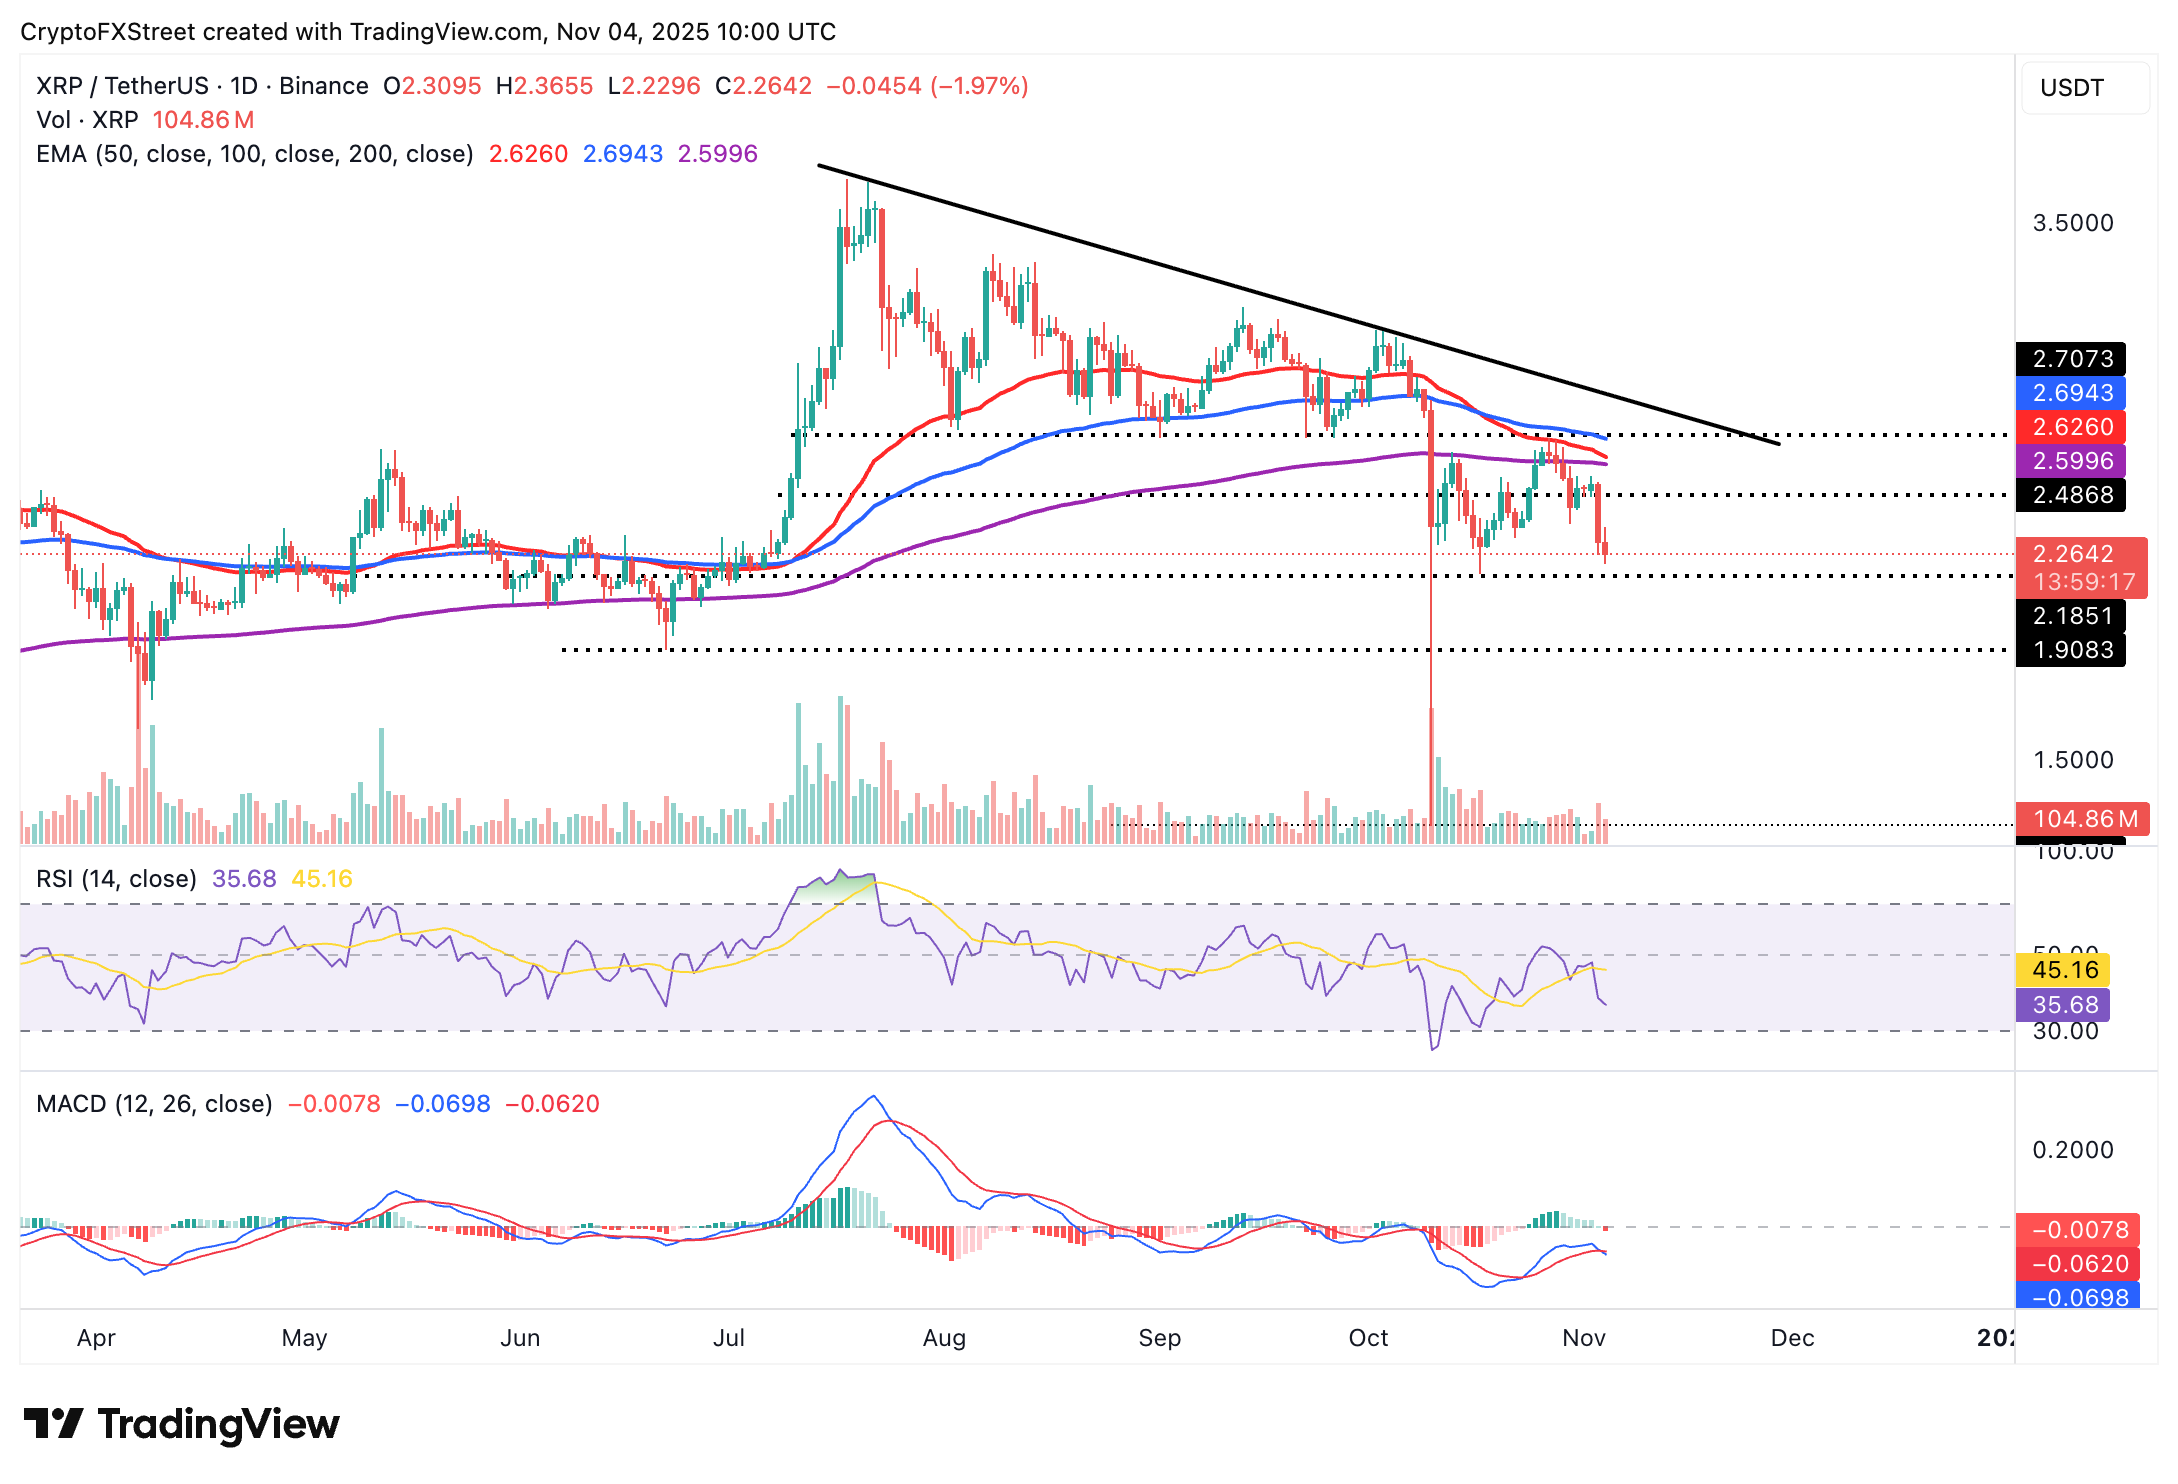
XRP/USDT daily chart
The MACD indicates a sell signal on the daily chart, suggesting traders reduce their exposure. If the decline persists in upcoming sessions, XRP may extend the down leg below $2.18, a support tested on October 17, and later below $1.90, last tested in June.
Bitcoin, altcoins, stablecoins FAQs
Bitcoin is the largest cryptocurrency by market capitalization, a virtual currency designed to serve as money. This form of payment cannot be controlled by any one person, group, or entity, which eliminates the need for third-party participation during financial transactions.
Altcoins are any cryptocurrency apart from Bitcoin, but some also regard Ethereum as a non-altcoin because it is from these two cryptocurrencies that forking happens. If this is true, then Litecoin is the first altcoin, forked from the Bitcoin protocol and, therefore, an “improved” version of it.
Stablecoins are cryptocurrencies designed to have a stable price, with their value backed by a reserve of the asset it represents. To achieve this, the value of any one stablecoin is pegged to a commodity or financial instrument, such as the US Dollar (USD), with its supply regulated by an algorithm or demand. The main goal of stablecoins is to provide an on/off-ramp for investors willing to trade and invest in cryptocurrencies. Stablecoins also allow investors to store value since cryptocurrencies, in general, are subject to volatility.
Bitcoin dominance is the ratio of Bitcoin's market capitalization to the total market capitalization of all cryptocurrencies combined. It provides a clear picture of Bitcoin’s interest among investors. A high BTC dominance typically happens before and during a bull run, in which investors resort to investing in relatively stable and high market capitalization cryptocurrency like Bitcoin. A drop in BTC dominance usually means that investors are moving their capital and/or profits to altcoins in a quest for higher returns, which usually triggers an explosion of altcoin rallies.
Bài viết đề xuất


