Crypto Today: Bitcoin, Ethereum, XRP on edge as market demand wobbles
- Bitcoin reclaims the $110,000 mark despite outflows in US spot ETFs and a decline in Open Interest.
- Ethereum’s recovery stalls below $3,900 after bouncing off the $3,650 support zone for the third time this month.
- XRP rebounds to $2.50 after four consecutive days of losses amid an impending Death Cross pattern.
Bitcoin (BTC) and major altcoins recover on Friday, trying to find a footing after four consecutive days of losses. BTC rebounds above $110,000, bouncing off the 200-day Exponential Moving Average (EMA), with Ethereum (ETH) and Ripple (XRP) mimicking Bitcoin's intraday recovery, after catalysts such as the Federal interest rate cut on Wednesday and the Trump-Xi meeting on Thursday failed to lift the market's mood.
Demand turns lukewarm at retail, institutional levels
Retail interest in Bitcoin and XRP remains low as their futures Open Interest (OI) has dropped by nearly 3% and 5% to $71.79 billion and $4.16 billion, respectively, over the last 24 hours. This indicates that traders are limiting their risk exposure in Bitcoin and XRP futures by either closing positions or reducing leverage.
The demand for Ethereum, on the other hand, remains relatively stable with the futures OI rising by 0.56% in the same time period to $46.99 billion.

BTC, ETH, and XRP derivatives data. Source: CoinGlass
On a more positive note, institutional demand for Bitcoin and Ethereum remains steady, heading for a monthly net inflow. As of October 31, the US Bitcoin and Ethereum spot ETFs have recorded $3.61 billion and $668.13 million in monthly net inflows, respectively, despite the lackluster performance of both assets during the month.
However, two successive days of net outflows this week, following the Federal interest rate cuts on Wednesday and the Trump-Xi meeting on Thursday, warn of a potential shake in institutional confidence if these are sustained.

US Bitcoin and Ethereum spot ETFs inflow data. Source: Sosovalue
Chart of the day: Bitcoin tests the 200-day EMA
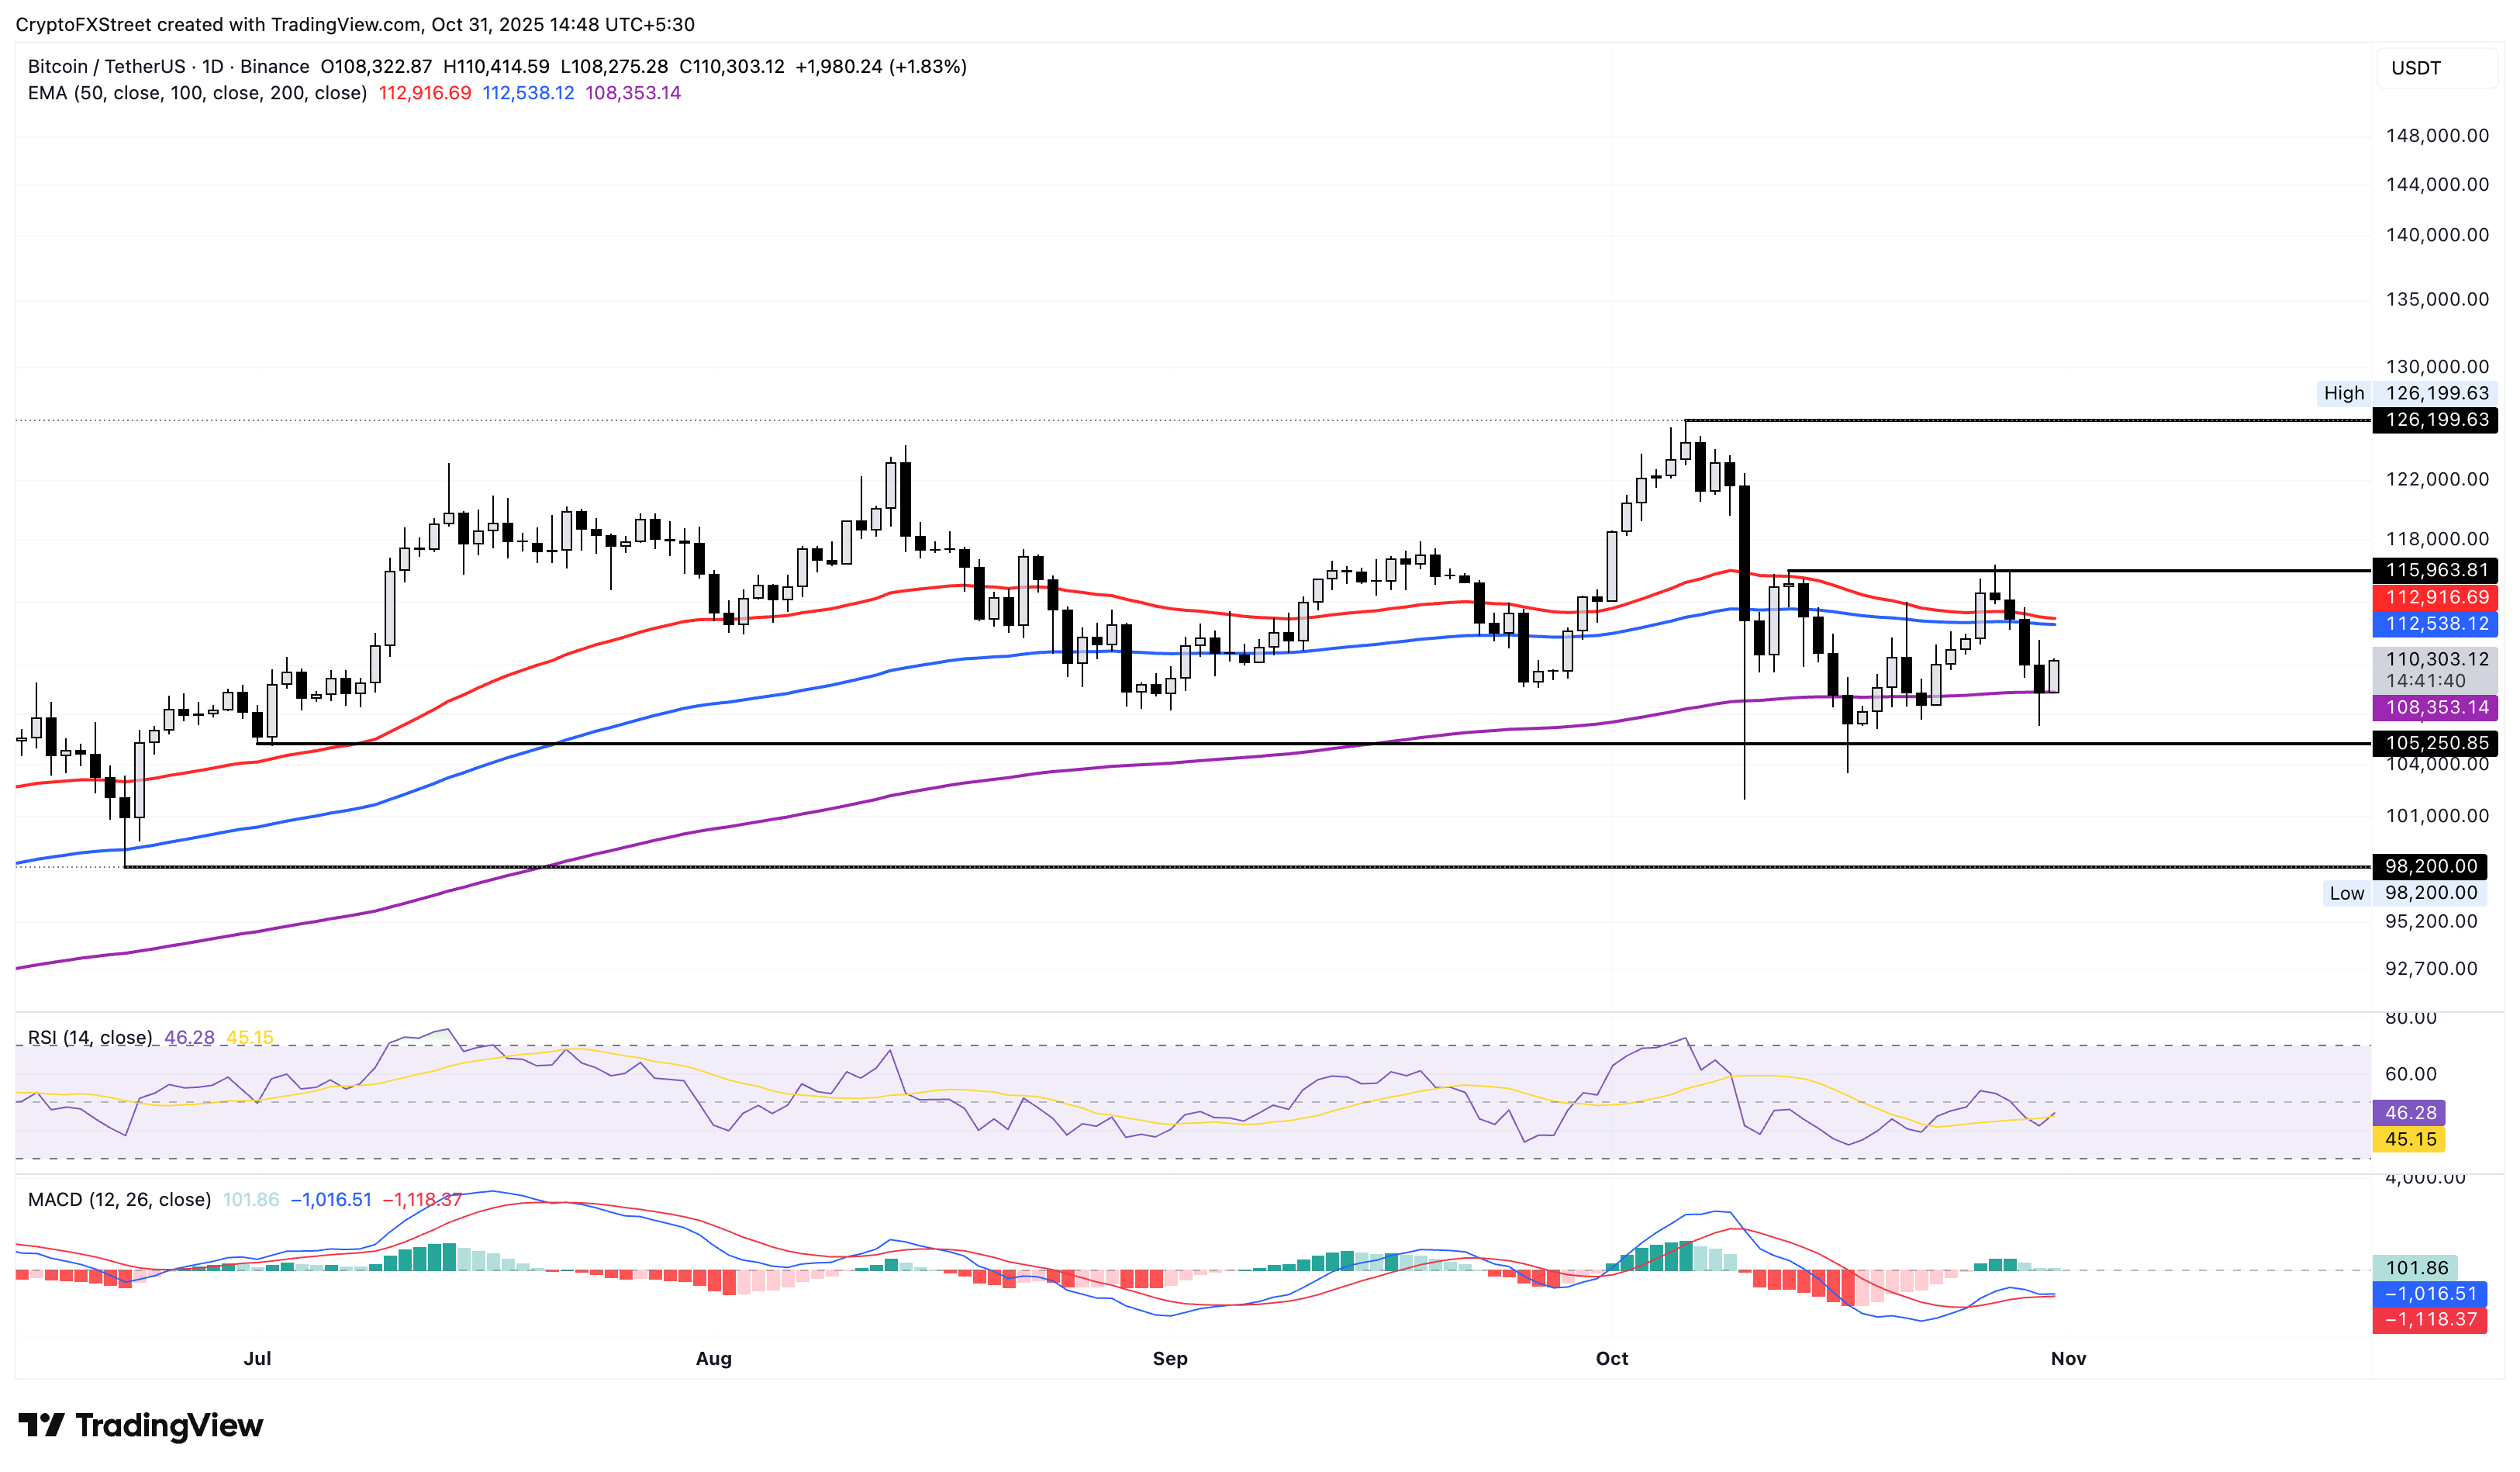
Bitcoin is trading around $110,000 at press time on Friday, taking support at the 200-day EMA at $108,353. A positive close to the day would break the streak of four straight days of losses, potentially igniting a rebound towards the 100-day EMA at $112,538.
However, the declining 50-day EMA warns of a bearish cross with the 100-day EMA, which would confirm the downward risks in the short-term trend.
The Relative Strength Index (RSI) reads 46 on the daily chart, rising towards the midpoint and indicating an intraday decline in selling pressure. If RSI resurfaces above 50, it would indicate a renewed buying interest.
The Moving Average Convergence Divergence (MACD) is also moving broadly sideways, extremely close to the signal line, resisting a sell signal.

BTC/USDT daily price chart.
If BTC slips below the 200-day EMA at $108,353, it could extend the decline to the $105,250 level, marked by the July 1 low.
Will Altcoins sustain the intraday growth?
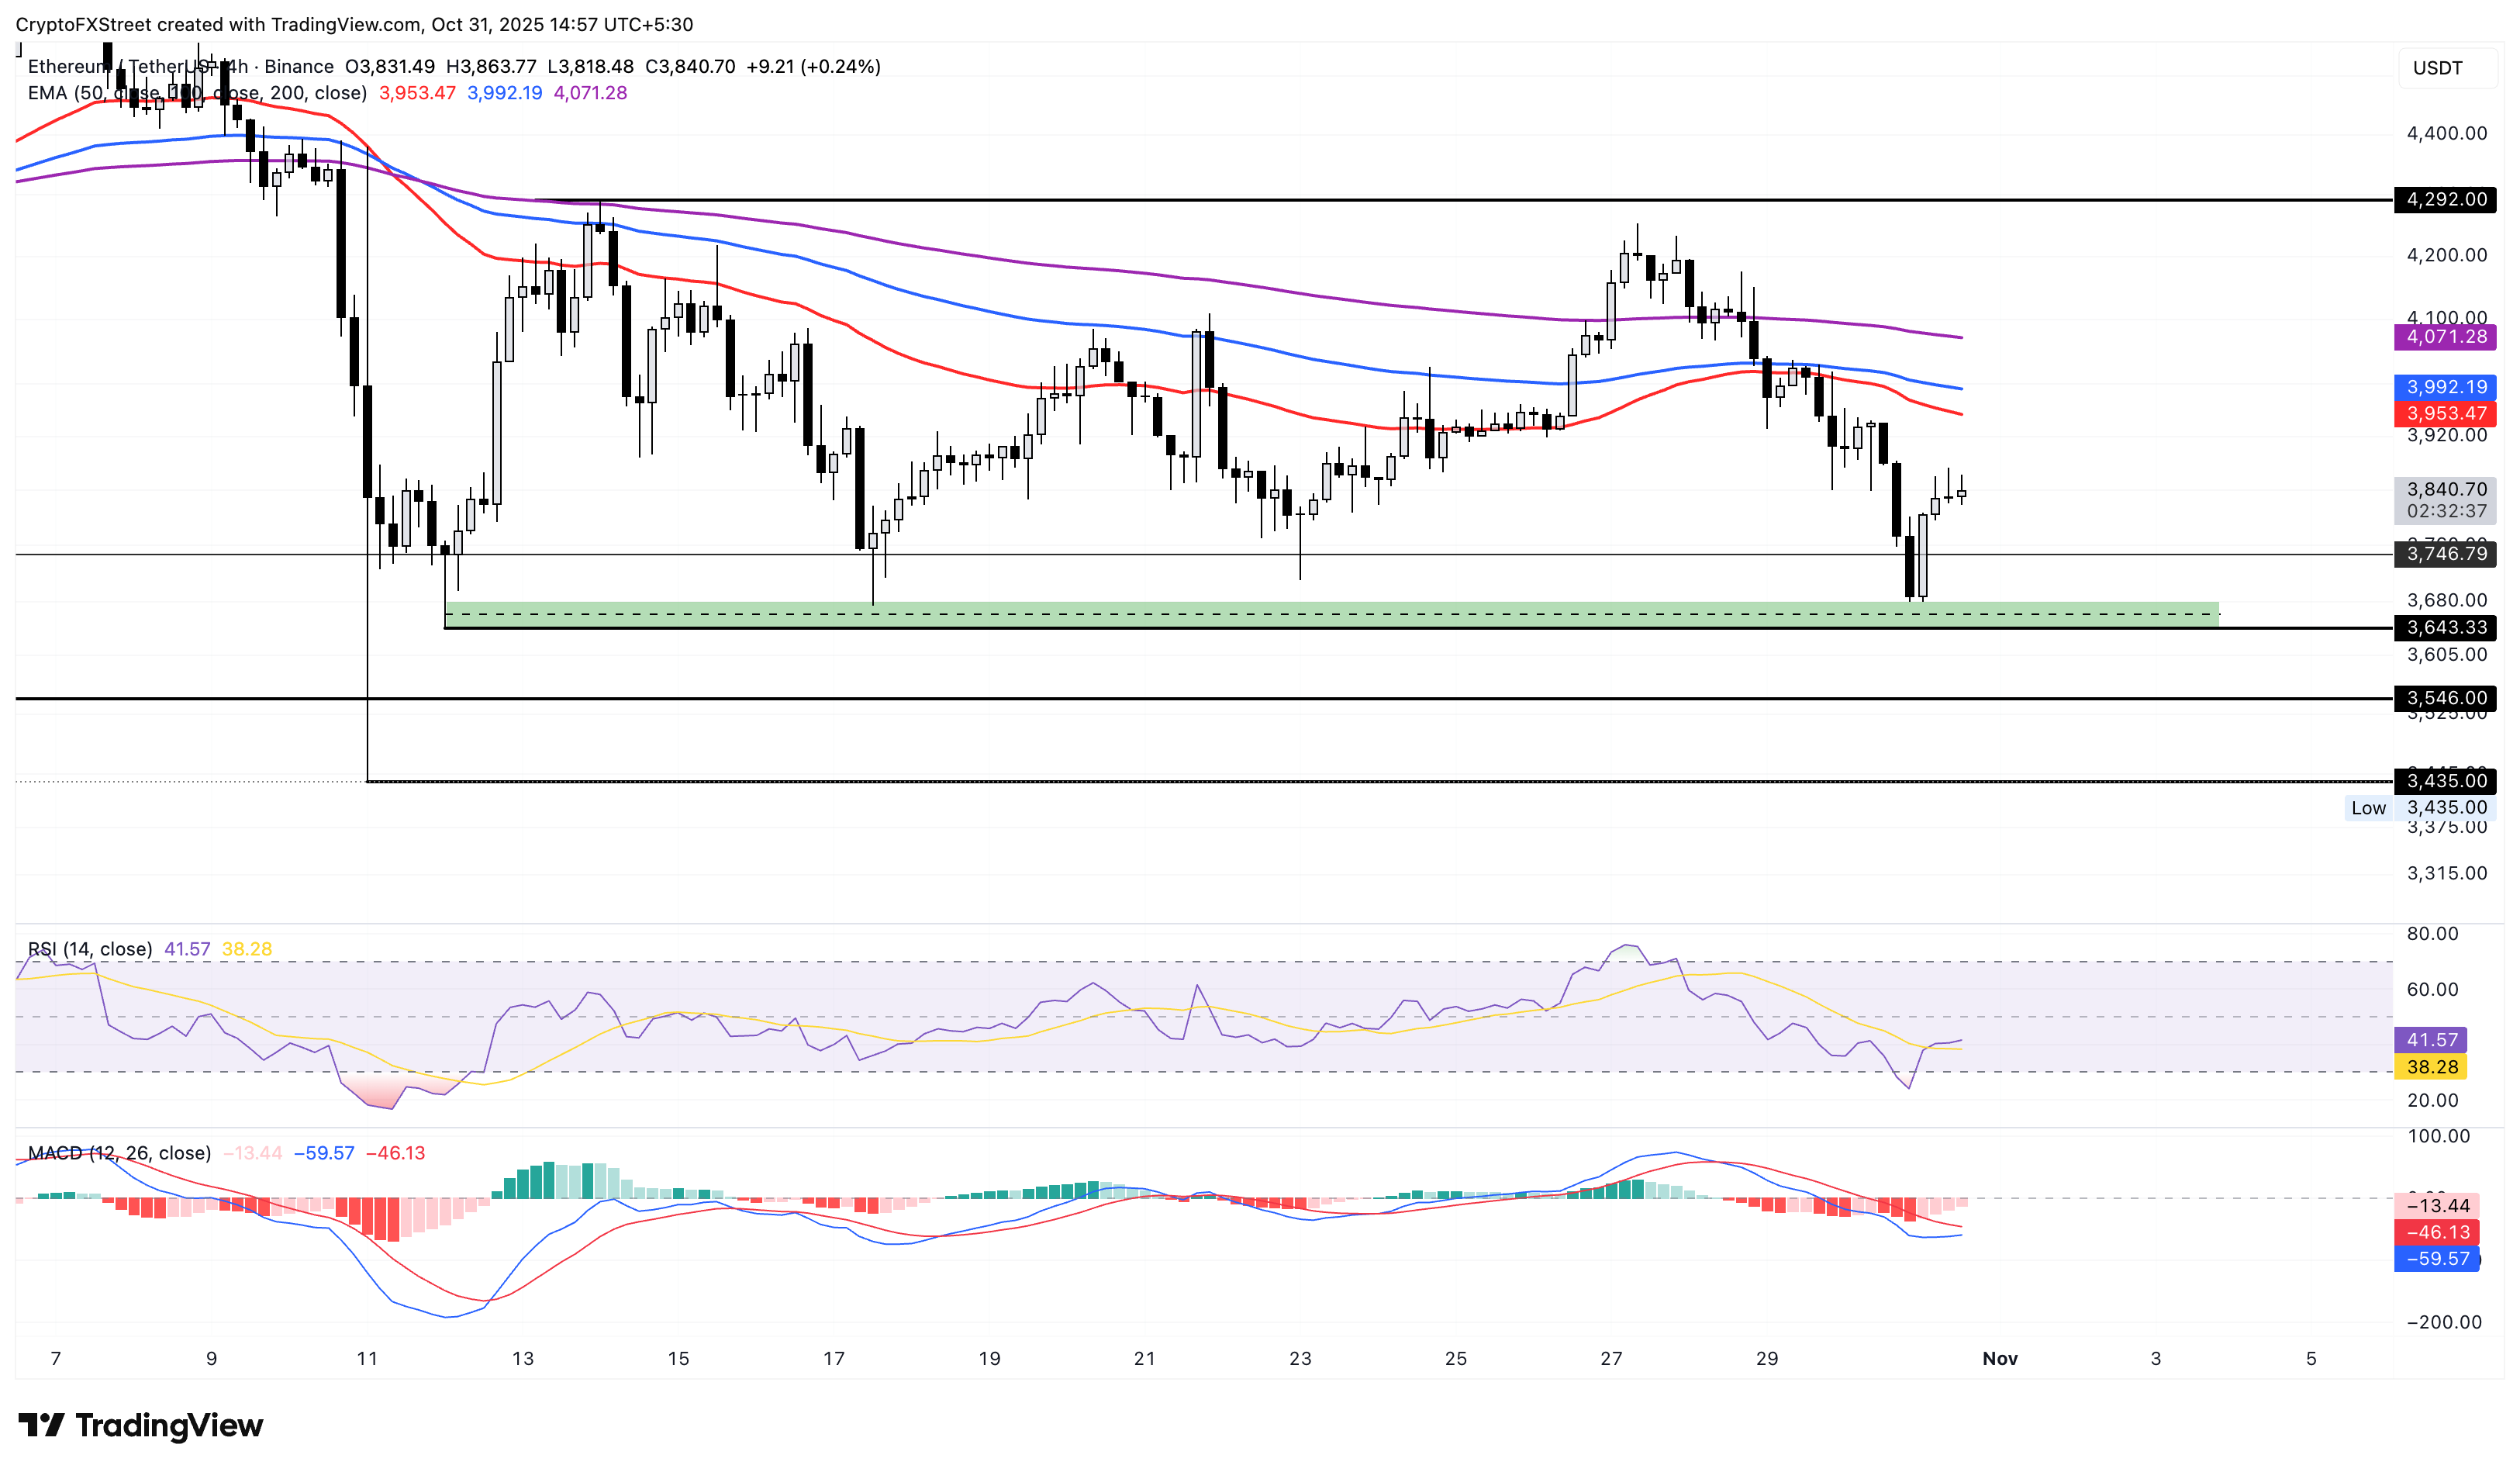
Ethereum’s recovery seen during Friday's Asian session is losing strength near the $3,900 mark on Friday after bouncing off the $3,650 support zone on the 4-hour chart for the third time this month.
Selling pressure hitting the largest altcoin by market capitalization declined suddenly earlier in the day, as indicated by the V-shaped reversal in RSI to 41 from the oversold zoneSelling pressure, hitting the largest altcoin by market capitalization, declined suddenly earlier in the day, as indicated by the V-shaped reversal in RSI to 41, from the oversold zone on the same chart.
Furthermore, the MACD inches closer to the signal line, with traders eyeing a potential crossover which would flash a buy signal.
On the upside, the declining 50-period, 100-period, and 200-period EMAs at $3,953, $3,992, and $4,071, respectively, could act as resistances.

ETH/USDT 4-hour price chart.
Still, a surge in selling pressure could force ETH to retest the $3,650 zone.
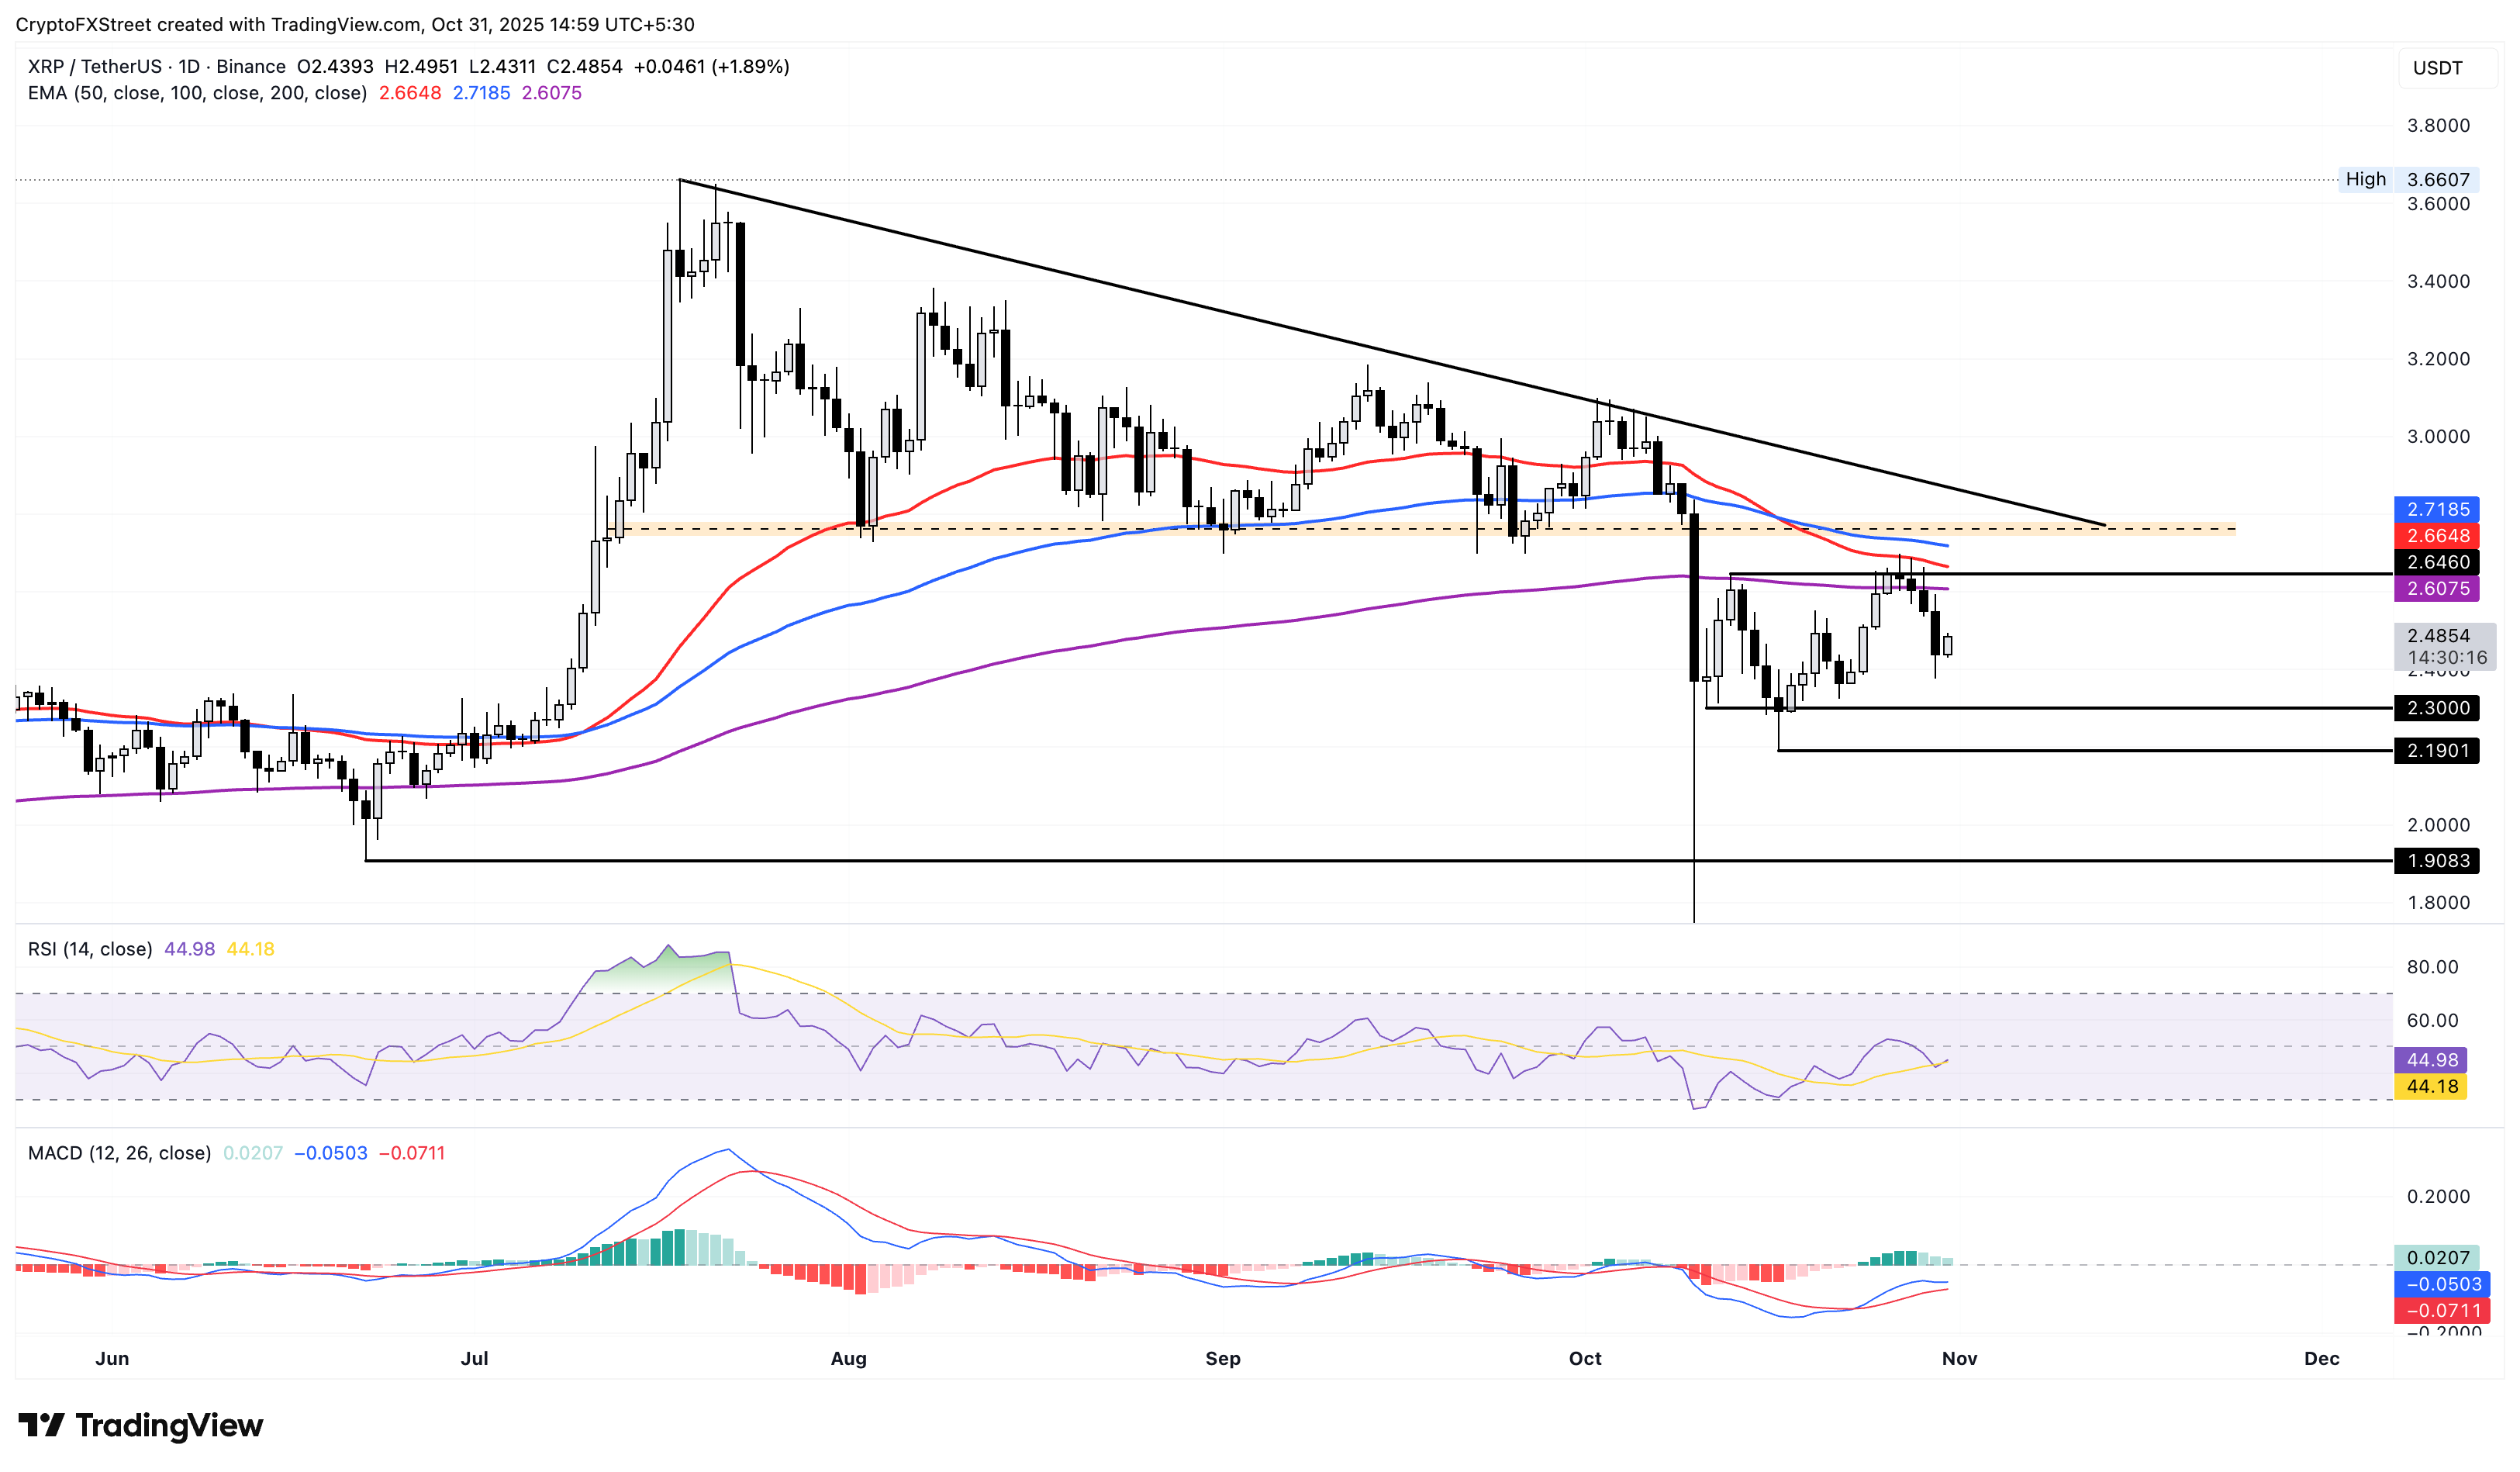
As of XRP, the uptick after the four-day decline this week aims to reclaim the $2.50 mark. However, the prevailing decline in XRP risks a Death Cross pattern between the 50-day and 200-day EMAs, which would be a strong sell signal.
The momentum indicators on the daily chart remain neutral as the RSI at 44 hovers near the midpoint, while the MACD and signal line turn flat on the way to the zero line.
The 200-day EMA at $2.60, followed by the 50-day EMA at $2.66, are the key overhead resistances for XRP.

XRP/USDT daily price chart.
Looking down, key support levels for XRP are at $2.30 and $2.19, marked by October 11 and October 17 lows, respectively.
Bitcoin, altcoins, stablecoins FAQs
Bitcoin is the largest cryptocurrency by market capitalization, a virtual currency designed to serve as money. This form of payment cannot be controlled by any one person, group, or entity, which eliminates the need for third-party participation during financial transactions.
Altcoins are any cryptocurrency apart from Bitcoin, but some also regard Ethereum as a non-altcoin because it is from these two cryptocurrencies that forking happens. If this is true, then Litecoin is the first altcoin, forked from the Bitcoin protocol and, therefore, an “improved” version of it.
Stablecoins are cryptocurrencies designed to have a stable price, with their value backed by a reserve of the asset it represents. To achieve this, the value of any one stablecoin is pegged to a commodity or financial instrument, such as the US Dollar (USD), with its supply regulated by an algorithm or demand. The main goal of stablecoins is to provide an on/off-ramp for investors willing to trade and invest in cryptocurrencies. Stablecoins also allow investors to store value since cryptocurrencies, in general, are subject to volatility.
Bitcoin dominance is the ratio of Bitcoin's market capitalization to the total market capitalization of all cryptocurrencies combined. It provides a clear picture of Bitcoin’s interest among investors. A high BTC dominance typically happens before and during a bull run, in which investors resort to investing in relatively stable and high market capitalization cryptocurrency like Bitcoin. A drop in BTC dominance usually means that investors are moving their capital and/or profits to altcoins in a quest for higher returns, which usually triggers an explosion of altcoin rallies.


