
Maple Finance Price Forecast: SYRUP extends weekly rally as TVL and trading volume surge
- Maple Finance price extends its gains on Wednesday after rallying more than 22% so far this week.
- On-chain data show bullish bias as TVL rises while trading volume reaches the highest since the end of August.
- The technical outlook suggests rally continuation targeting $0.53 mark.
Maple Finance (SYRUP), price continues to trade in green above $0.45 on Wednesday, having rallied more than 22% so far this week. The surge in price is further supported by SYRUP’s rising Total Value Locked (TVL), with trading volume reaching its highest point since the end of August. On the technical side, the token suggests a rally continuation, with bulls aiming for the $0.53 mark.
On-chain data reflects growing investor interest and confidence
DefiLlama data shows that Maple Finance TVL increases to $2.88 billion on Wednesday from $2.63 billion on Sunday, nearing its record high of $3.07 billion reached on October 8. Rising TVL indicates growing activity and interest within SYRUP’s ecosystem, suggesting that more users are depositing or utilizing assets within SYRUP-based protocols.
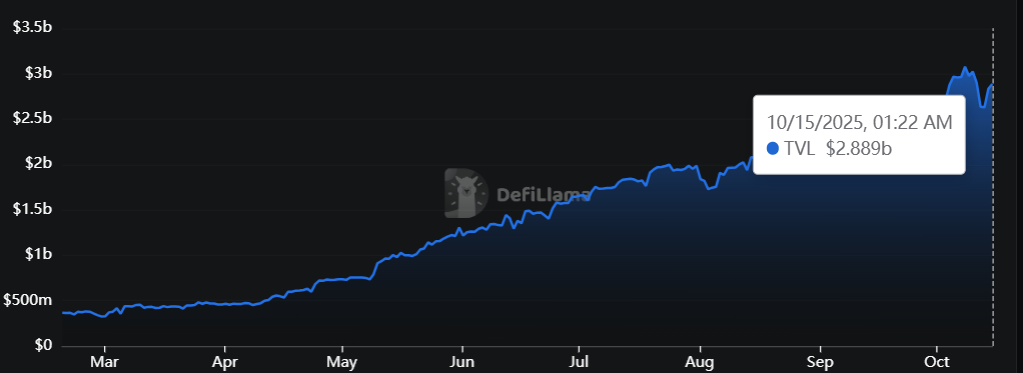
Maple Finance TVL chart. Source: DefiLlama
Santiment data indicate that the SYRUP ecosystem’s trading volume (the aggregate trading volume generated by all exchange applications on the chain) reached $127.86 million on Wednesday, the highest level since the end of August. This volume rise indicates a surge in traders’ interest and liquidity in the Maple Finance chain, boosting its bullish outlook.
 [10-1760506541917-1760506541919.01.07, 15 Oct, 2025].png)
SYRUP trading volume chart. Source: Santiment
Additionally, Maple Finance's lending loan capacity has been constantly rising since early August and reached $6.3 billion on Wednesday, nearing its record high of $6.4 billion. This rise in lending capacity indicates more liquidity is available for borrowers, signaling increased participation or increasing confidence in the protocol.
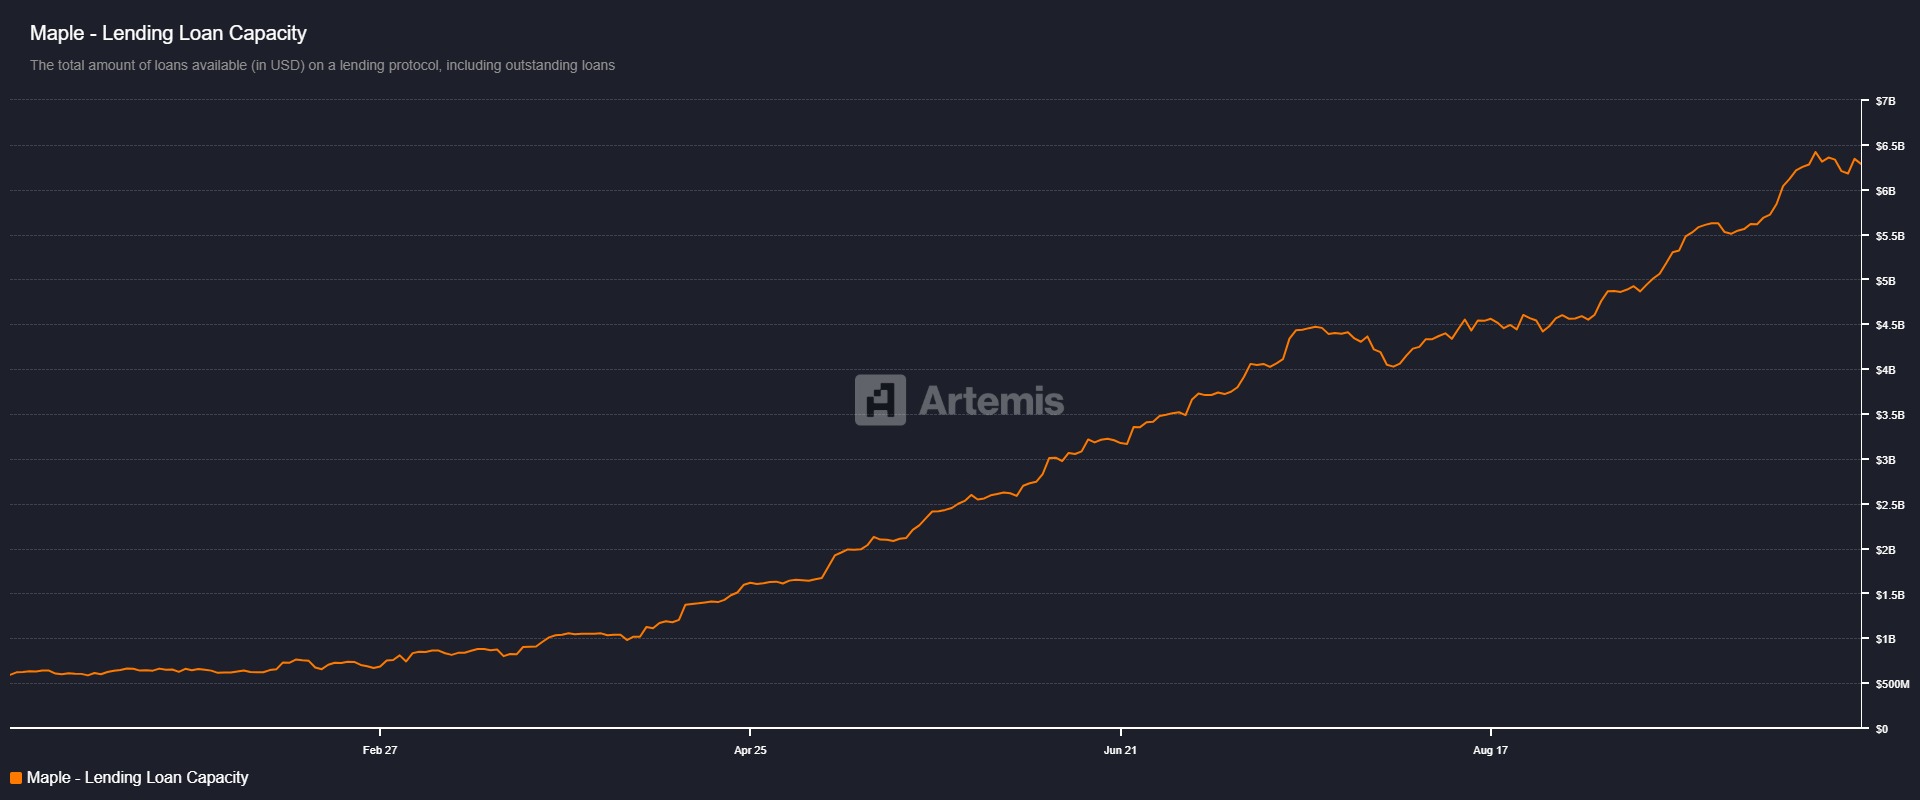
Maple Finance lending loan capacity chart. Source: Artemis
Maple Finance Price Forecast: SYRUP bulls target $0.53 level
Maple Finance price recovered slightly on Saturday after a massive correction on Friday. SYRUP continued its recovery, increasing by over 35% in the next three days, breaking and closing above the descending trendline on Tuesday. At the time of writing on Wednesday, it trades above $0.45.
If SYRUP continues its upward trend, it could extend the rally toward the September 6 high of $0.53. A successful close above this level could extend the gains toward the July 25 high of $0.68.
The Relative Strength Index (RSI) on the daily chart reads 59 above the neutral level of 50, indicating bullish momentum gaining traction. The Moving Average Convergence Divergence (MACD) indicator also showed a bullish crossover on Tuesday, giving buy signals and suggesting an upward trend ahead.
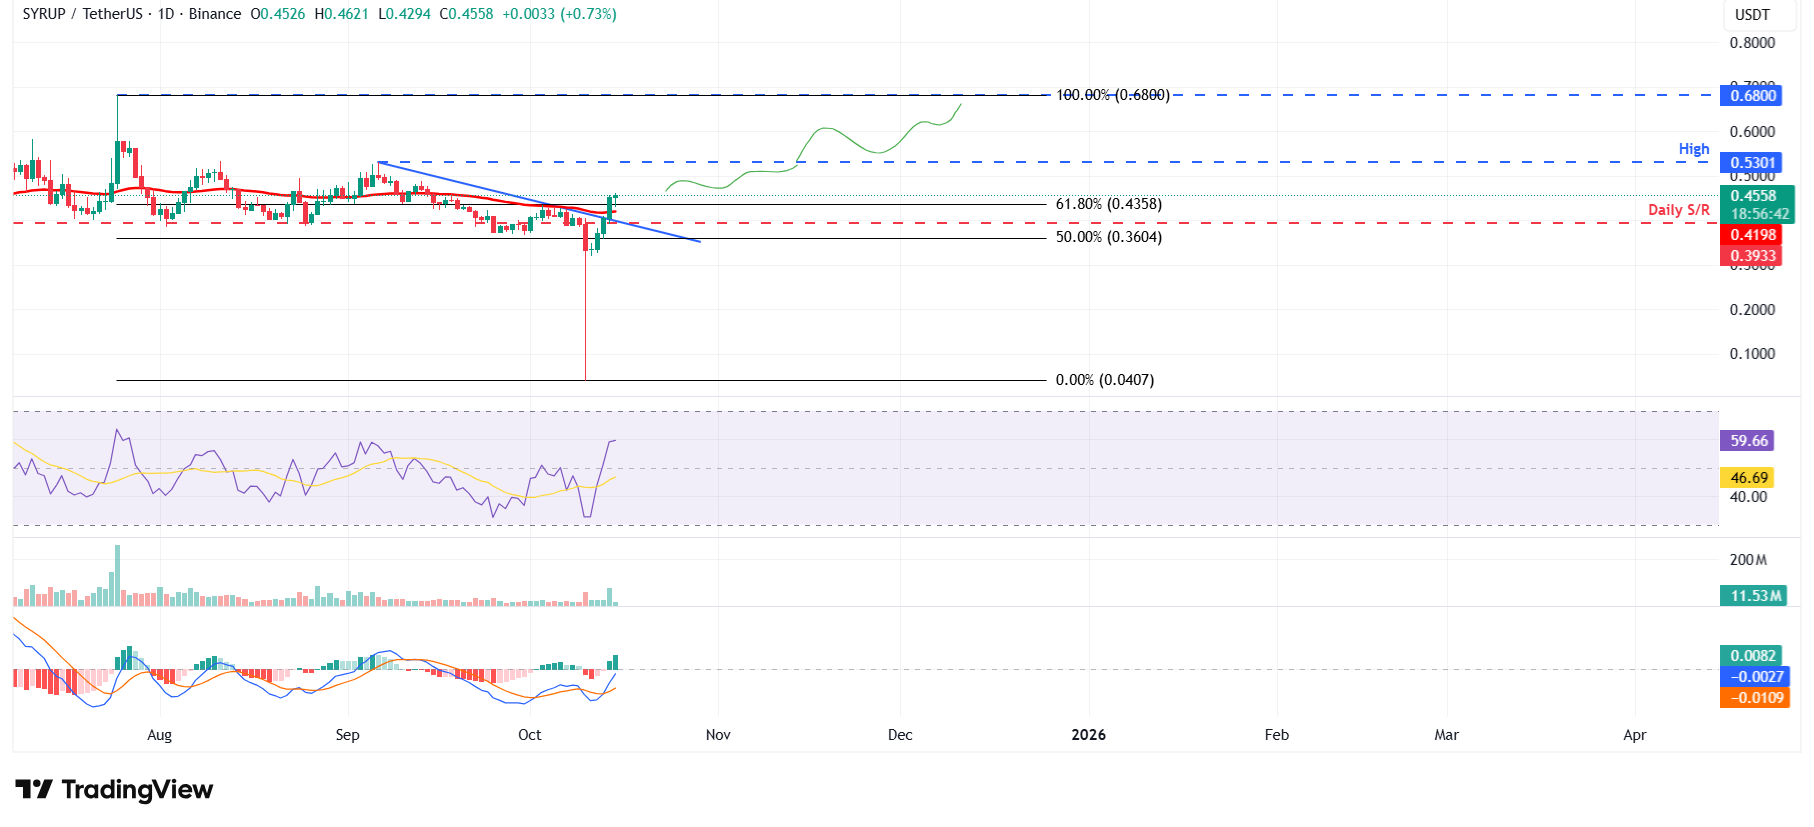
SYRUP/USDT daily chart
However, if SYRUP faces a correction, it could extend the decline toward the daily support at $0.41.
Bài viết đề xuất


