
Bitcoin Cash Price Forecast: BCH flashes breakout potential as retail interest grows
- Bitcoin Cash recovery hits $600, with bulls aiming for a triangle breakout rally on the 4-hour chart.
- On-chain data suggest renewed interest in large wallet investors and reduced profit-taking measures.
- Retail demand for Bitcoin Cash increases, driving its futures Open Interest.
Bitcoin Cash (BCH) trades at $600 by press time on Friday, gaining over 3% on the day and nearing a potential symmetrical triangle breakout on the 4-hour chart. The BCH rally gains traction on rising interest, as seen in the derivatives market and the on-chain holders' activities. Furthermore, a decrease in profit-taking signals lowered headwinds that could boost the uptrend.
Sudden demand surge for Bitcoin Cash
Bitcoin Cash is gaining retail interest in a volatile market, with the futures Open Interest (OI) increasing by 5.56% in the last 24 hours, reaching $454.51 million. The rise in OI refers to an increase in long positions in BCH futures contracts, signaling a risk-on sentiment among traders.
At the same time, the futures OI-weighted funding rate is at 0.0067%, up from 0.0039% earlier on the day, suggesting a renewed positive sentiment among traders after a minor turbulence. This increase in funding rate correlates with the rise in traders leveraging long positions, which could further fuel the intraday rally.
Furthermore, the Long/Short ratio at 1.1088 reflects a larger number of active long positions, cementing the positive sentiment.
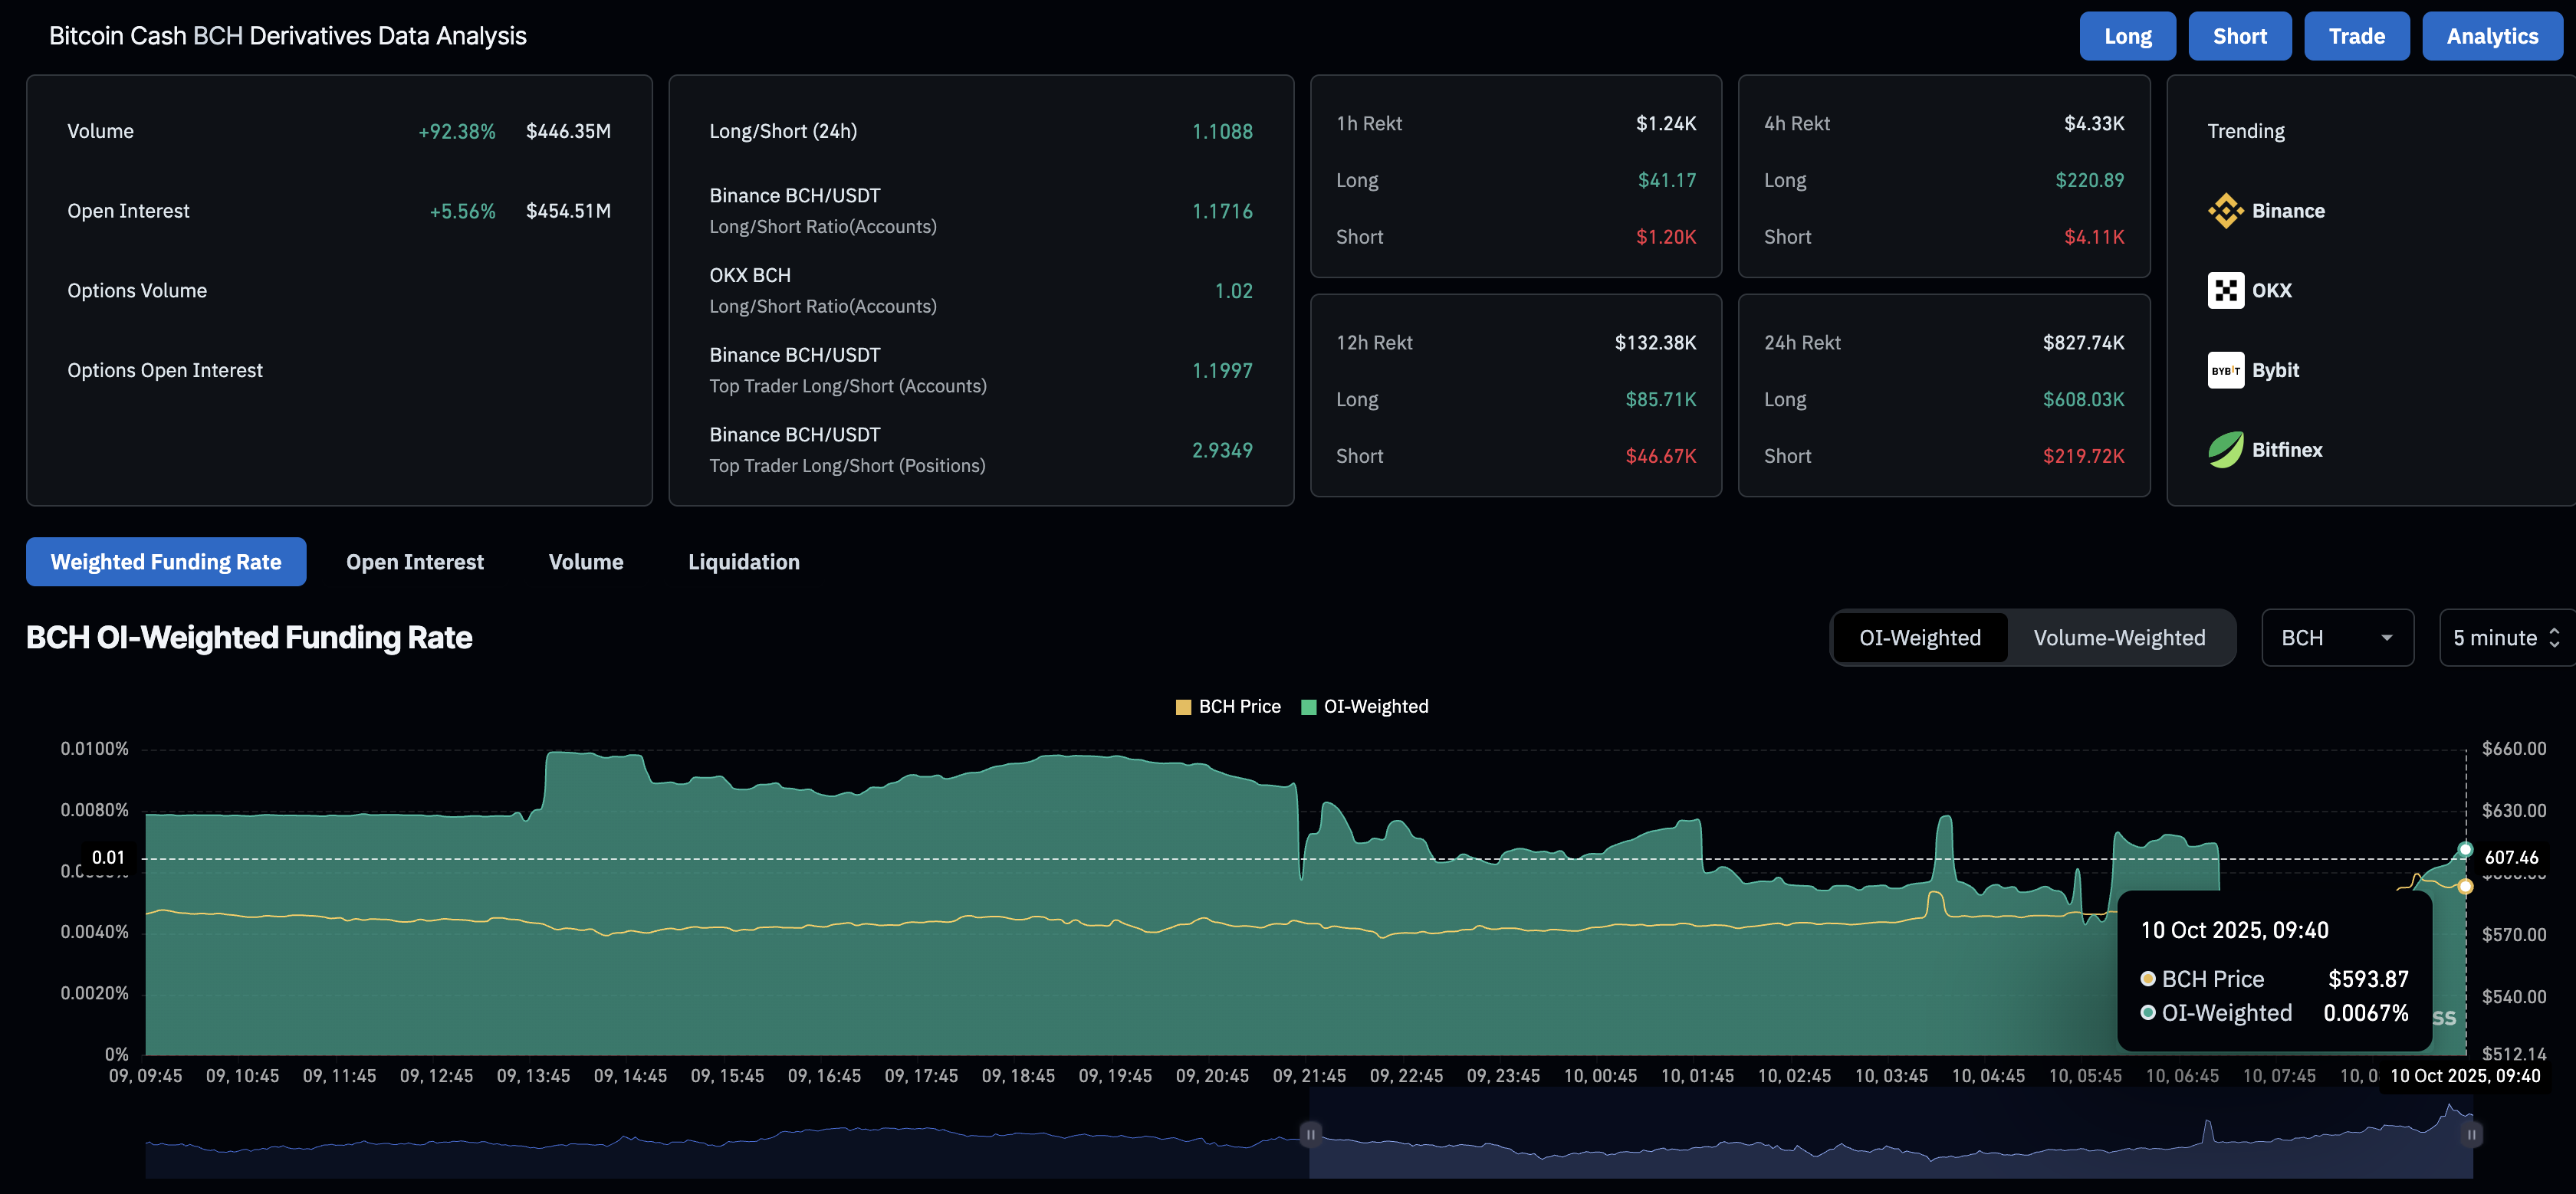
Bitcoin Cash derivatives data. Source: CoinGlass
Large-wallet BCH investors boost optimism
A decrease in profit-booking from BCH holders supports the intraday recovery as selling pressure declines, reflecting increased confidence among investors. Santiment data shows a decline in the Network Realized Profit/Loss (NRPL) to 17.2K BCH, which is booked for profit. Over the last two weeks, the NRPL has remained below 3 million BCH, extending a sideways trend after a volatile week in late September.
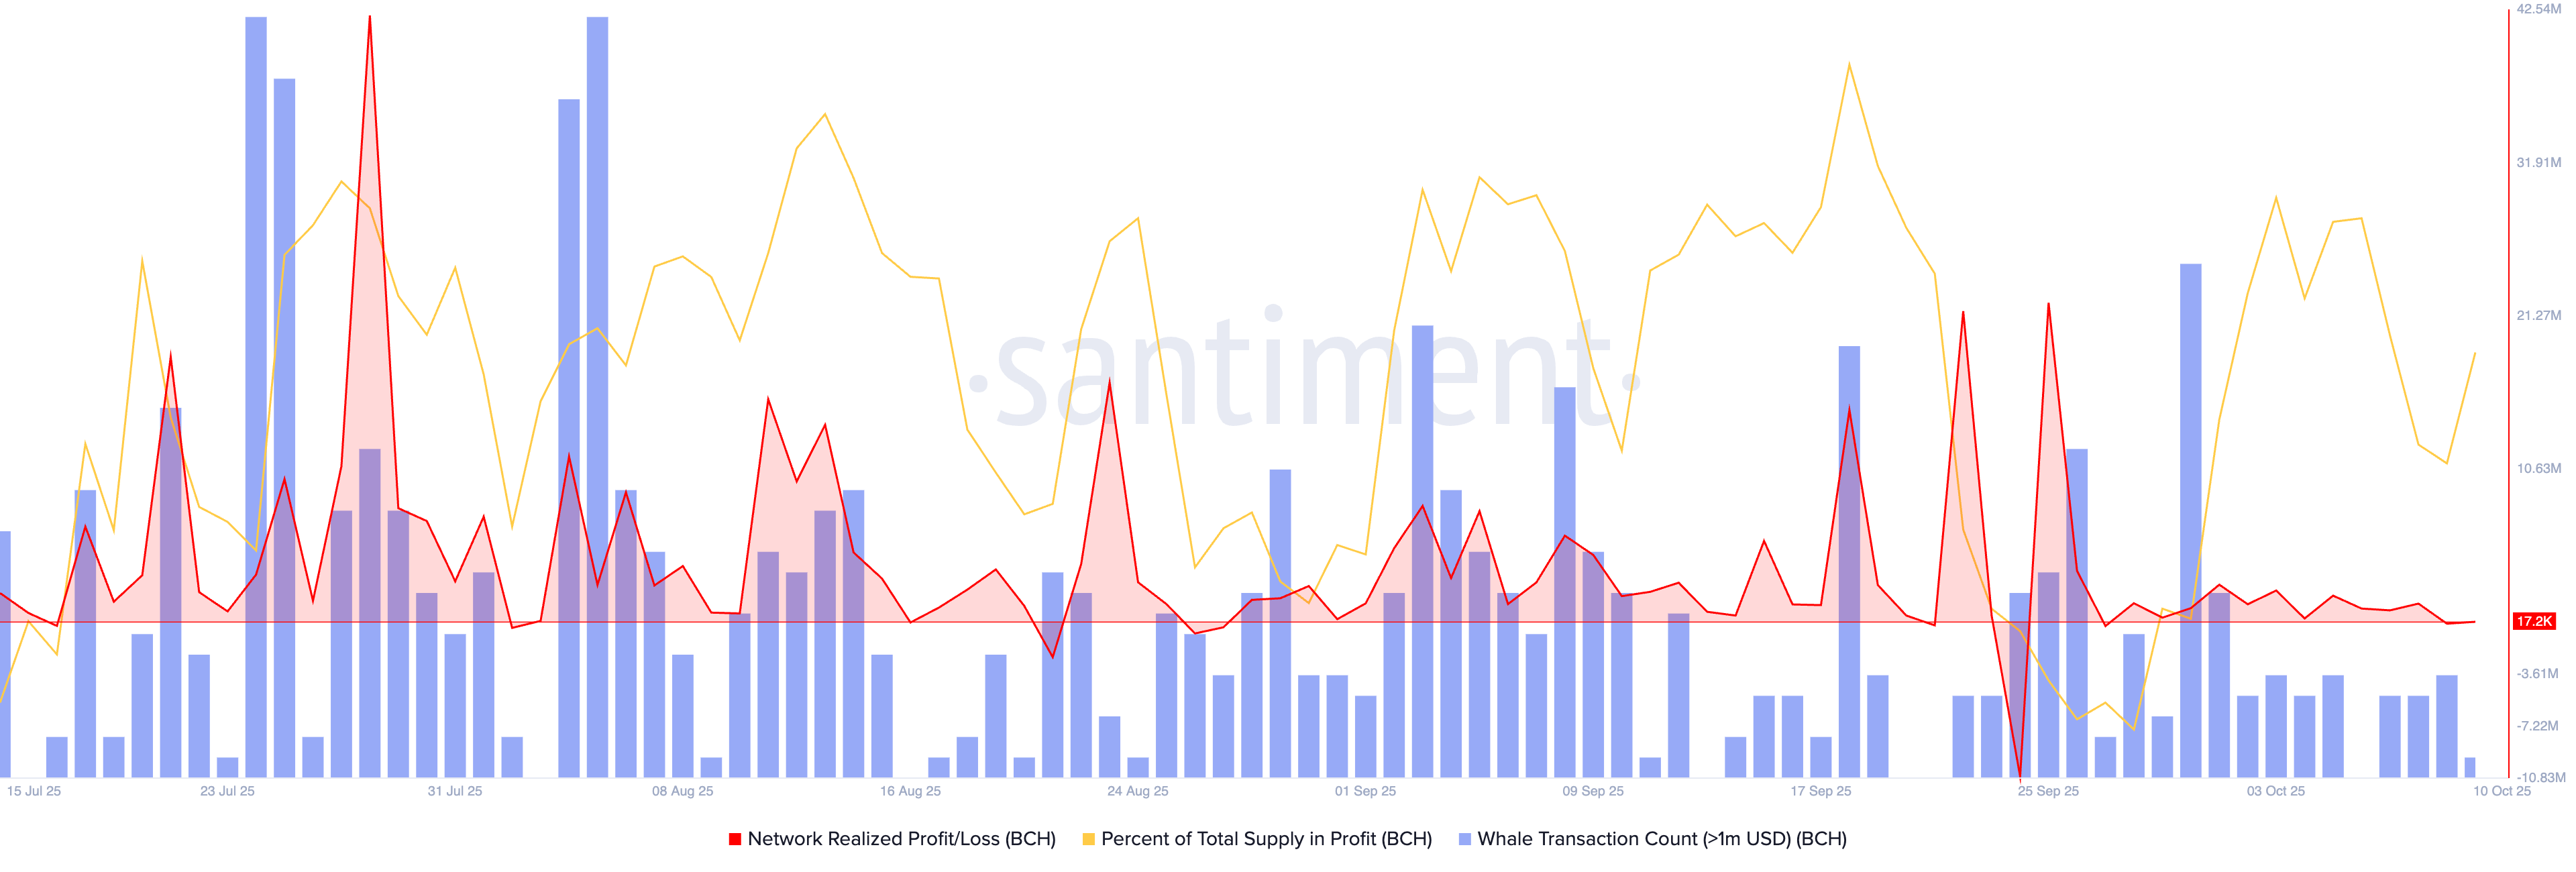
Bitcoin Cash NRPL data. Source: Santiment.
The increase in BCH supply in profit corroborates this decline in selling pressure, reaching 88.23% on Friday, from 83.75% on September 30.
Furthermore, the large-wallet investors with 10,000 to 1 million BCH tokens now hold 8.76 million BCH, up from 8.69 million BCH on August 31, projecting a rise in confidence in Bitcoin Cash.
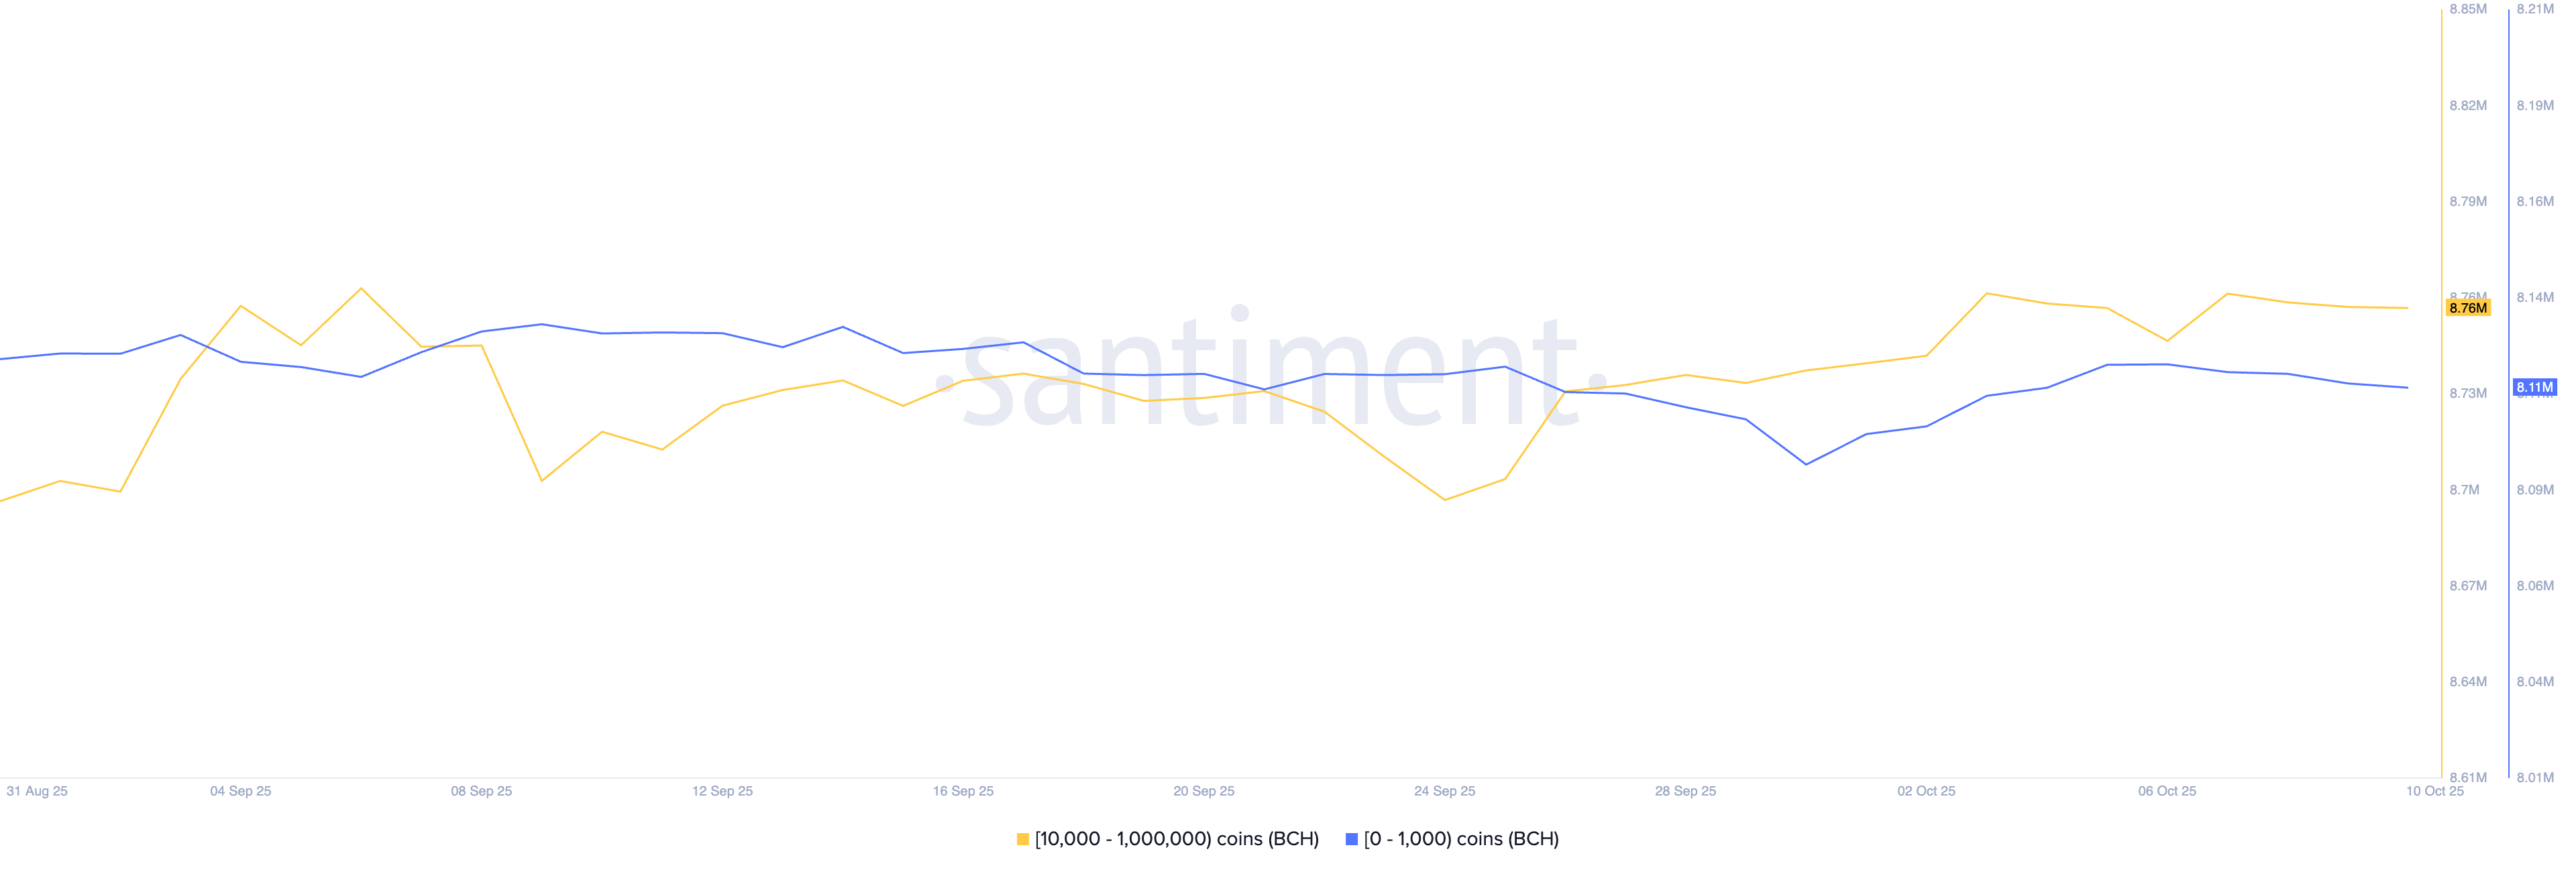
BCH supply distribution. Source: Santiment.
Bitcoin Cash eyes further gains on a potential triangle breakout rally
Bitcoin Cash trades near $600 at the time of writing on Friday, challenging the resistance trendline of a symmetrical triangle pattern on the 4-hour chart. A decisive close above the $600 round figure could confirm the pattern breakout, potentially igniting a breakout rally.
The BCH rally could target the $615 peak from Sunday, followed by the 1.272 Fibonacci retracement level at $628, which is drawn from the $615 peak to Thursday’s low at $568.
The momentum indicators on the 4-hour chart suggest a sharp bullish shift as the Relative Strength Index (RSI) spikes to 64, with room for further growth before reaching the overbought zone. At the same time, the Moving Average Convergence Divergence (MACD) crosses above its signal line, resulting in a crossover, which signals a bullish trend reversal.
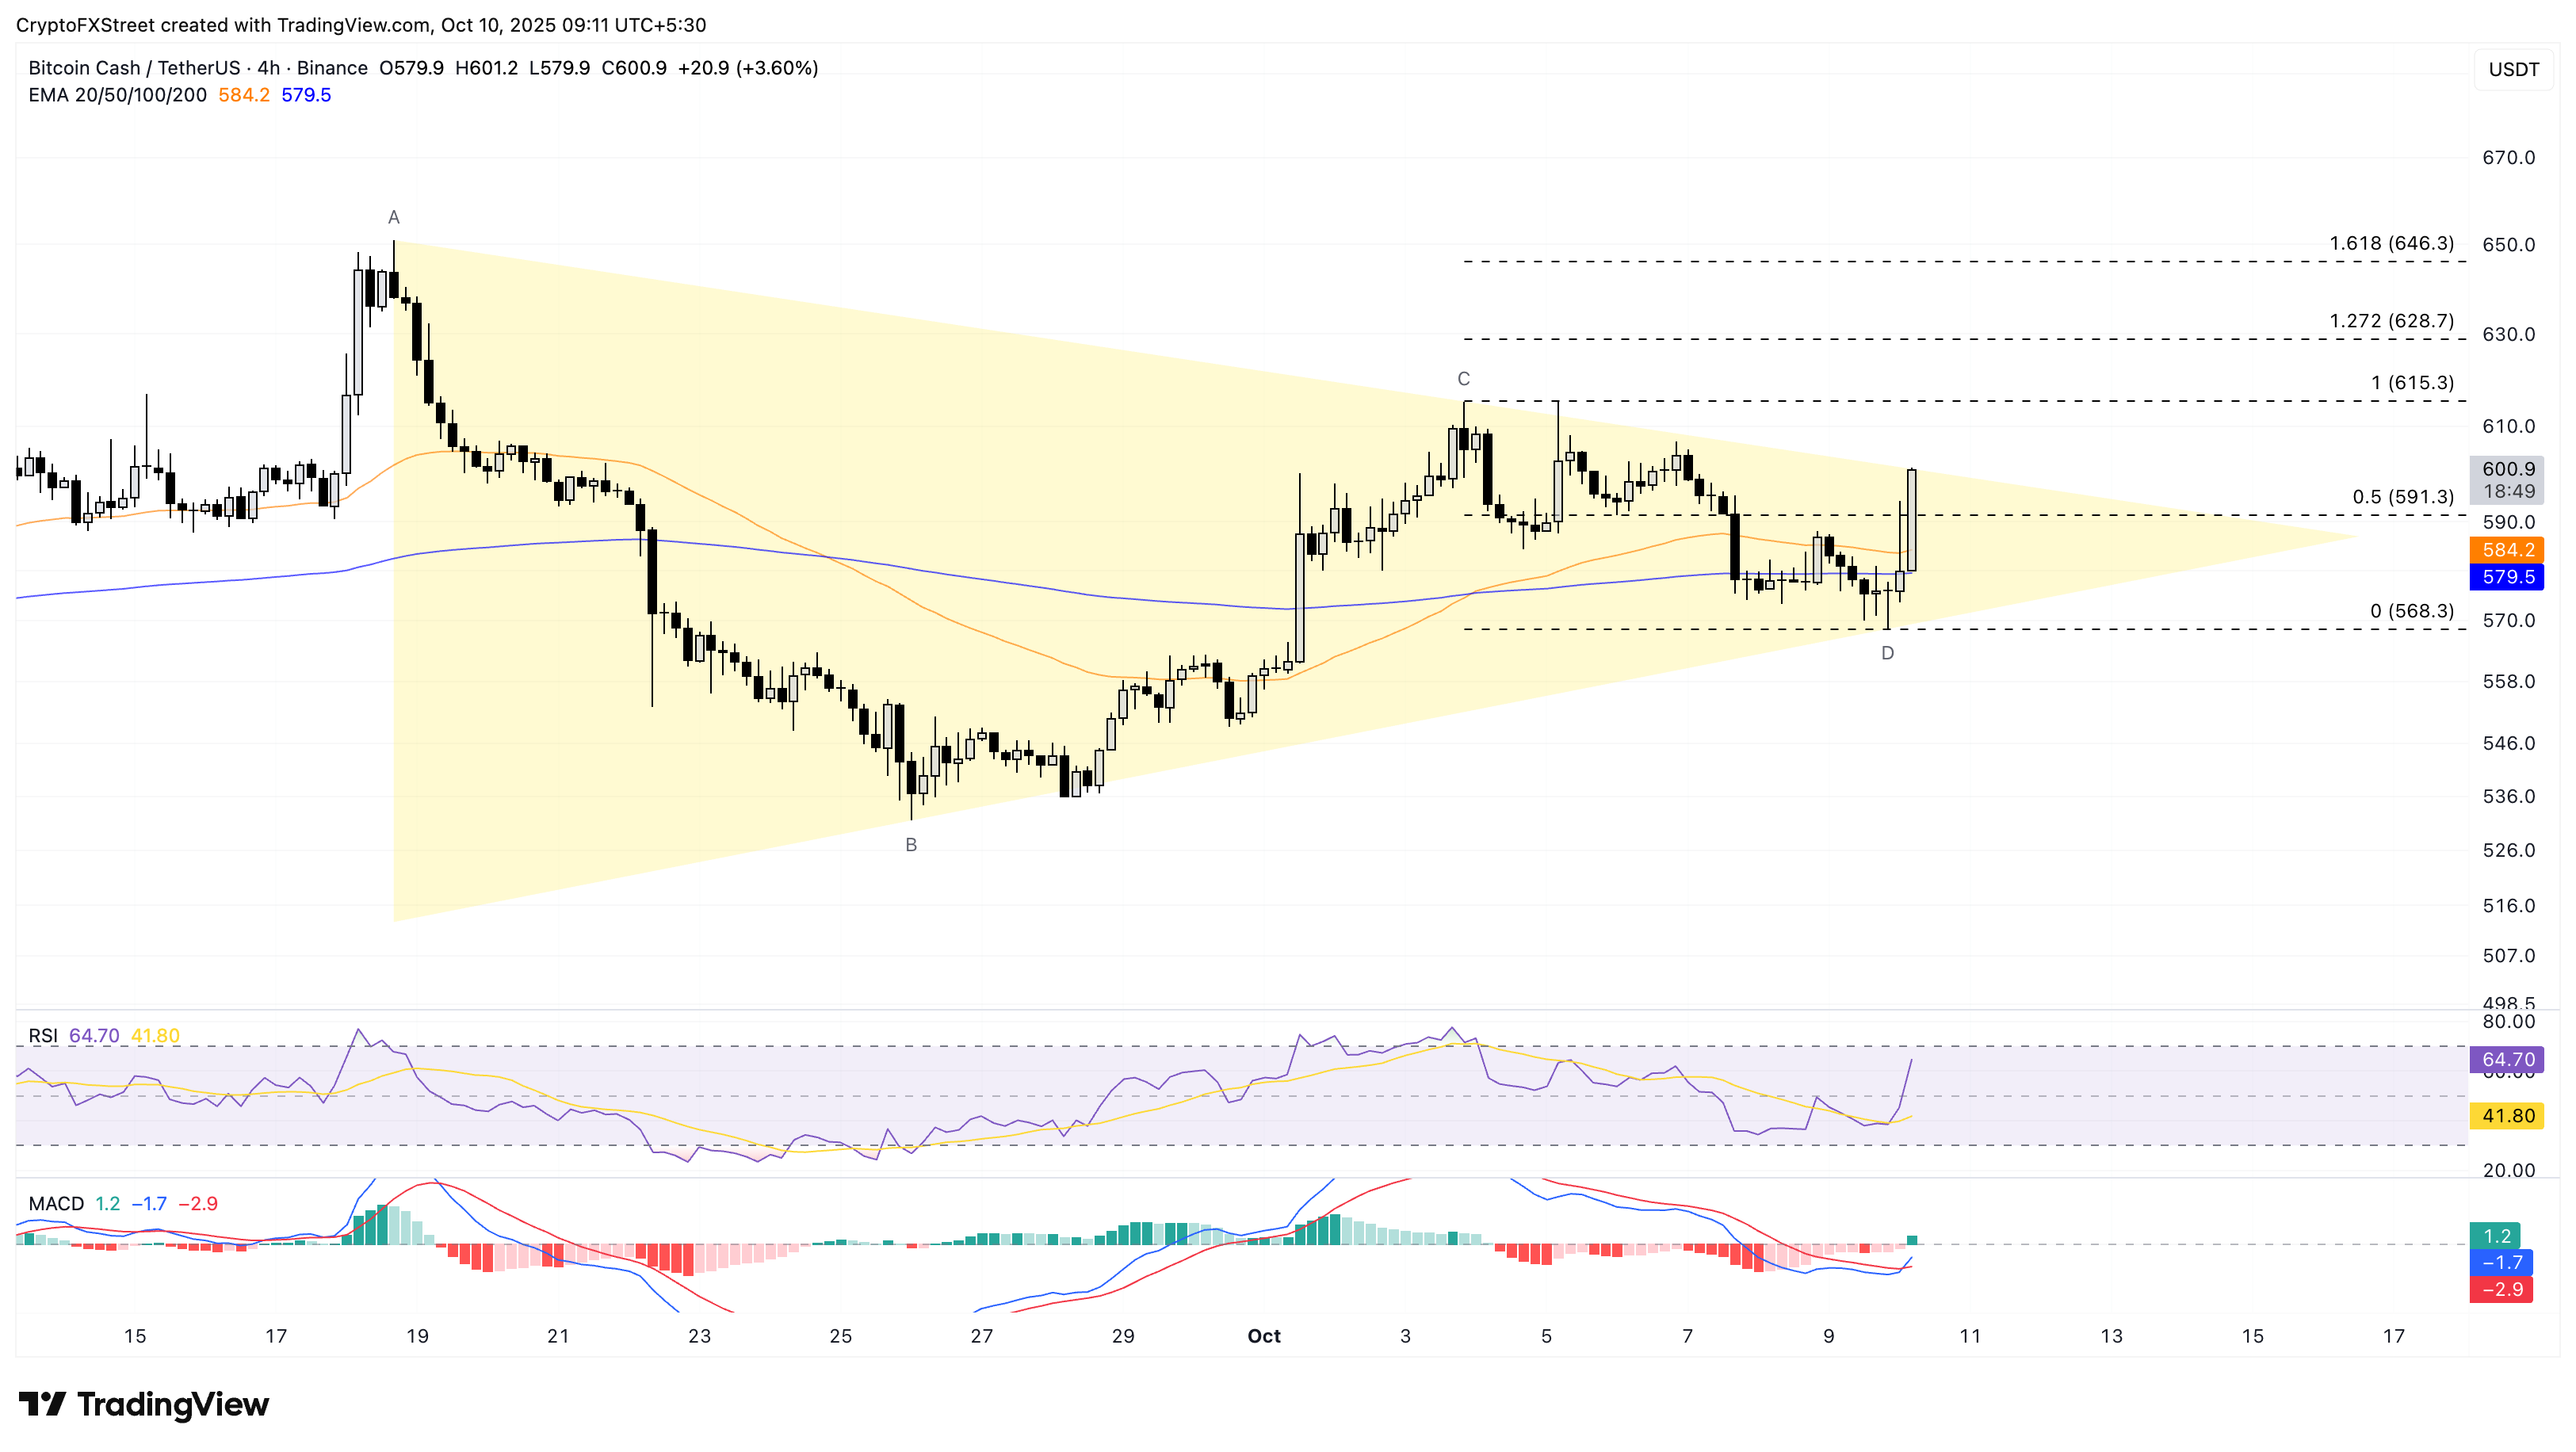
BCH/USDT daily price chart.
On the other hand, a reversal within the triangle pattern from $600 could test the 200-day Exponential Moving Average (EMA) at $579.
Bài viết đề xuất


