
Bitcoin Price Forecast: BTC reclaims $114,000 as US equities hit record highs, ETF inflows top $757 million
- Bitcoin price trades above $114,000 after closing above the 50-day EMA resistance.
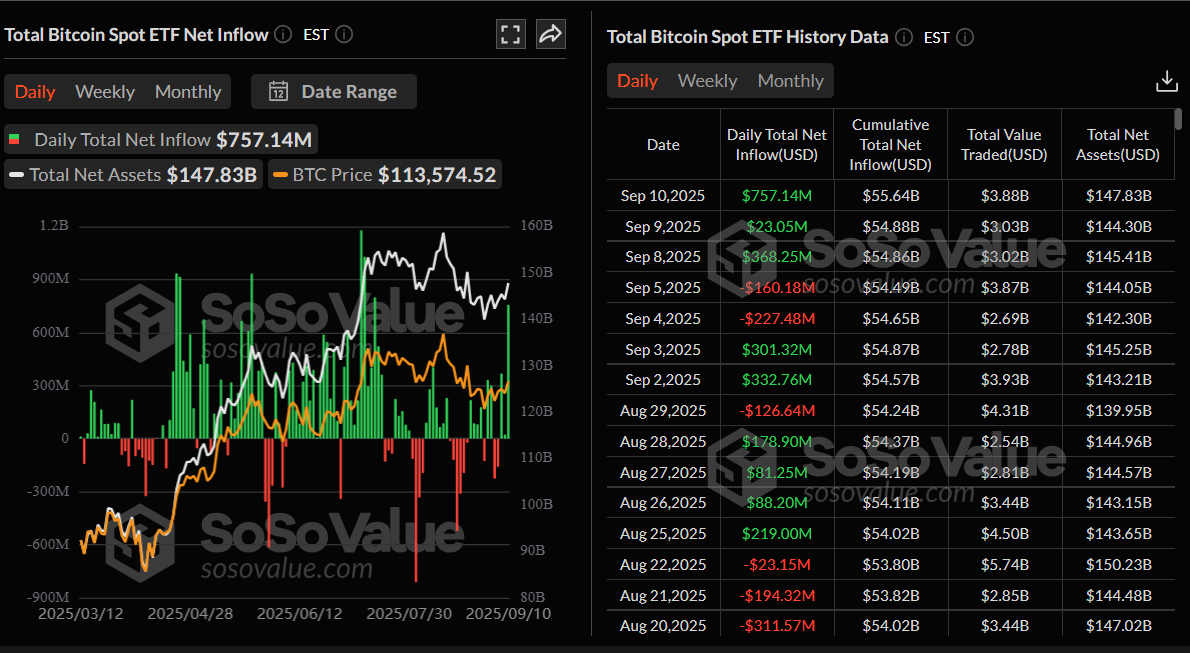
- US Bitcoin ETFs record $757 million inflows, the highest in a single day since mid-July.
- S&P 500 and Nasdaq post record highs at Wednesday’s close, boosting risk sentiment.
- Market participants await US inflation data for clues on the potential Fed monetary easing pace.
Bitcoin (BTC) price reclaims above $114,000 at the time of writing on Thursday after breaking above the key resistance zone the previous day. The bullish momentum is further supported by a surge of $757 million in US Bitcoin ETF inflows — the highest since mid-July — alongside record highs in the S&P 500 and Nasdaq, which boosted overall risk sentiment. Traders now turn their focus to upcoming US inflation data for clues on the potential Federal Reserve’s (Fed) monetary easing pace.
Fed rate cut bets fuel risk-on rally
Bitcoin price soared above $114,000 on Wednesday, reaching a high of $114,313 that same day as the overall market sentiment turned risk-positive. The S&P 500 and Nasdaq posted record highs at Wednesday's close, while Japan’s Nikkei 225 index jumped over 1% to hit a fresh record high on Thursday.
The positive tone around the crypto and equities markets emerged as the US macroeconomic data released on Wednesday showed that the US Producer Price Index (PPI) declined to 2.6% on a yearly basis in August, from 3.1% in the previous month. The core PPI, which excludes food and energy prices, came in at 2.8% YoY compared to 3.4% in July. The lack of producer price pressures, despite import tariffs, could be seen as a sign of softening domestic demand against the backdrop of a struggling US labor market. This, in turn, reaffirms market expectations that the US Federal Reserve (Fed) will cut interest rates at its policy meeting next week, boosting risk-on sentiment, which supported BTC price.
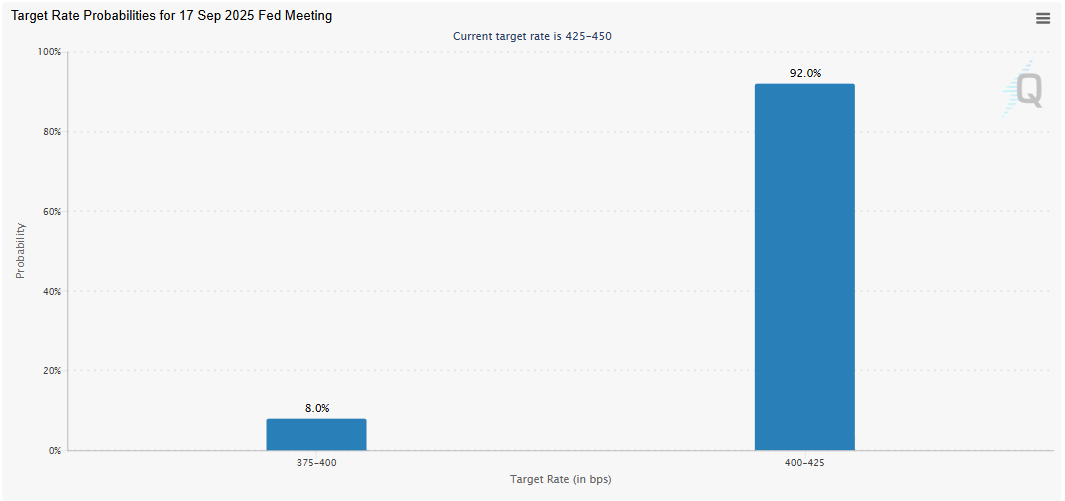
The CME Group FedWatch tool shows a 92% possibility of a 25-basis-point (bps) rate cut by the US central bank at September’s meeting and an 8% chance of a jumbo 50 bps cut. Expectations regarding the Fed's monetary easing pace may weigh on the US Dollar (USD) and boost risk-on sentiment, supporting a recovery in riskier assets, such as BTC.
Market participants await the release of the US Consumer Price Index (CPI) later in the day, which will provide more clues on potential Fed monetary policy easing and play a key role in influencing the near-term BTC price dynamics and determining the next leg of its directional move.
Highest single-day ETF inflow since mid-July
Bitcoin price was further supported by rising institutional demand. The SoSoValue data shows that Bitcoin spot ETFs record an inflow of $757.14 million on Wednesday, continuing the three-day streak of inflows this week. Moreover, Wednesday’s inflow was the highest single-day flow since July 17, signaling renewed institutional demand. If this inflow continues and intensifies, BTC could experience further price recovery.
Net stablecoin inflow reaches a yearly high
CryptoQuant data shows that Binance recorded its highest net stablecoin inflow of over $6.2 billion on Monday. Additionally, Binance’s available stablecoin reserves have also reached a new all-time high, now close to $39 billion.
Since stablecoins are generally considered a form of dry powder for buying crypto, rising reserves suggest that traders and investors are holding more liquidity on Binance, ready to deploy. In short, high stablecoin reserves on Binance signal strong market liquidity and potential buying power, which often supports BTC’s price action.
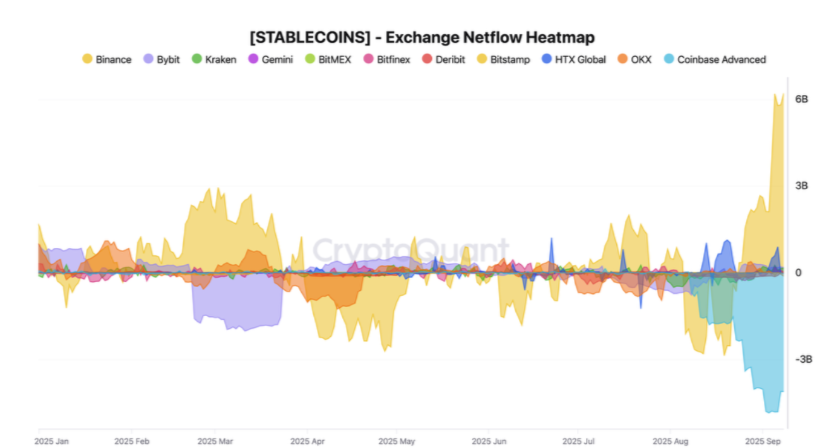
Stablecoin Exchange netflow chart. Source: CryptoQuant
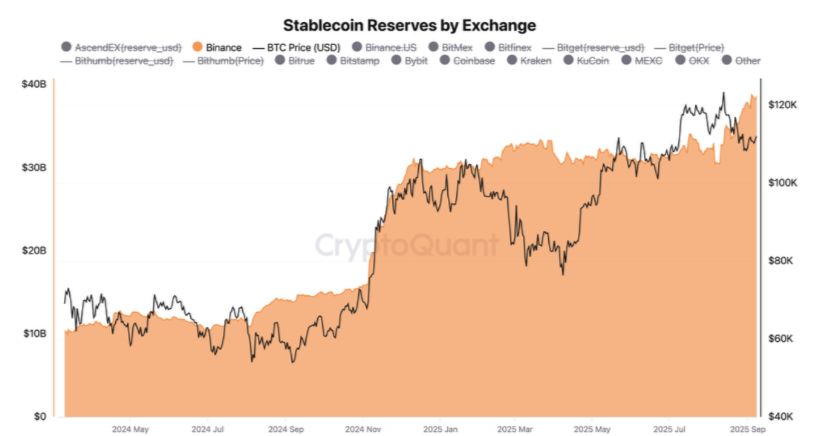
Stablecoin reserve on the Binance exchange chart. Source: CryptoQuant
Bitcoin Price Forecast: BTC closes above its 50-day EMA
Bitcoin price extended its recovery on Monday, reaching the 50-day Exponential Moving Average (EMA) at $112,981 the following day, but faced rejection around that level the next day. However, on Wednesday, it rallied 2.16% closing above the 50-day EMA. At the time of writing on Thursday, it trades at around $114,000.
If BTC finds support around the 50-day EMA at $112,981, it could extend the rally toward its next daily resistance at $116,000. A successful close above the latter could extend gains toward its key psychological level at $120,000.
The Relative Strength Index (RSI) on the daily chart reads 54, which is above its neutral level of 50, showing that bullish momentum is gaining traction. The Moving Average Convergence Divergence (MACD) indicator displayed a bullish crossover on Saturday, which remains in effect, indicating sustained bullish momentum and an upward trend ahead.
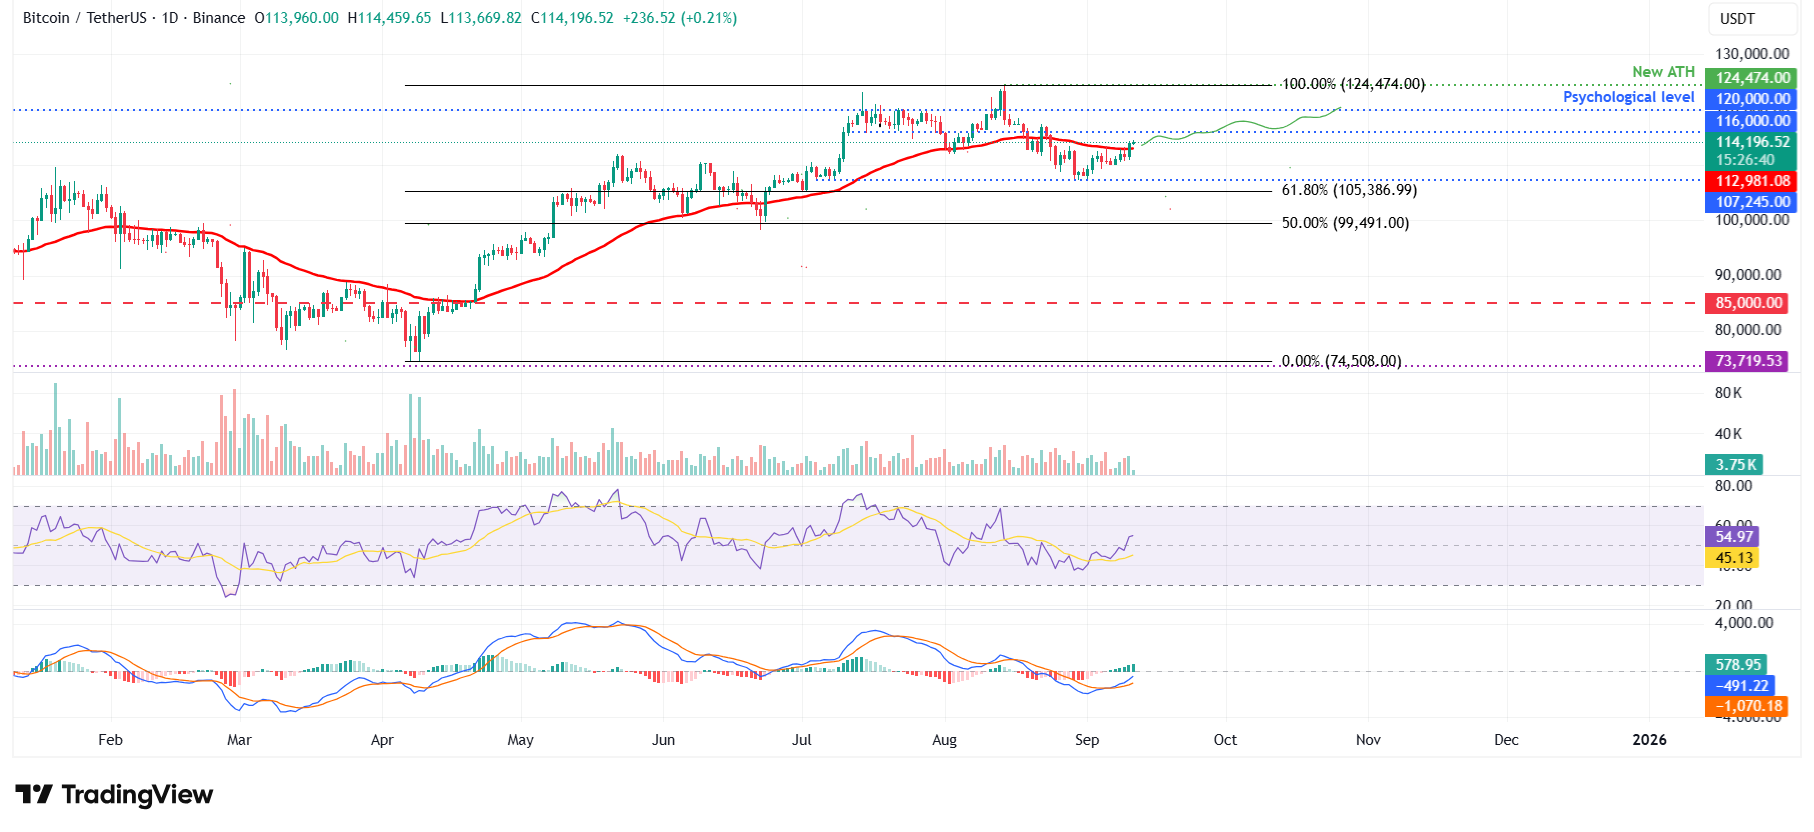
BTC/USDT daily chart
On the contrary, if BTC faces a correction, it could extend the decline toward its daily support at $107,245.
Bitcoin, altcoins, stablecoins FAQs
Bitcoin is the largest cryptocurrency by market capitalization, a virtual currency designed to serve as money. This form of payment cannot be controlled by any one person, group, or entity, which eliminates the need for third-party participation during financial transactions.
Altcoins are any cryptocurrency apart from Bitcoin, but some also regard Ethereum as a non-altcoin because it is from these two cryptocurrencies that forking happens. If this is true, then Litecoin is the first altcoin, forked from the Bitcoin protocol and, therefore, an “improved” version of it.
Stablecoins are cryptocurrencies designed to have a stable price, with their value backed by a reserve of the asset it represents. To achieve this, the value of any one stablecoin is pegged to a commodity or financial instrument, such as the US Dollar (USD), with its supply regulated by an algorithm or demand. The main goal of stablecoins is to provide an on/off-ramp for investors willing to trade and invest in cryptocurrencies. Stablecoins also allow investors to store value since cryptocurrencies, in general, are subject to volatility.
Bitcoin dominance is the ratio of Bitcoin's market capitalization to the total market capitalization of all cryptocurrencies combined. It provides a clear picture of Bitcoin’s interest among investors. A high BTC dominance typically happens before and during a bull run, in which investors resort to investing in relatively stable and high market capitalization cryptocurrency like Bitcoin. A drop in BTC dominance usually means that investors are moving their capital and/or profits to altcoins in a quest for higher returns, which usually triggers an explosion of altcoin rallies.
Bài viết đề xuất


