
Bitcoin Price Forecast: BTC recovers as Bitcoin Asia kicks off in Hong Kong
- Bitcoin recovers above $113,000 on Thursday after finding support around the 100-day EMA earlier this week.
- Bitcoin Asia kicks off in Hong Kong on Thursday, highlighting the growing adoption and acceptance of BTC in the continent.
- Market outlook remains cautious, with neutral spot demand neutral and perpetuals leaning bearish but fragile.
Bitcoin (BTC) recovers above $113,000 at the time of writing on Thursday after finding support around a key level earlier this week. As attention turns to the start of the Bitcoin Asia conference in Hong Kong, this recovery has been boosted slightly. However, traders remain cautious as spot demand stays neutral and perpetual futures sentiment appears fragile.
Bitcoin recovers as conference in Asia begins
Bitcoin is trading above $113,000 on Thursday, showing resilience after a 12% pullback from its mid-August record high of $124,474. The market sentiment boosts slightly as the start of Bitcoin Asia conference in Hong Kong on Thursday is expected to draw 15,000 attendees, making it the second-largest global Bitcoin event.
This two-day event highlights the growing adoption and acceptance of BTC in Asia. The Asia Pacific region accounted for 43% of the world’s crypto ownership in 2023, with strong momentum across Indonesia, Thailand, Vietnam and the Philippines.
Apart from these countries, Hong Kong is also stabilizing itself as a global hub for cryptocurrencies with its recent “Policy Statement 2.0” and the Stablecoins Ordinance, emerging as China’s testing ground for cryptocurrency assets in the country, given that the industry is banned on the mainland.
The event will feature more than 200 speakers from across the globe, including recently announced leaders such as Blockstream CEO Adam Back, Binance founder Changpeng Zhao and entrepreneur Balaji Srinivasan, who purchased a private island and transformed it into “The Network School”.
Institutional demand remains steady
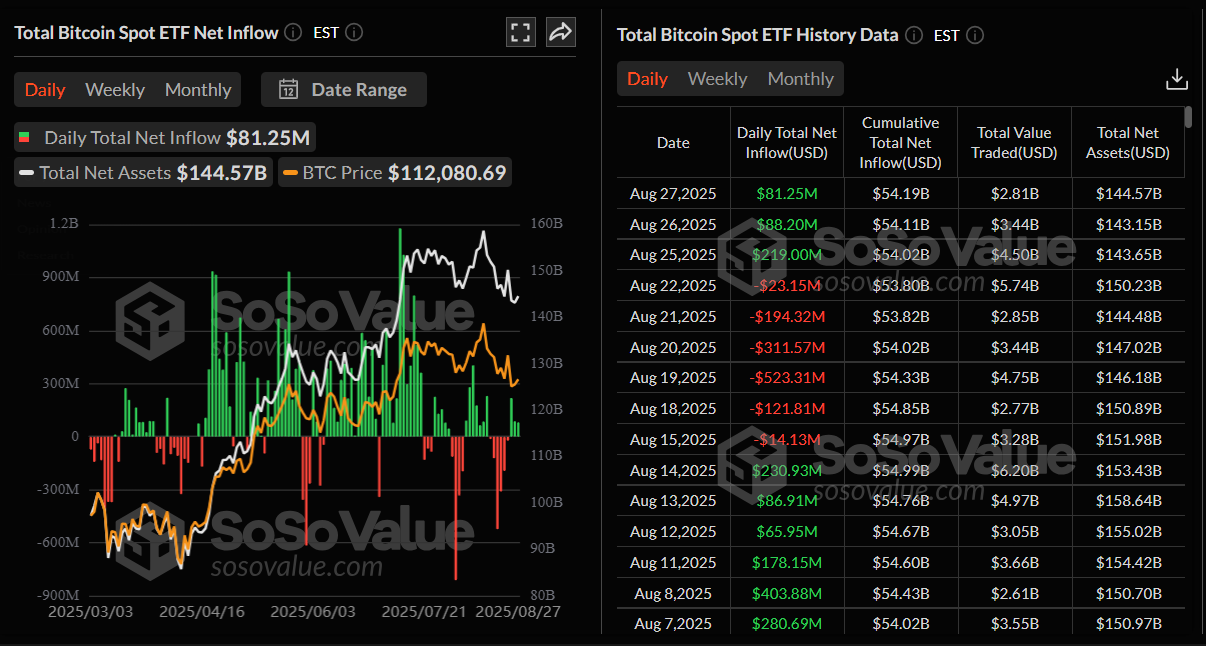
Bitcoin’s institutional demand has remained steady so far this week. SoSoValue data show that Bitcoin Spot ETFs recorded a mild inflow of $81.25 million on Wednesday, continuing its three-day streak of inflow since Monday. If the inflows continue and intensify, BTC could see a recovery ahead.
Some signs to watch for
A Glassnode report on Wednesday highlighted that BTC spot demand remained neutral and perpetuals leaned bearish but were fragile.
The chart below shows that the 30-day moving average of Cumulative Volume Delta (CVD) against its 180-day median across major venues, such as Coinbase and Binance, has recently converged toward zero. This represents a notable change from the buying pressure observed in April, which fuelled the rebound from $72,000. While a small positive spike in July helped drive the rally toward $124,000, the broader trend now reflects a neutralization of spot sentiment, suggesting less conviction among buyers at the current level.
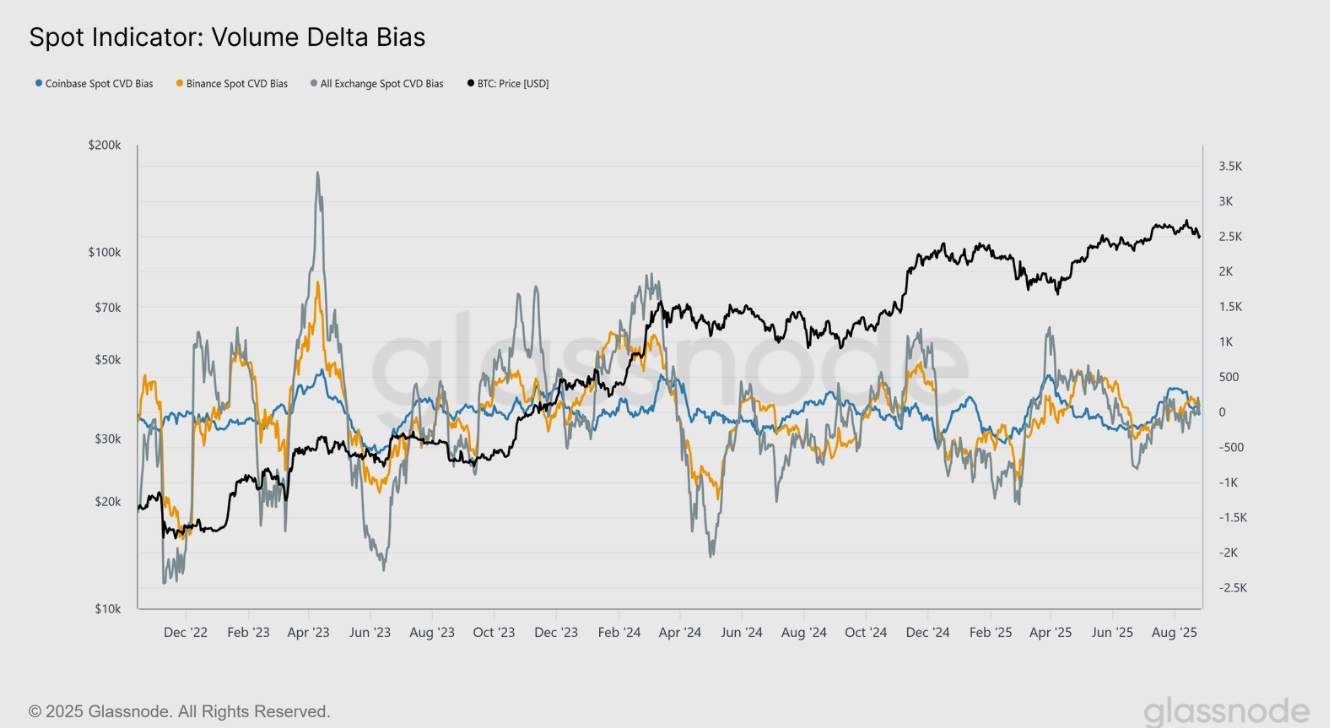
BTC Spot indicator: Volume Delta bias chart Source: Glassnode
Looking at the derivatives side, the report highlighted that the picture has shifted decisively bearish. The futures chart below shows that since July, the CVD has declined into negative territory, signalling a growing imbalance toward sell pressure. This suggests that perpetual traders, often acting as the more speculative segment of the market, have been increasingly leaning short during the recent pullback.
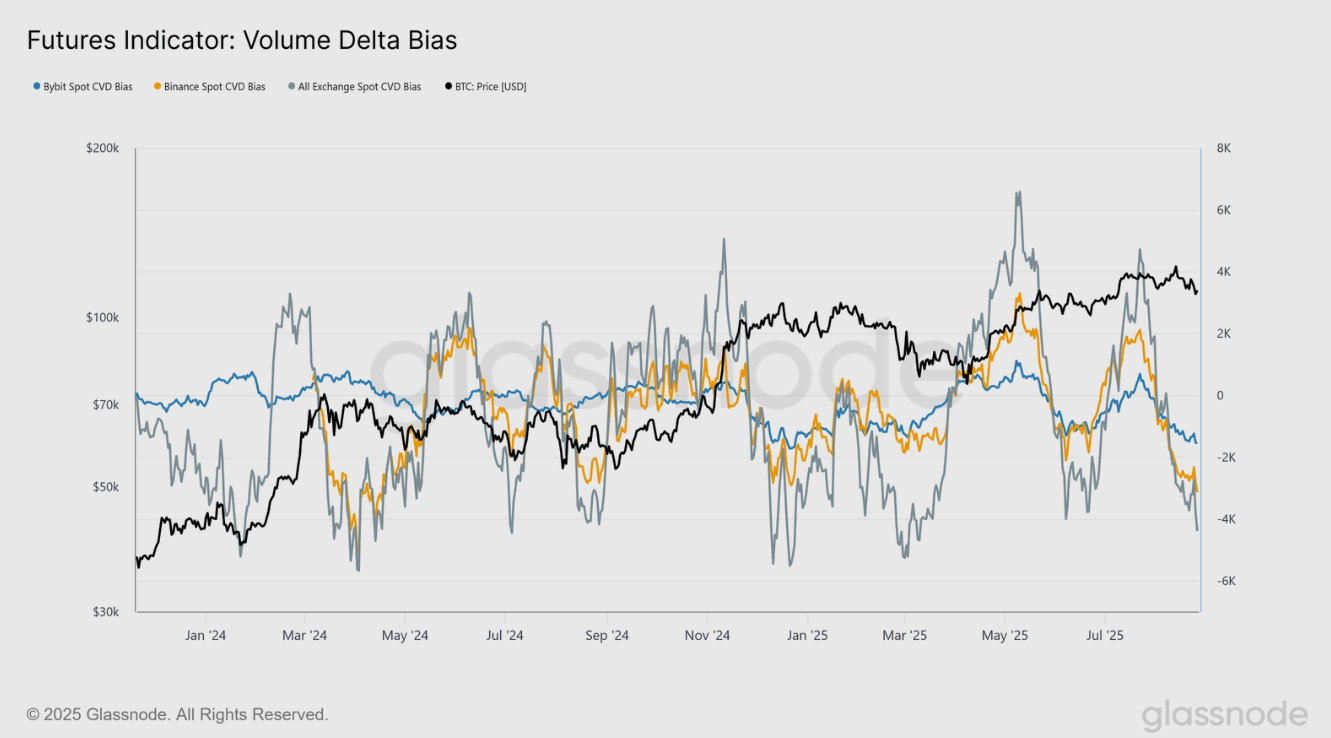
BTC Futures Indicator: Volume Delta bias chart Source: Glassnode
Bitcoin Price Forecast: BTC rebounds after retesting key support
Bitcoin price found rejection from a previously broken trendline on Saturday and declined by more than 5% until Monday, closing below its 100-day Exponential Moving Average (EMA) at $110,884. However, BTC recovered slightly the next day and found support around this level on Wednesday. At the time of writing on Thursday, it edges up, trading above $113,000.
If the 100-day EMA at $110,884 continues to hold as support, BTC could extend the recovery toward its next daily resistance at $116,000.
The Relative Strength Index (RSI) on the daily chart reads 46, pointing upward toward its neutral level of 50, which indicates a fading of bearish momentum. For the recovery rally to be sustained, the RSI must move above its neutral level.
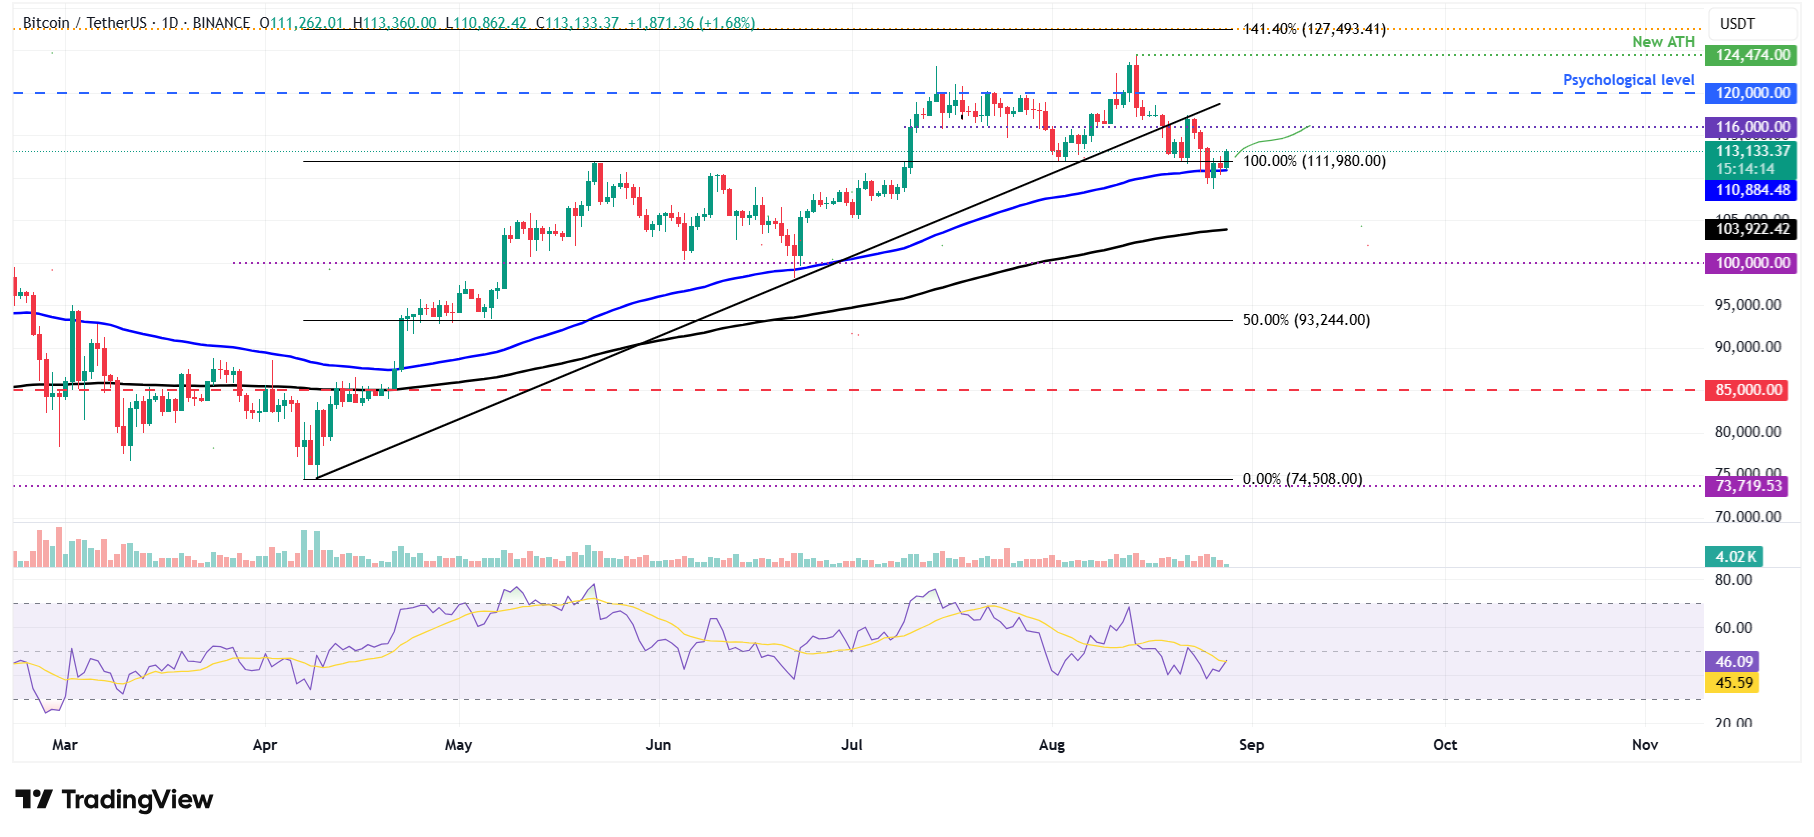
BTC/USDT daily chart
However, if BTC continues its correction, it could extend the decline toward its next key support at $103,922, the 200-day EMA.
Bitcoin, altcoins, stablecoins FAQs
Bitcoin is the largest cryptocurrency by market capitalization, a virtual currency designed to serve as money. This form of payment cannot be controlled by any one person, group, or entity, which eliminates the need for third-party participation during financial transactions.
Altcoins are any cryptocurrency apart from Bitcoin, but some also regard Ethereum as a non-altcoin because it is from these two cryptocurrencies that forking happens. If this is true, then Litecoin is the first altcoin, forked from the Bitcoin protocol and, therefore, an “improved” version of it.
Stablecoins are cryptocurrencies designed to have a stable price, with their value backed by a reserve of the asset it represents. To achieve this, the value of any one stablecoin is pegged to a commodity or financial instrument, such as the US Dollar (USD), with its supply regulated by an algorithm or demand. The main goal of stablecoins is to provide an on/off-ramp for investors willing to trade and invest in cryptocurrencies. Stablecoins also allow investors to store value since cryptocurrencies, in general, are subject to volatility.
Bitcoin dominance is the ratio of Bitcoin's market capitalization to the total market capitalization of all cryptocurrencies combined. It provides a clear picture of Bitcoin’s interest among investors. A high BTC dominance typically happens before and during a bull run, in which investors resort to investing in relatively stable and high market capitalization cryptocurrency like Bitcoin. A drop in BTC dominance usually means that investors are moving their capital and/or profits to altcoins in a quest for higher returns, which usually triggers an explosion of altcoin rallies.
Bài viết đề xuất


