
Stellar Price Forecast: XLM shows early signs of recovery
- Stellar price nears its key support zone on Thursday, hinting at a potential rebound.
- Derivatives data show early signs of recovery as funding rates flip positive.
- The technical outlook suggests potential gains, bolstered by VersaBank’s use of the XLM blockchain to test its tokenized deposit, USDVB.
The Stellar (XLM) price trades around $0.38 on Thursday, following a recent pullback, with price action nearing a key support zone that could pave the way for a rebound. Derivatives data also support the recovery thesis, as funding rates have turned positive. Adding to the optimism, VersaBank has announced plans to leverage the XLM blockchain in testing its tokenized deposit, USDVB.
Positive funding rates and growing network usage hint at a recovery
CoinGlass’s OI-Weighted Funding Rate data shows that the number of traders betting that the price of Stellar will slide further is lower than that anticipating a price increase.
The metric flipped to a positive rate on Wednesday and now reads 0.0071%, indicating that longs are paying shorts. Historically, as shown in the chart below, when the funding rates have flipped from negative to positive, the Stellar price has rallied sharply.
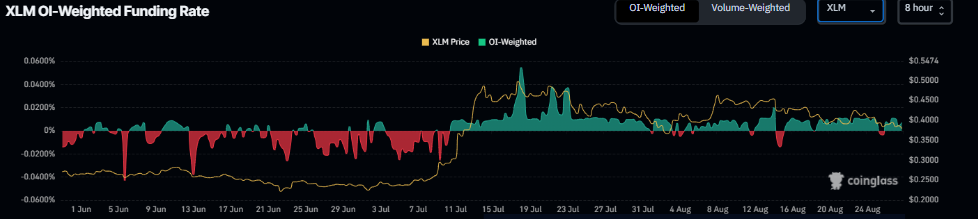
XLM funding rate chart. Source: CoinGlass
Apart from the positive funding rate, XLM also shows growing network usage and increasing acceptance. VersaBank, a Canadian digital bank, announced on Tuesday that it has launched an internal pilot program in the United States for its USDVBs, the US-dollar version of its proprietary Digital Deposit Receipts (DDRs), a more compliant alternative to stablecoins. Each token, branded USDVB, represents one U.S. dollar held on deposit at VersaBank USA.
These tokenised deposits will be managed through the bank’s digital vault and e-wallet platforms and issued on the Stellar blockchain alongside Ethereum (ETH) and Algorand (ALGO).
“VersaBank USA expects the USDVB Pilot Program to be completed by the end of calendar 2025 with commercial launch to occur as soon as possible thereafter,” says its press release.
XLM Price Forecast: Nears its key support zone
Stellar price faced rejection from its daily level at $0.45 on August 14 and declined by nearly 17% in the next 14 days until Wednesday. At the time of writing on Thursday, it hovers around $0.38, nearing the ascending trendline and the 50% price retracement level at $0.36.
If XLM holds above these key support zones, it could extend the rally toward its daily resistance at $0.45.
The Relative Strength Index (RSI) on the daily chart reads 42, below its neutral level of 50, indicating bearish momentum. For the recovery rally to be sustained, the RSI must move above its neutral level.
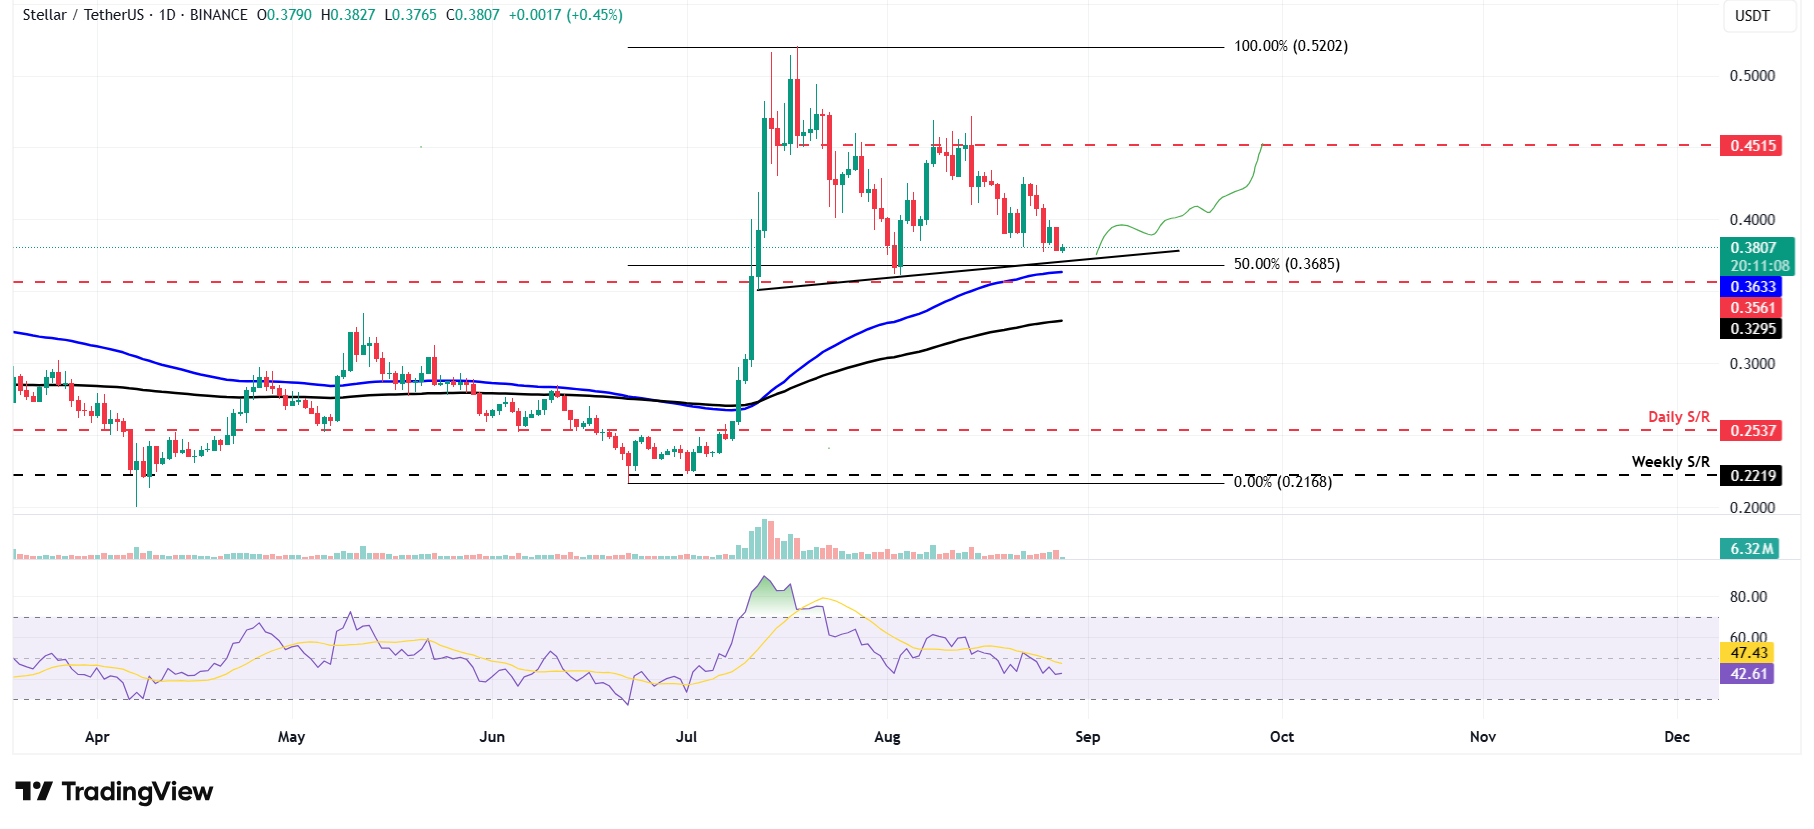
XLM/USDT daily chart
However, if XLM faces a correction and closes below its 50% price retracement at $0.36, it could extend the decline towards its weekly support at $0.35.
Bài viết đề xuất


