
Ethereum Price Forecast: Investors scoop up 600K ETH as analyst hints historic all-time high trend
Ethereum price today: $4,540
- Ethereum could deviate from a historical pattern if it fails to continue its rally.
- ETH exchange withdrawals or buying activity have outweighed deposits by over 600,000 ETH in the past four days.
- ETH could begin another leg up if it breaks above the $5,000 milestone and holds it as a support level.
Ethereum (ETH) trades around $4,540 on Wednesday, following increased withdrawals from exchanges and a report from K33 highlighting historical rallies that accompanied new all-time high moves from the top altcoin.
Ethereum withdrawals outpace deposits amid historic all-time high trend
Ethereum has historically experienced intense price movements during periods of hitting new all-time highs (ATHs), according to Vetle Lunde, K33's Head of Research, in a Tuesday report.
"In H1, 2021, ETH saw 36 days of ATHs, whereas the November 2021 rally saw an additional 6 days of ATHs. ETH saw 19 days of ATHs between November 23, 2017, and January 13, 2018," wrote Lunde. The current rally would be a deviation from the historic trend if ETH fails to continue its uptrend, she added.
However, an 11% drawdown accompanied ETH's Sunday all-time high of $4,956, sparking a series of long liquidations. Despite the sharp drawdown, ETH's on-chain and derivatives data indicate investors are buying the dip, following Standard Chartered's Geoffrey Kendrick call on Tuesday.
Exchange Netflows, which tracks the difference between coins flowing in and out of exchanges, shows ETH withdrawals have outweighed deposits by over 600,000 ETH in the past four days, according to CryptoQuant data. This means investors are rapidly moving ETH to private wallets for potential long-term holding. At the same time, US spot ETH ETFs have attracted net inflows of nearly $900 million since Monday.
 - All Exchanges (10)-1756322127282-1756322127283.png)
ETH Exchange Netflows. Source: CryptoQuant
Meanwhile, ETH CME open interest has risen 8% over the past two days to a new high of about 2.22 million ETH, after declining to 2.05 million ETH on Monday, per Coinglass data. However, these contracts are dominated by short positions, which have also reached their highest level in history, according to data shared by ZeroHedge.
Ethereum Price Forecast: ETH could flip $5,000 amid bullish pennant consolidation
Ethereum has seen $69.9 million in futures liquidations over the past 24 hours, comprising $30.97 million and $38.95 million in long and short liquidations, according to Coinglass data.
Despite hitting a new all-time high on Sunday, ETH has largely been consolidating in the $4,100 to $4,900 range over the past two weeks. The range-bound movement has formed a bullish pennant, with a two-week rally between August 1 and 13 serving as its pole.
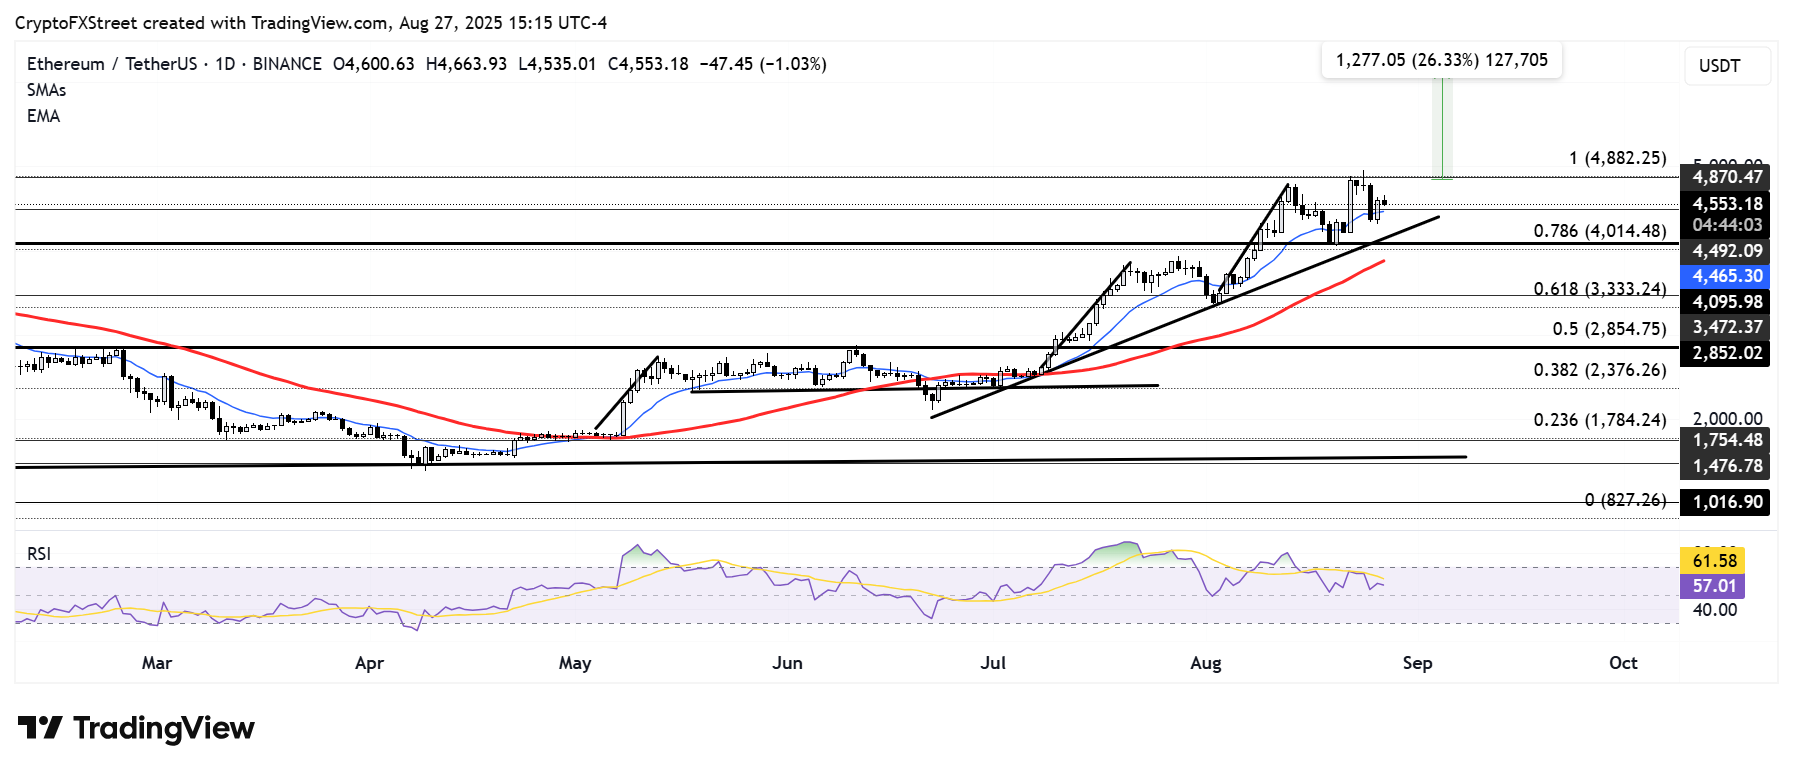
ETH/USDT daily chart
The Relative Strength Index (RSI) has largely been seeing choppy action between its neutral and overbought boundaries, while failing to break above its moving average. This indicates a cautionary market with a slight bullish bias.
On the upside, ETH could begin another leg up if it breaks above $5,000 and holds the level as support. On the downside, the 14-day Exponential Moving Average (EMA) has proved crucial as ETH has failed to stay below it for more than three days since July.
ETH will likely maintain the bullish leaning if it holds above the $4,000 psychological level.
Fundstrat's Head of Technical Strategy, Mark Newton, echoed a similar sentiment in a conversation shared by BitMine Chairman and Fundstrat CIO Thomas Lee. Newton estimates that ETH could make a push toward $5,400, but cautioned that a near-term bullish stance could be invalidated if ETH breaks the $4,067 low from August 18.
Bài viết đề xuất


