
Solana Price Forecast: SOL extends rally as Open interest hits record high of over $13 billion
- Solana price extends its gains on Monday after rallying 8% in the previous week.
- SOL’s Open Interest reaches a record high of $13.08 billion, signaling strong bullish sentiment.
- Bullish company's IPO settles $1.15 billion in stablecoins, most of which were minted on Solana, boosting ecosystem demand.
Solana (SOL) price trades in green above $207 at the time of writing on Monday, supported by a strong rally last week. The bullish outlook is further supported by the record-high Open Interest (OI) on SOL, reaching over $13 billion. Additionally, the Bullish company's Initial Public Offering (IPO) last week added optimism that could set the stage for SOL to make a fresh push toward its all-time high.
Solana’s Open Interest hits a record
CoinGlass’ data show that the futures’ OI in Solana at exchanges reached a new all-time high of $13.08 billion on Monday. An increasing OI represents new or additional money entering the market and new buying, which could fuel the current Solana price rally.
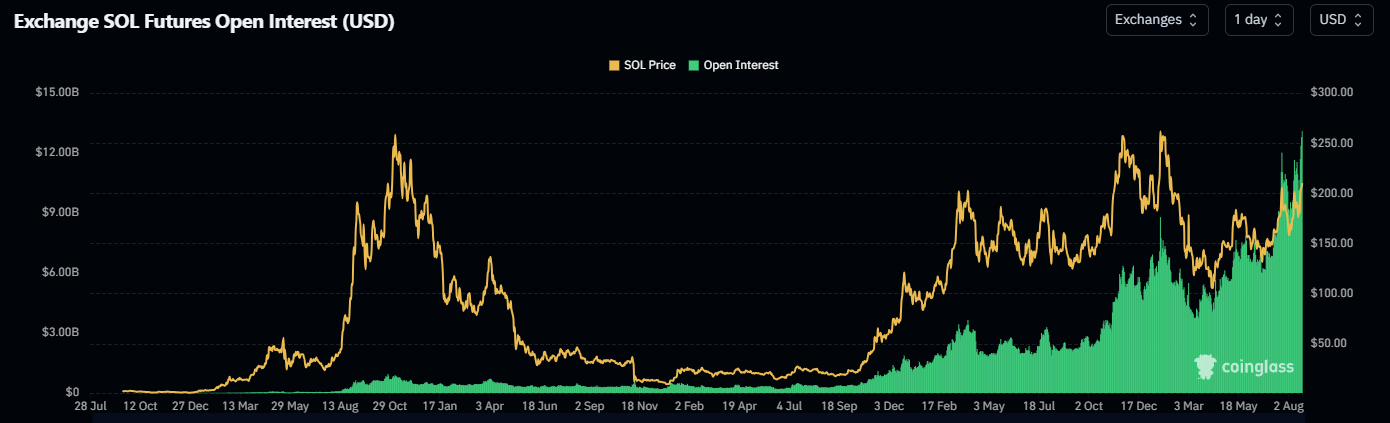
Solana Open Interest chart. Source: CoinGlass
Another aspect bolstering the platform’s bullish outlook is a recent surge in traders’ interest and liquidity in the Solana chain. Artemis Terminal data shows that SOL Chain’s decentralized exchange (DEX) trading volume rose from $2.6 billion on August 17 to $7.1 billion on Sunday.
-1756099562896-1756099562900.jpeg)
Solana DEX volumes chart. Source: Artemis
Some signs of optimism for Solana
Solana gained bullish momentum after key news announcements last week, reigniting optimism around the token.
Bullish (BLSH), an institutionally focused global digital asset platform that provides market infrastructure and information services, announced that it has received $1.15 billion of proceeds from its recently completed initial public offering in stablecoins in the US, with most of these stablecoins minted on the Solana network, boosting ecosystem demand.
Adding to this optimism, Solana will debut at the All-In Summit 2025 in September. Superteam UAE has announced “Solana City,” a real-world coworking hub in Dubai, and a new Wyoming stablecoin — the first stablecoin issued by a US state —is coming to Solana, signaling growing global adoption and ecosystem expansion.

Solana Price Forecast: SOL bulls aiming for record highs
Solana price found support around its 50-day Exponential Moving Average (EMA) at $179.45 on Friday and rose nearly 16% by Sunday. At the time of writing on Monday, it continues to trade higher above $207.
If SOL continues its upward trend, it could extend the rally toward its next daily resistance at $230. A successful close above this level could extend gains toward its all-time high of $295.83.
The Relative Strength Index (RSI) on the daily chart reads 62, above the neutral level of 50, indicating strong bullish momentum. Moreover, the MACD indicator also showed a bullish crossover on Friday, further supporting the bullish thesis.
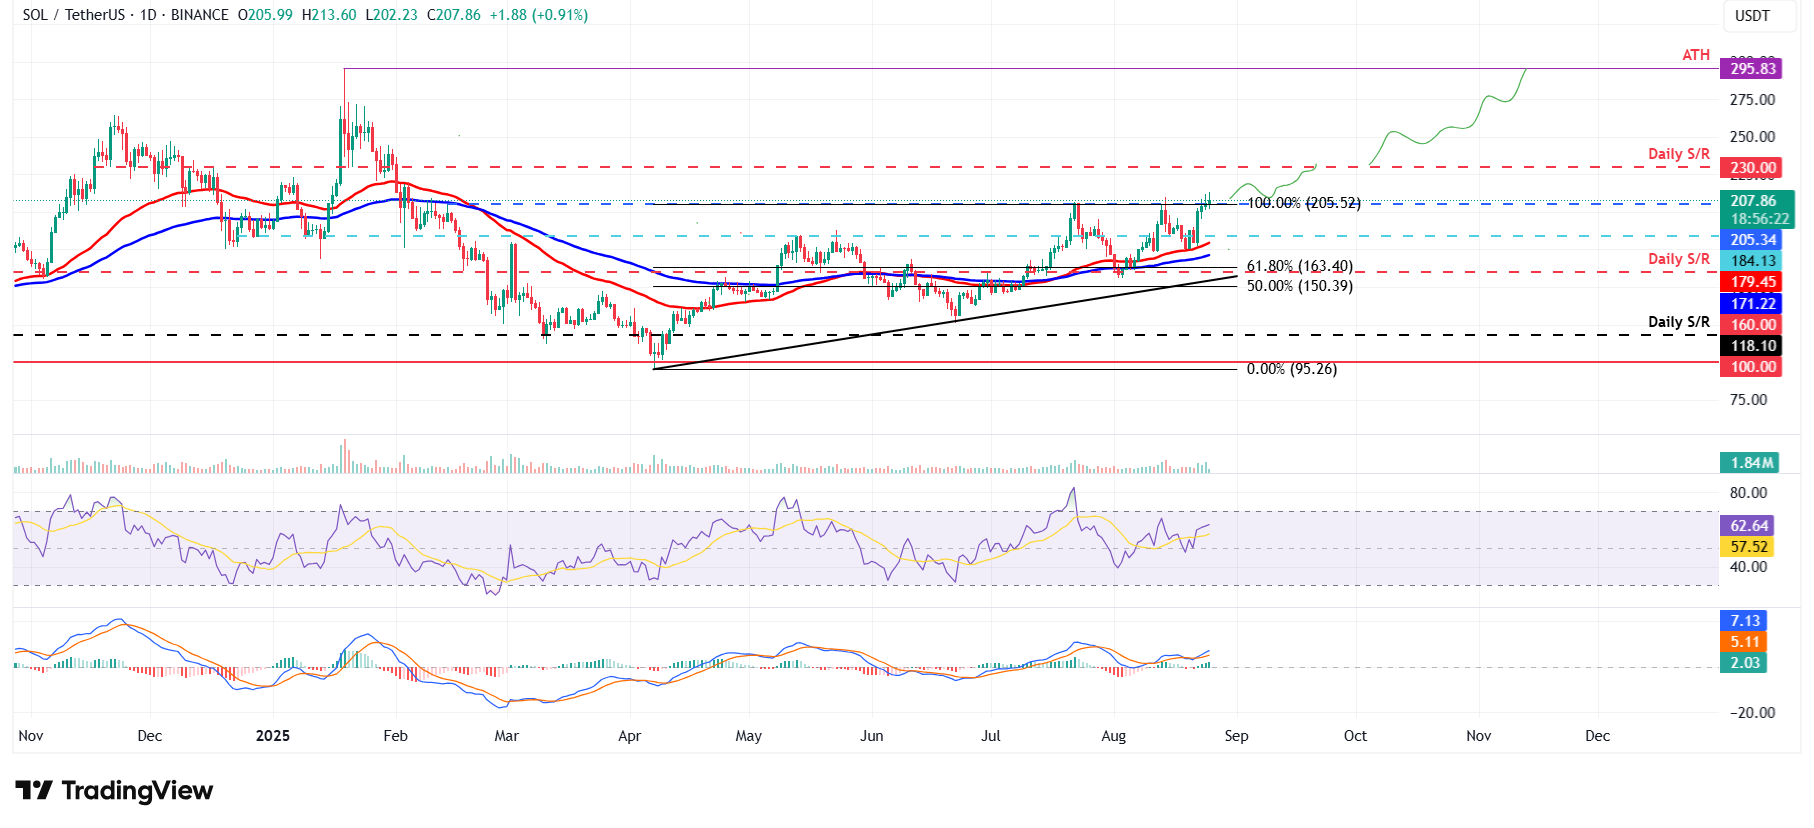
SOL/USDT daily chart
However, if SOL faces a correction, it could extend the decline toward its 50-day EMA at $179.45.
Bài viết đề xuất


