
Crypto Today: Bitcoin, Ethereum, XRP edge lower amid growing risk-off sentiment
- Bitcoin hovers near $111,500 as institutional demand dwindles.
- Ethereum holds above the 50-day EMA support buoyed by steady institutional demand and capital rotation.
- XRP struggles to hold its $3.00 support amid declining futures funding rate.
Cryptocurrency prices are back in the red on Monday following a short-lived rally on Friday, triggered by Federal Reserve (Fed) Chair Jerome Powell’s dovish remarks, which signalled interest rate cuts in September. Bitcoin (BTC) price is trading slightly above $111,500 after peaking at around $117,430 on Friday.
Meanwhile, altcoins led by Ethereum (ETH) and Ripple (XRP) are struggling to sustain their weekend gains. Institutional demand for Ethereum remains relatively steady, with Exchange Traded Funds (ETFs) inflows stabilizing on Thursday and Friday.
Data spotlight: Bitcoin faces risk-off sentiment as investors turn to Ethereum
Bitcoin led other digital assets in a stubborn sell-off last week underpinned by risk-off sentiment leading into Friday’s Jackson Hole conference, where Fed Chair Powell’s remarks pushed crypto prices higher. Despite the dovish comments, sticky risk-off sentiment characterized crypto markets on Monday, reflecting rising Bitcoin spot ETF outflows.
According to SoSoValue data, Bitcoin spot ETFs extended outflows, for the sixth consecutive day on Friday. Weekly total net outflows averaged $1.17 billion, the highest since late February. Bitcoin price will likely continue facing strong headwinds if institutional demand remains suppressed.
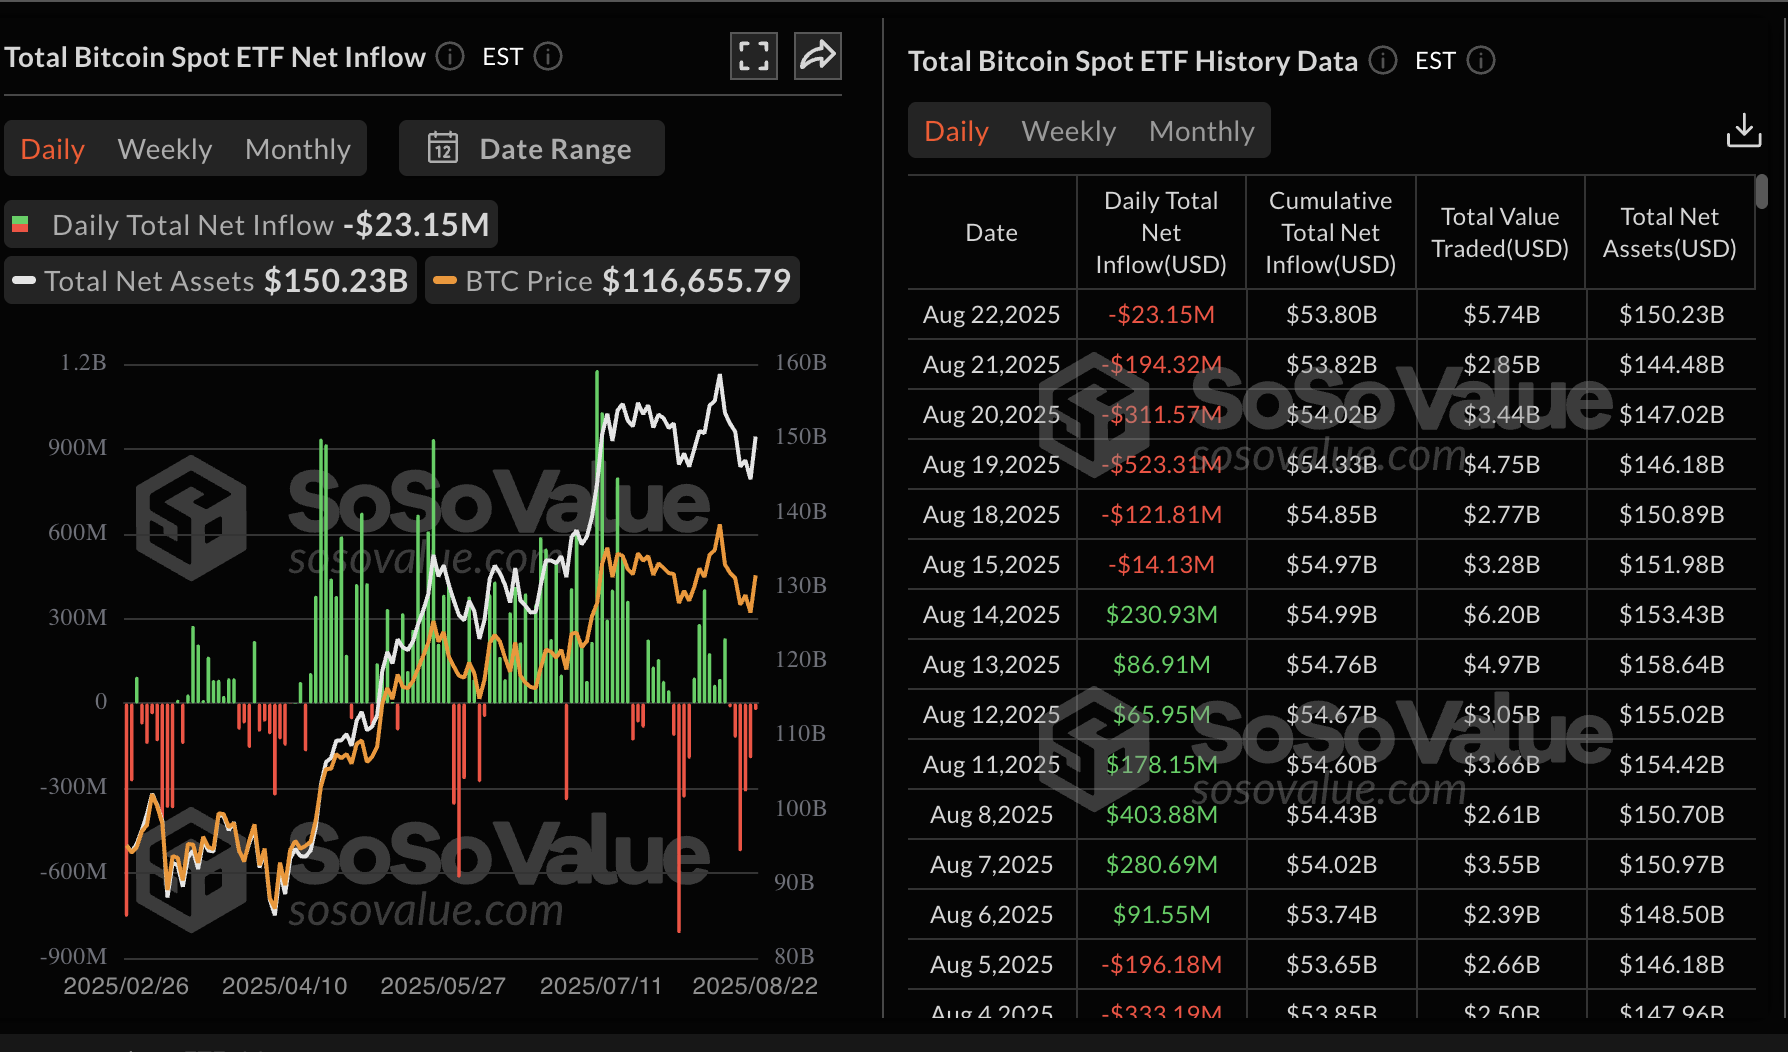
Bitcoin spot ETF data | Source: SoSoValue
Ethereum also experienced outflows early last week, but the trend turned around on Thursday and Friday. According to the chart below, ETH spot ETFs operating in the US recorded approximately $288 million and $341 million in inflows on Thursday and Friday, respectively, bringing cumulative inflows to $12.4 billion.
Currently, total net assets average $30.6 billion, underscoring steady institutional demand and possible capital rotation from BTC to ETH. Ethereum hit a new record high of $4,955 on Sunday, suggesting bulls have the upper hand. Still, risk-off sentiment in the broader cryptocurrency market cannot be shrugged off, seeing that the price of Ethereum holds below $4,600 at the time of writing.
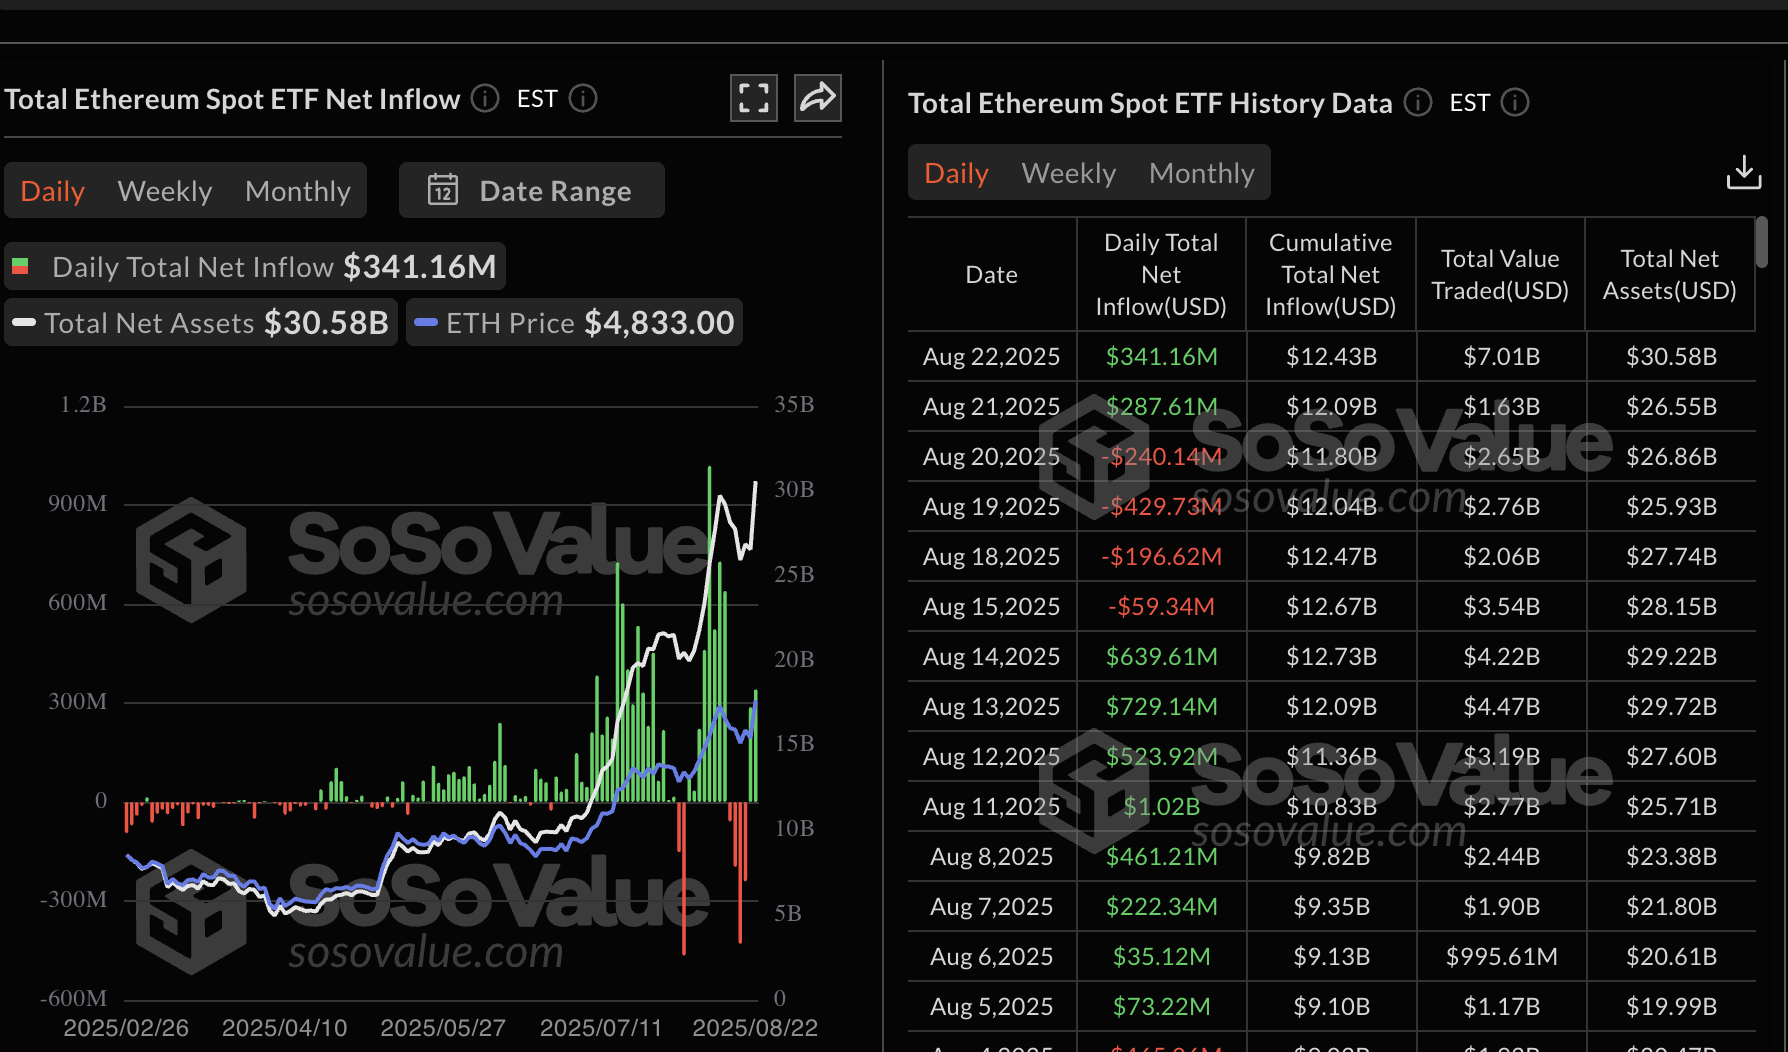
Ethereum spot ETF data | Source: SoSoValue
XRP, on the other hand, has started the new week on the back foot, trading below its $3.00 support. Interest in the cross-border money remittance token is trending downward, as evidenced by low futures funding rates.
CoinGlass data shows XRP’s weighted funding rate stable at 0.0115% after peaking at around 0.0524% on July 18. A low funding rate suggests that fewer traders are leveraging long positions in XRP.
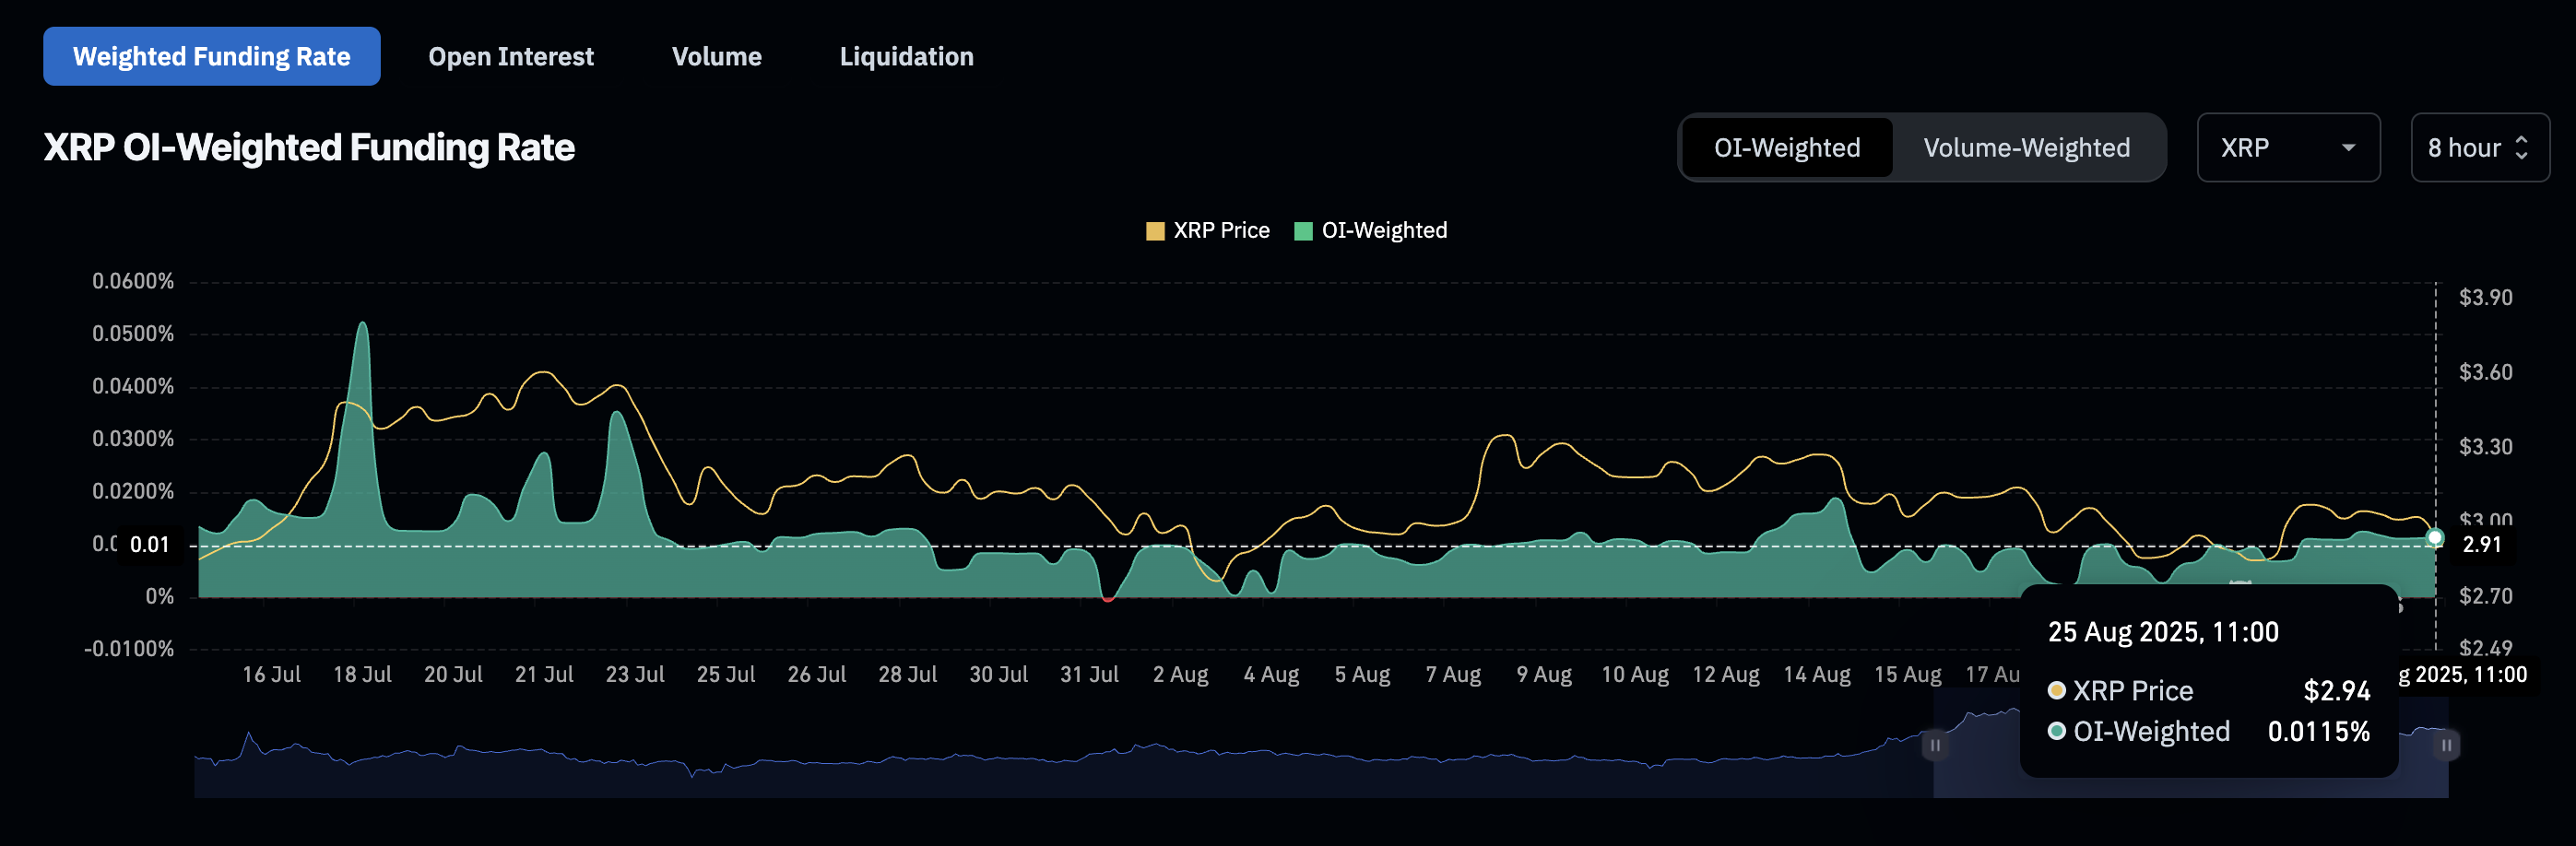
XRP Weighted Funding rate | Source: CoinGlass
Chart of the day: Bitcoin risks extending decline
Bitcoin price holds above $111,500 round-figure support at the time of writing on Monday as bulls eye a potential trend reversal toward the pivotal $120,000 level. Based on the short-term technical picture, sellers have the upper hand, backed by a sell signal maintained by the Moving Average Convergence Divergence (MACD) indicator since Sunday in the 4-hour time frame.
The Relative Strength Index (RSI) remains in the bearish region at 35, after peaking at around 63 on Friday, indicating a decrease in buying pressure. A steady recovery from near-oversold conditions could boost interest in BTC, encouraging traders to buy the dip, anticipating a strong reversal.
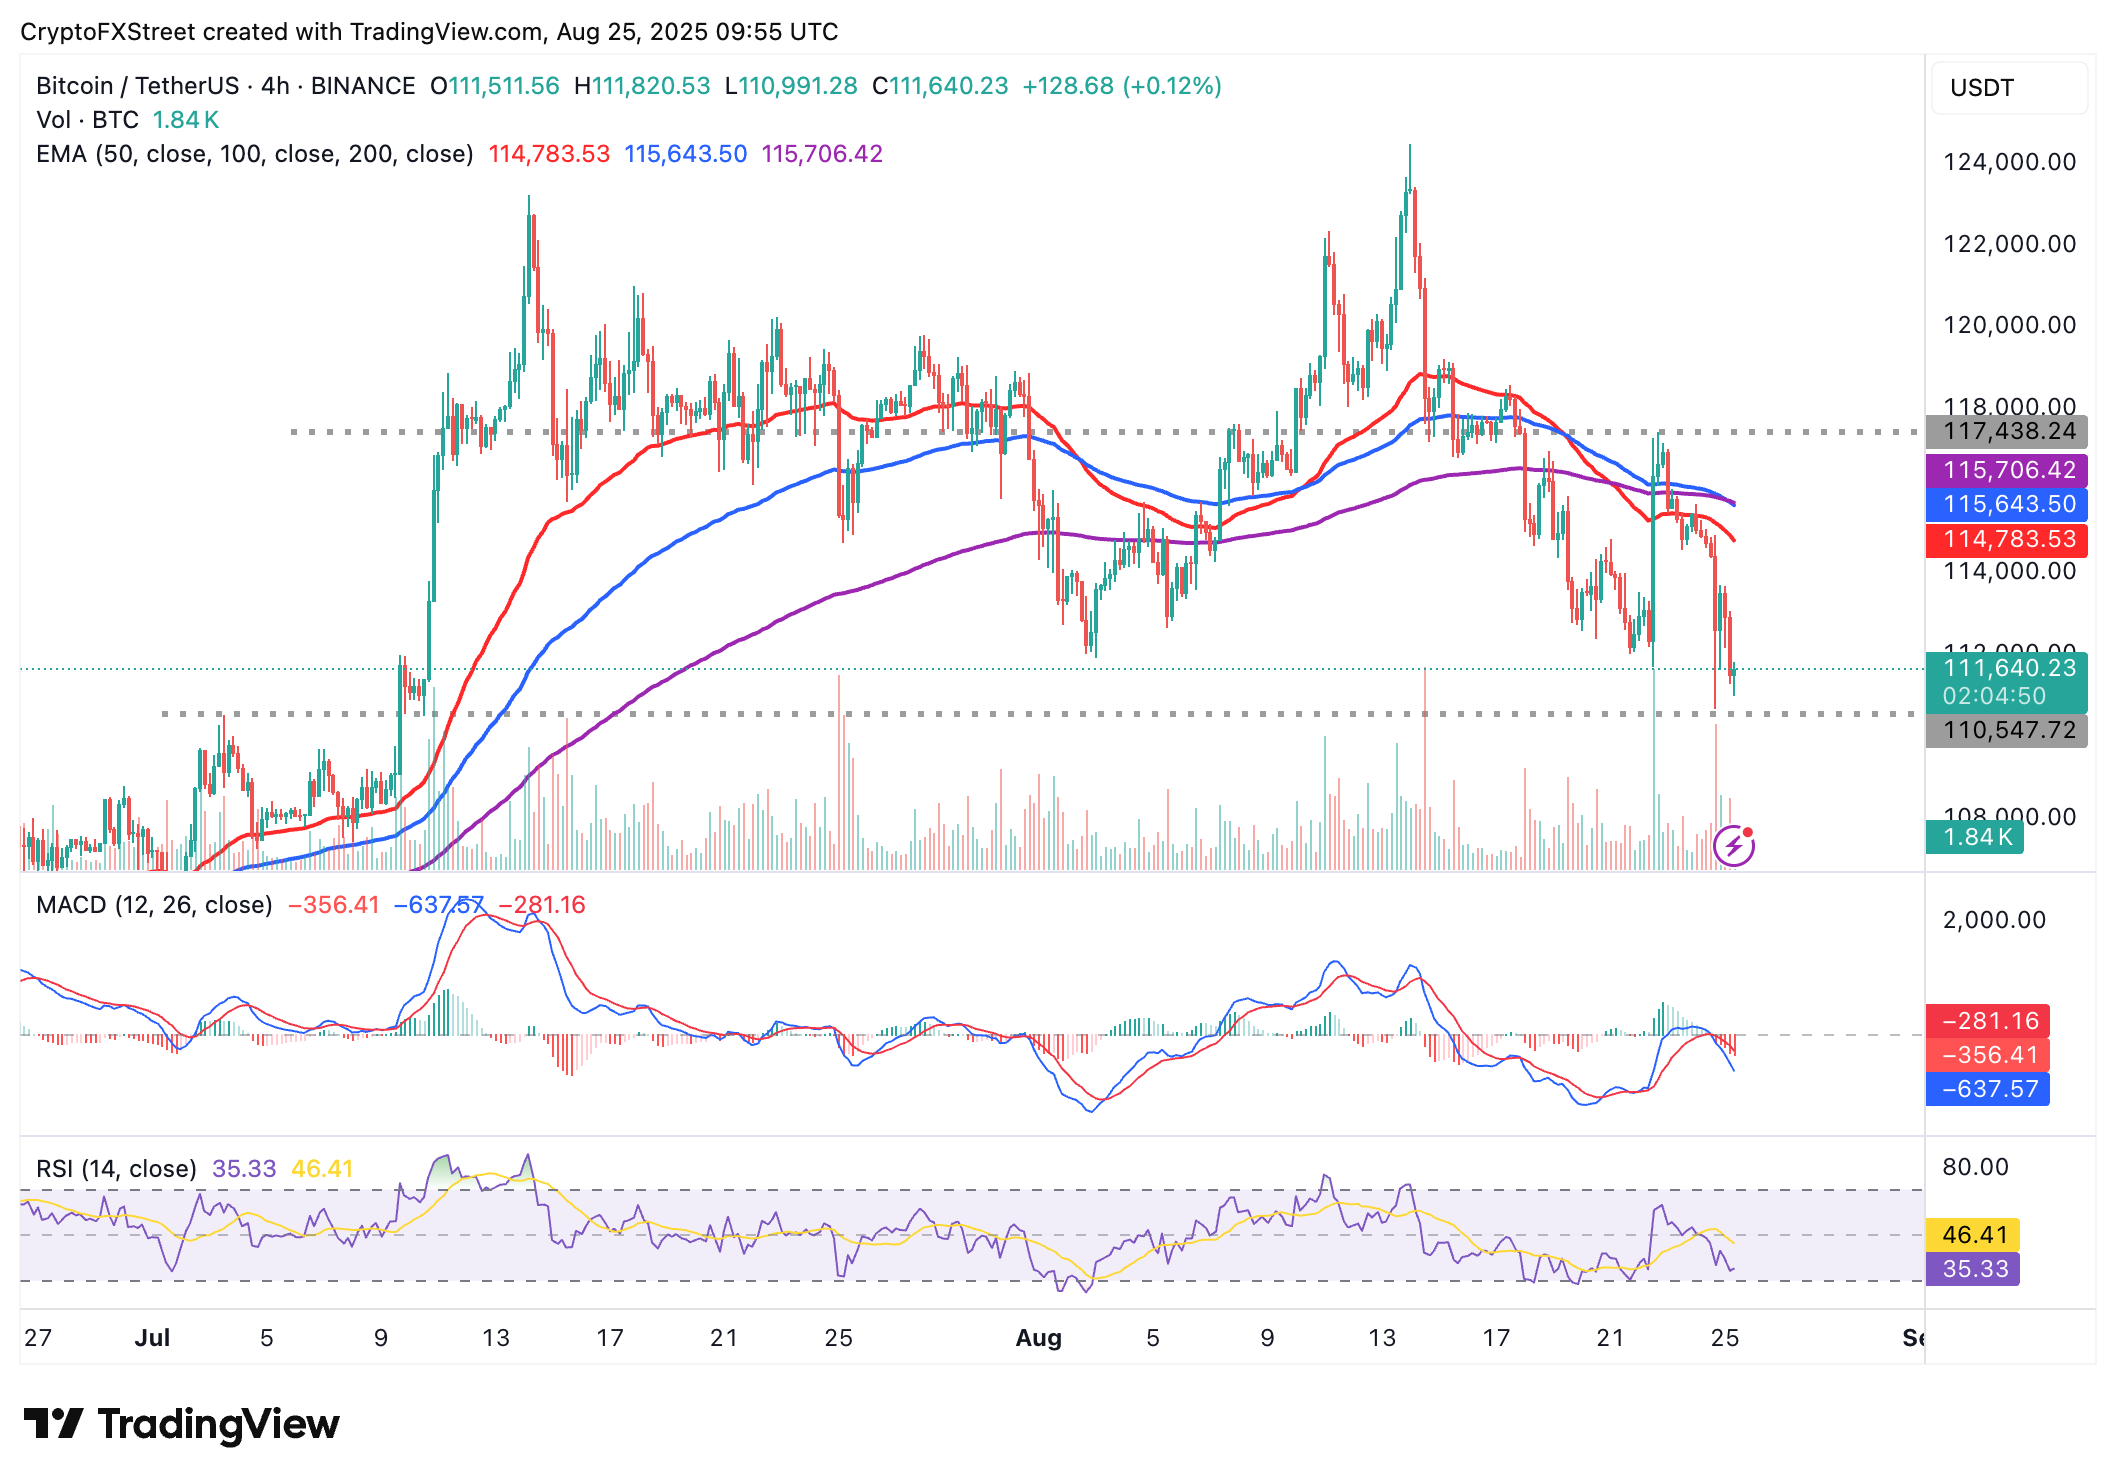
BTC/USD 4-hour chart
Altcoins update: Ethereum upholds support, XRP struggles with recovery
Ethereum price holds above the 50-period Exponential Moving Average (EMA), hinting at potential entry opportunities ahead of another reversal toward its $4,955 record high and the key $5,000 level.
The RSI stabilising above 40 reflects steady retail demand with a potential upswing toward the midline likely to precede the run-up targeting the $5,000 level.
In the event selling pressure overwhelms demand and Ethereum price extends its decline below the 50-period EMA support at $4,525, the 100-period EMA at $4,372 and the 200-period EMA at $4,082 will be in line to absorb the pressure.
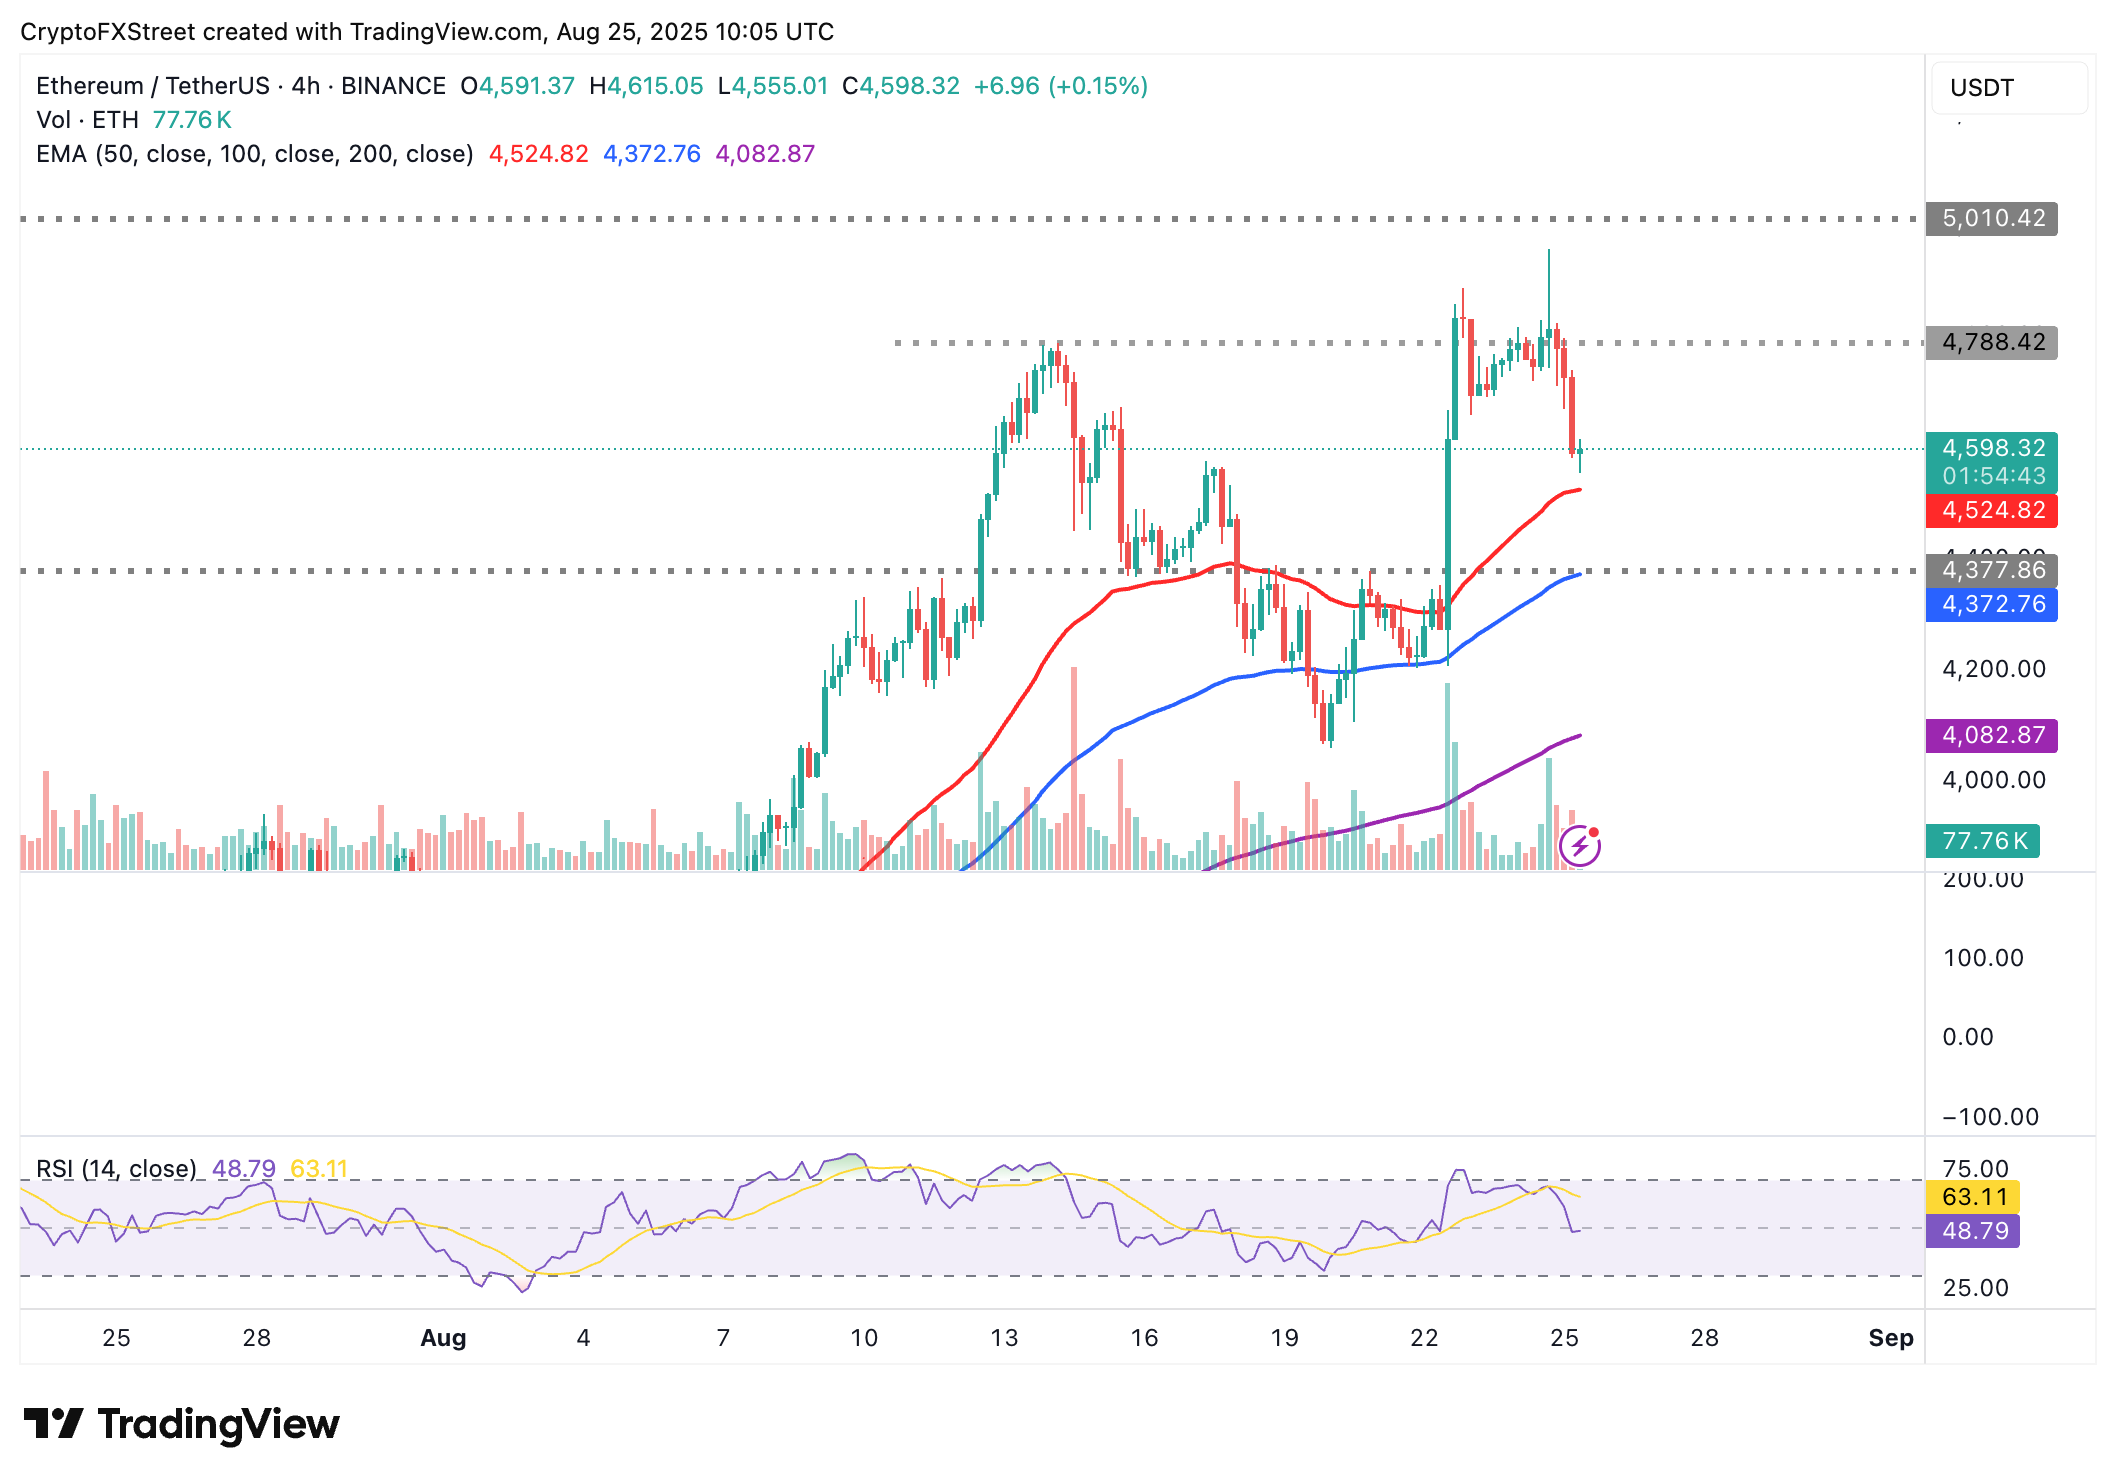
ETH/USDT 4-hour chart
As for XRP, bulls are struggling to hold onto support at $3.00, trading at around $2.95 at the time of writing. The token also sits below the 50-period, 100-period and 200-period EMAs, highlighting a weakening technical structure.
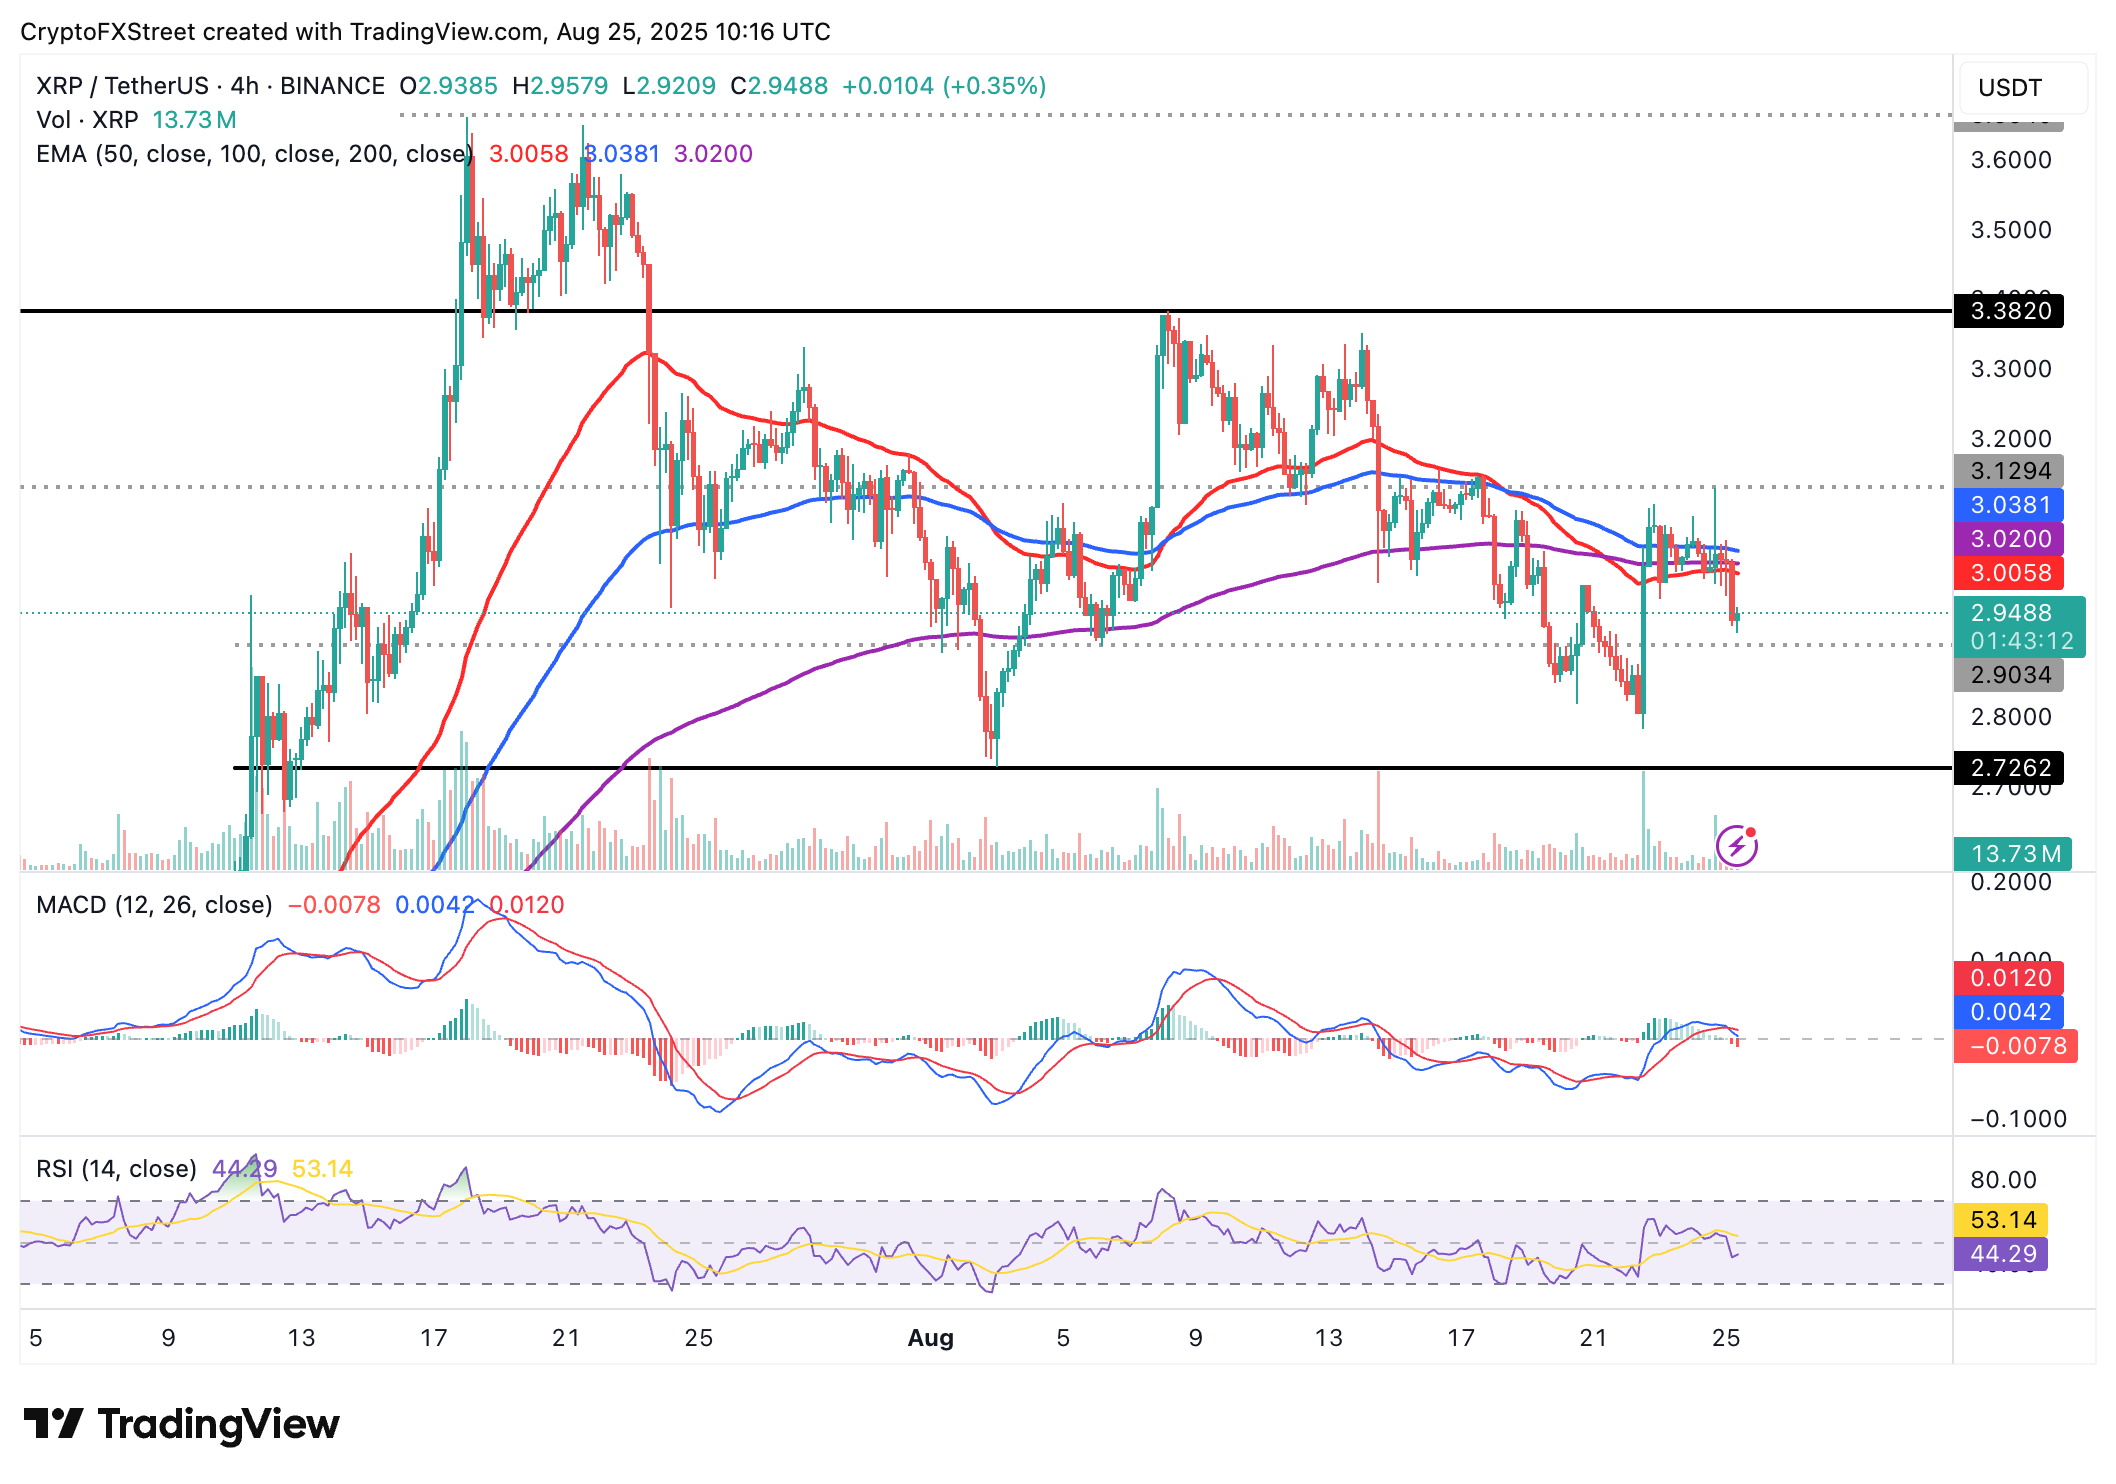
XRP/USD 4-hour chart
Bearish sentiment could take center stage in upcoming sessions, particularly with the MACD donning a sell signal. The path of least resistance could remain downward as long as the blue MACD line remains below the red signal line.
Apart from the immediate $2.90 support, other areas of interest to traders include the demand zone at $2.72, which was tested on August 3 and $2.66 tested on July 25.
Bitcoin, altcoins, stablecoins FAQs
Bitcoin is the largest cryptocurrency by market capitalization, a virtual currency designed to serve as money. This form of payment cannot be controlled by any one person, group, or entity, which eliminates the need for third-party participation during financial transactions.
Altcoins are any cryptocurrency apart from Bitcoin, but some also regard Ethereum as a non-altcoin because it is from these two cryptocurrencies that forking happens. If this is true, then Litecoin is the first altcoin, forked from the Bitcoin protocol and, therefore, an “improved” version of it.
Stablecoins are cryptocurrencies designed to have a stable price, with their value backed by a reserve of the asset it represents. To achieve this, the value of any one stablecoin is pegged to a commodity or financial instrument, such as the US Dollar (USD), with its supply regulated by an algorithm or demand. The main goal of stablecoins is to provide an on/off-ramp for investors willing to trade and invest in cryptocurrencies. Stablecoins also allow investors to store value since cryptocurrencies, in general, are subject to volatility.
Bitcoin dominance is the ratio of Bitcoin's market capitalization to the total market capitalization of all cryptocurrencies combined. It provides a clear picture of Bitcoin’s interest among investors. A high BTC dominance typically happens before and during a bull run, in which investors resort to investing in relatively stable and high market capitalization cryptocurrency like Bitcoin. A drop in BTC dominance usually means that investors are moving their capital and/or profits to altcoins in a quest for higher returns, which usually triggers an explosion of altcoin rallies.
Bài viết đề xuất


