
Crypto Today: Bitcoin, Ethereum, XRP offer signs of bullish reversal despite renewed inflation fears
- Bitcoin licks its wounds above $119,000 as bulls push to recoup losses from Thursday’s sell-off.
- Ethereum spot ETF inflows remain elevated as the price recovers, aiming at record highs.
- XRP flaunts a low but positive funding rate, which is likely to boost risk appetite.
Bitcoin (BTC) is attempting a recovery toward the pivotal $120,000 level, trading above $119,000 on Friday. The sell-off spread in the broader cryptocurrency market on Thursday occurred after July’s US Producer Price Index (PPI) data came in hotter than expected, casting doubts on the possibility of the Federal Reserve (Fed) cutting rates in September.
Altcoins also sold off, with Ethereum (ETH) approaching support at $4,455 before bouncing back above $4,600. Still, interest in the largest smart contracts token remains elevated, evidenced by steady spot Exchange Traded Funds (ETFs) inflows.
As for Ripple (XRP), the token showcases recovery signals in the daily time frame, trading at around $3.10.
“Following the PPI release, Bitcoin fell more than 2% and Ethereum also declined, as traders reacted to the prospect of sticky inflation potentially complicating the Federal Reserve’s policy path. Despite the spike, markets still see a 92% chance of a September rate cut,” a K33 Research report highlighted on Friday.
Market overview: Bitcoin, Ethereum uphold institutional interest
Bitcoin and Ethereum, the two largest cryptocurrencies by market capitalisation, continue to receive institutional attention, reflected by steady spot ETF inflows.
Despite the sell-off on Thursday, Ethereum spot ETFs in the US saw inflows totaling $634 million, slightly lower than Wednesday’s $729 million. Ethereum’s recovery over the last few weeks has kept speculative demand elevated, bringing the cumulative total inflow around $12.7 billion and net assets to $29.2 billion, according to SoSoValue data.
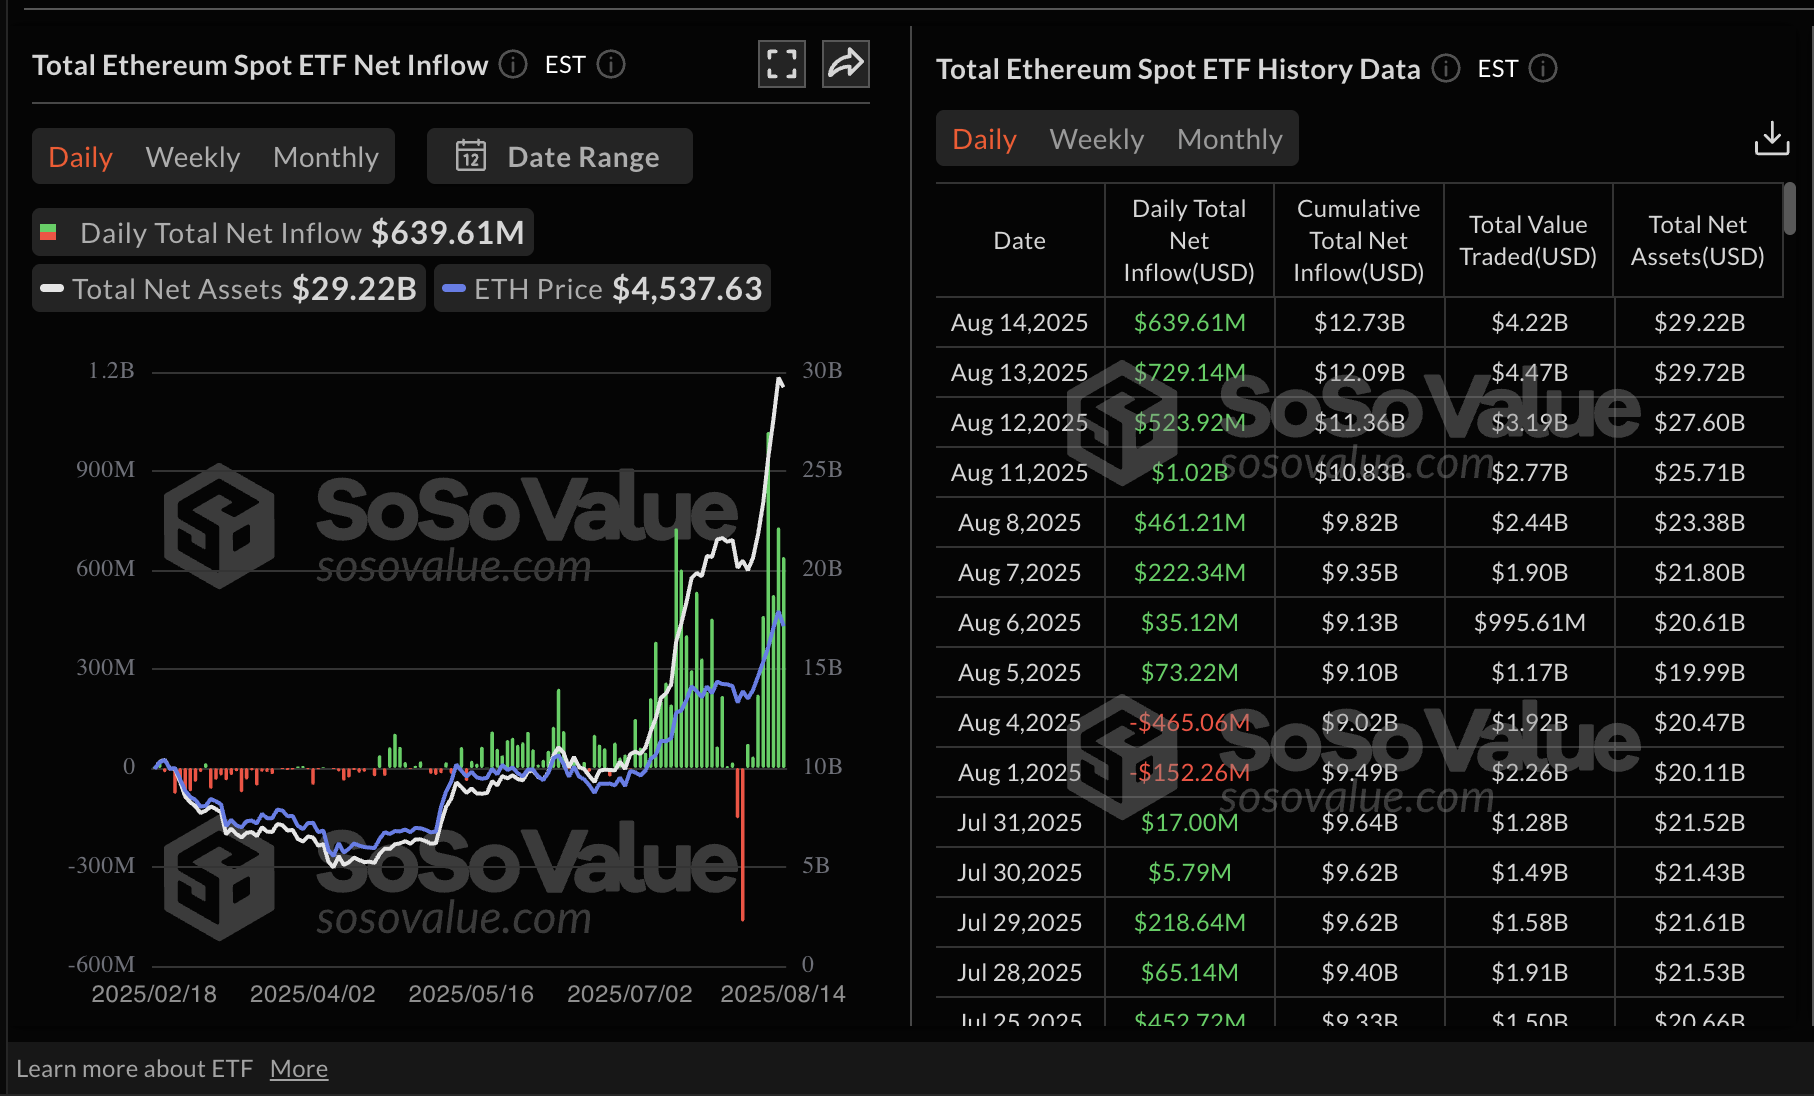
Ethereum spot ETF data | Source: SoSoValue
On the other hand, Bitcoin spot ETFs are in the green, albeit with lower volumes compared to the run-up to the previous all-time high of $123,218 reached on July 14. On Thursday, BTC spot ETFs in the US saw approximately $231 million in inflows, bringing the cumulative inflow near $55 billion and the total net assets to $153 billion.
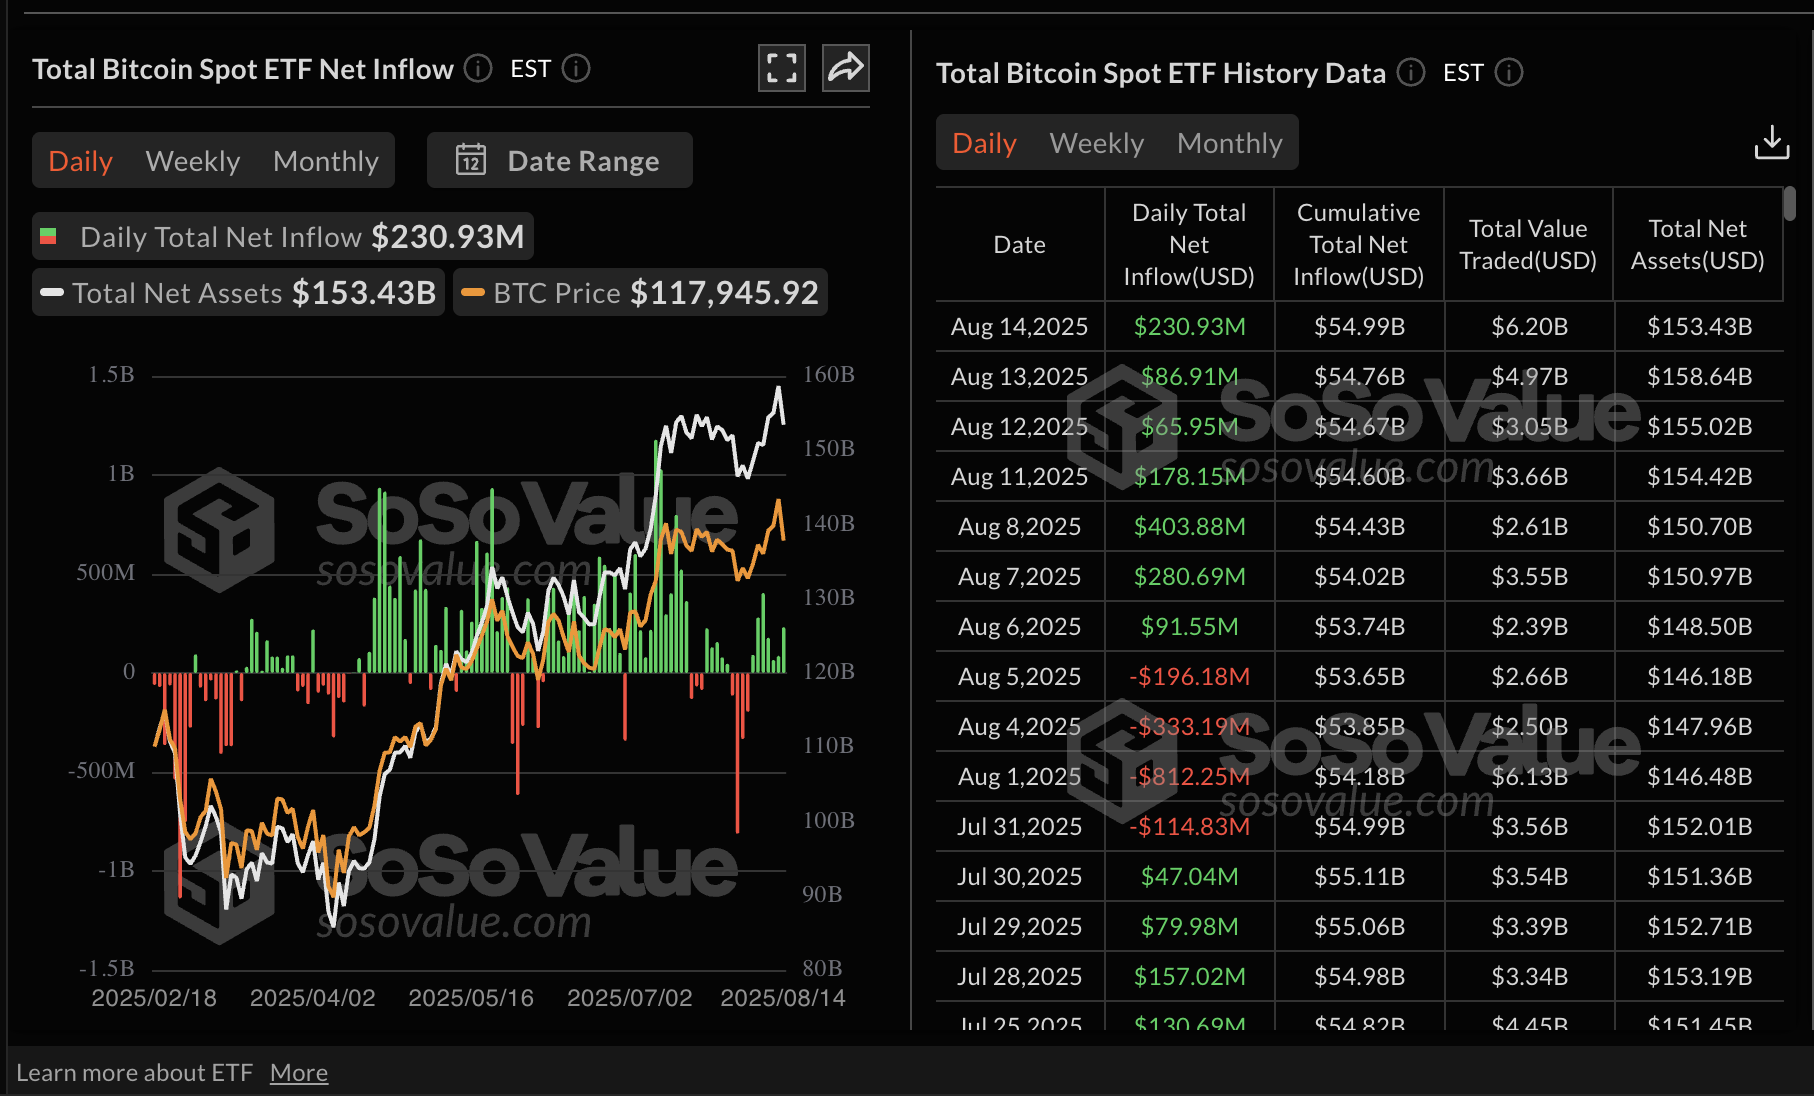
Bitcoin spot ETF data | Source: SoSoValue
Chart of the day: Bitcoin bulls lick wounds, eyeing $120,000 breakout
Bitcoin attempts to secure support above the $119,000 level following the correction from the new record high of $124,474. The 50-period Exponential Moving Average (EMA) at $118,800 on the 4-hour chart backs the short-term recovery.
A consolidation period may occur between the lower support of $116,380 provided by the 200-period EMA and the $120,000 level, if the Relative Strength Index (RSI) continues to move broadly sideways around the midline.
Still, traders should be aware of the bearish bias highlighted by the Moving Average Convergence Divergence (MACD) indicator, which is currently maintaining a sell signal. Until the blue MACD line flips above the red signal line, a strong recovery above $120,000 might remain a pipe dream in the near term.
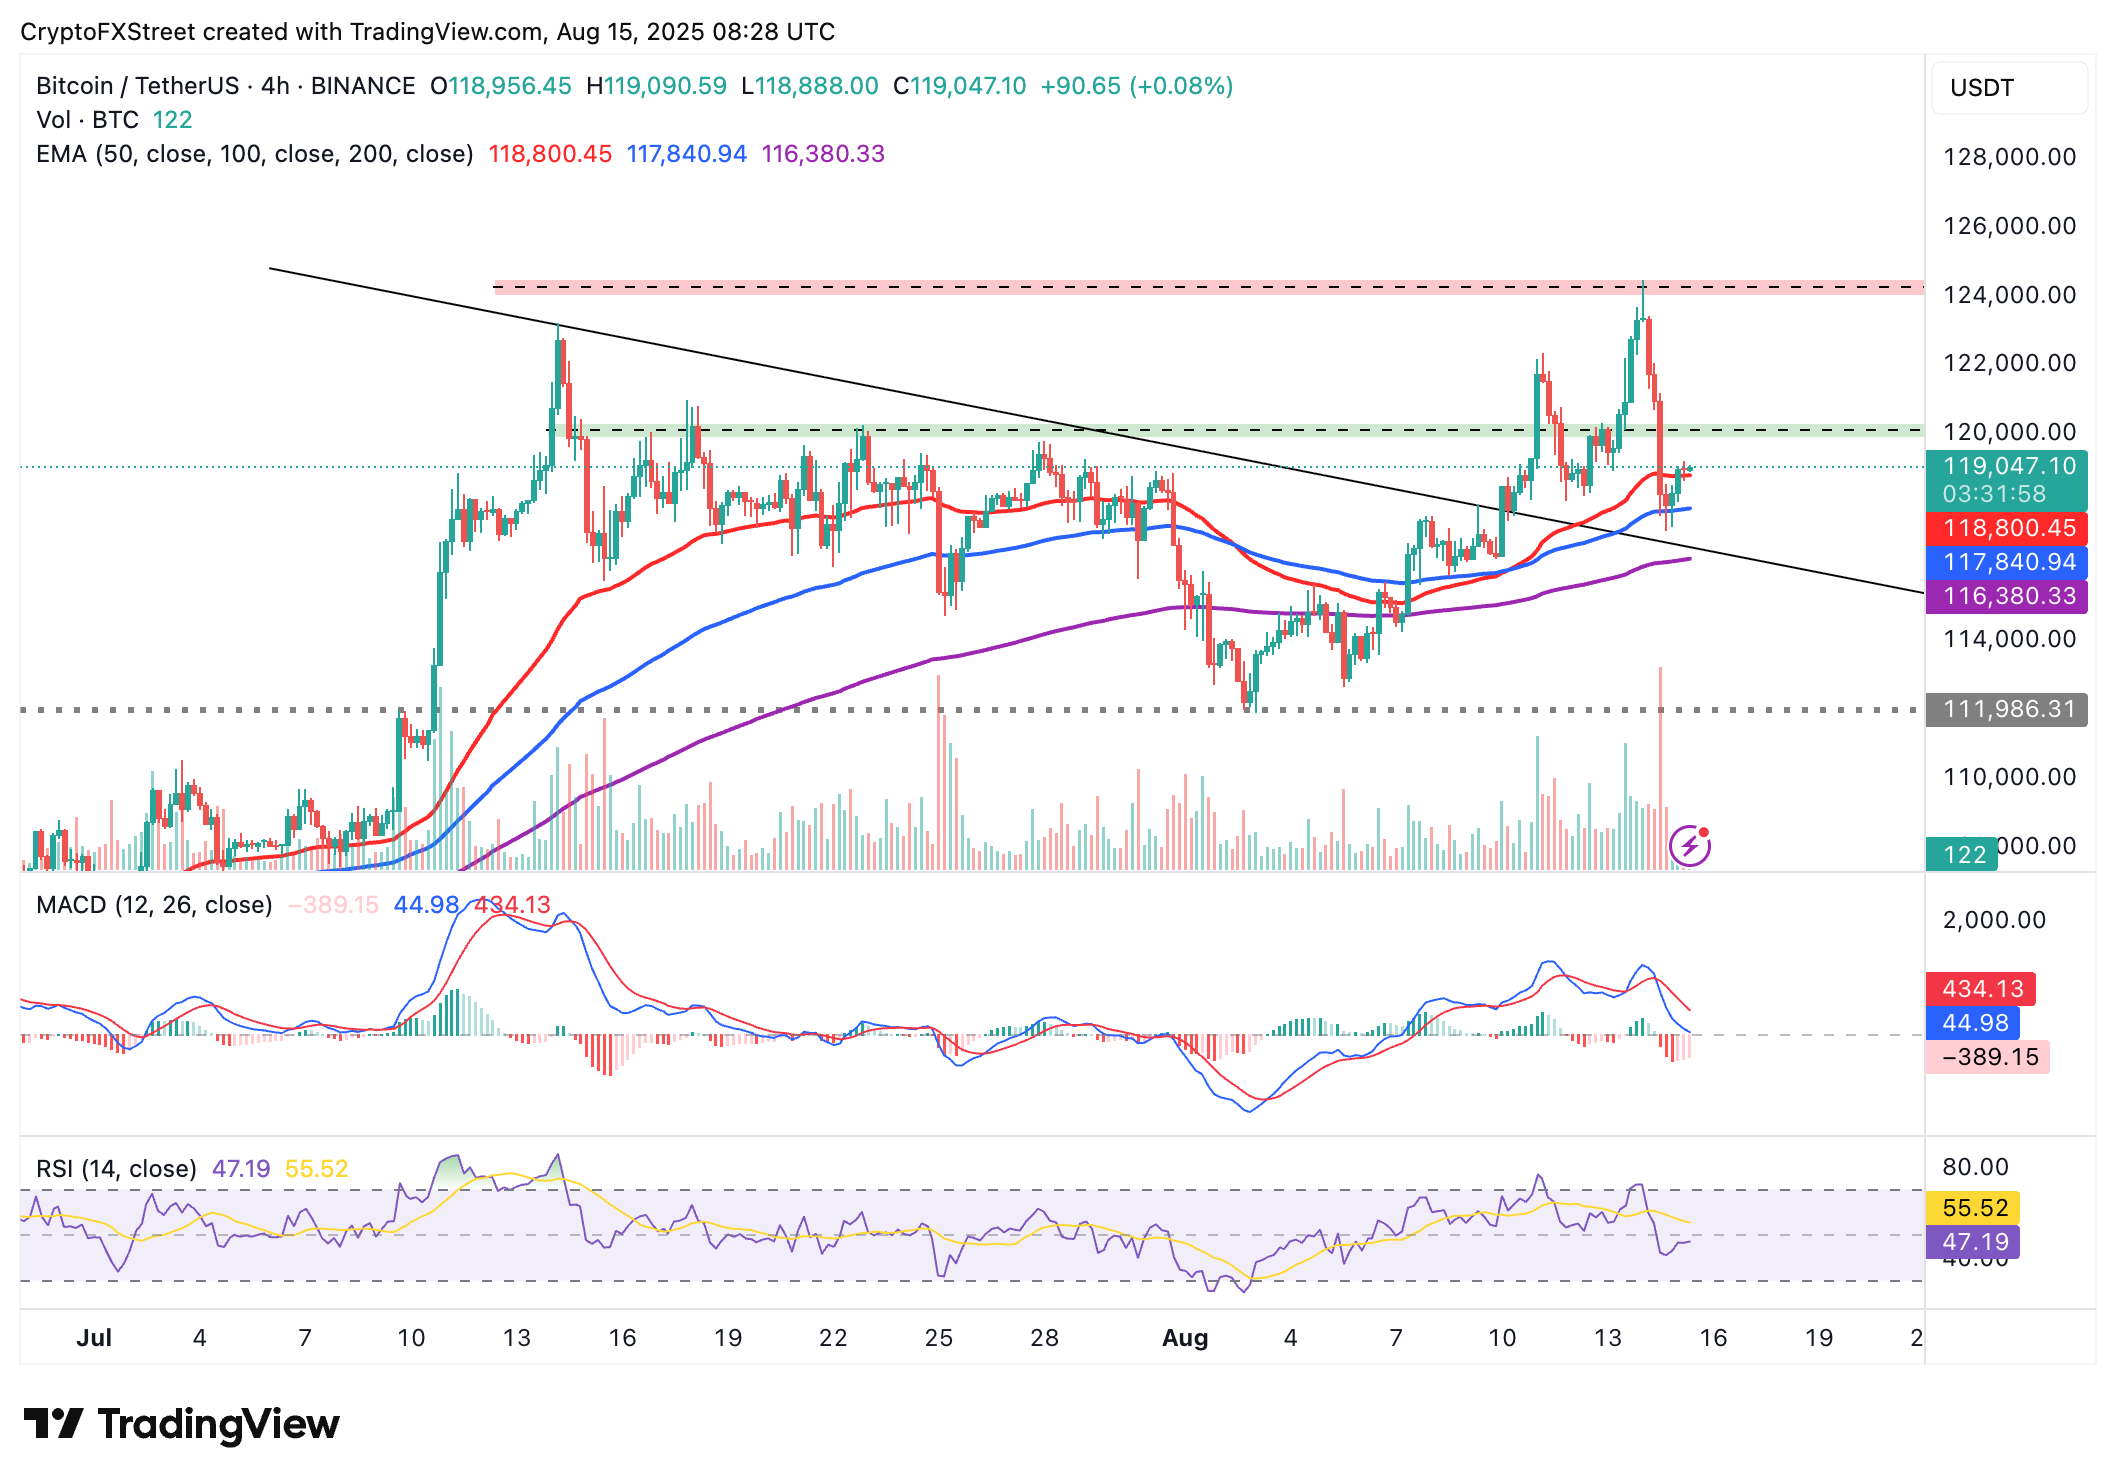
BTC/USDT 4-hour chart
Altcoins update: Ethereum, XRP eye short-term recovery
Ethereum holds above $4,600 as bulls look forward to a breakout to its record high of around $4,878 reached in November 2021. With the RSI holding in overbought territory and looking up, the path of least resistance could remain upward in upcoming sessions.
The MACD indicator highlights a buy signal confirmed on August 9, when the blue line crossed and settled above the red signal line. This is a bullish outlook encouraging investors to increase exposure, anticipating the price of ETH to extend the uptrend.
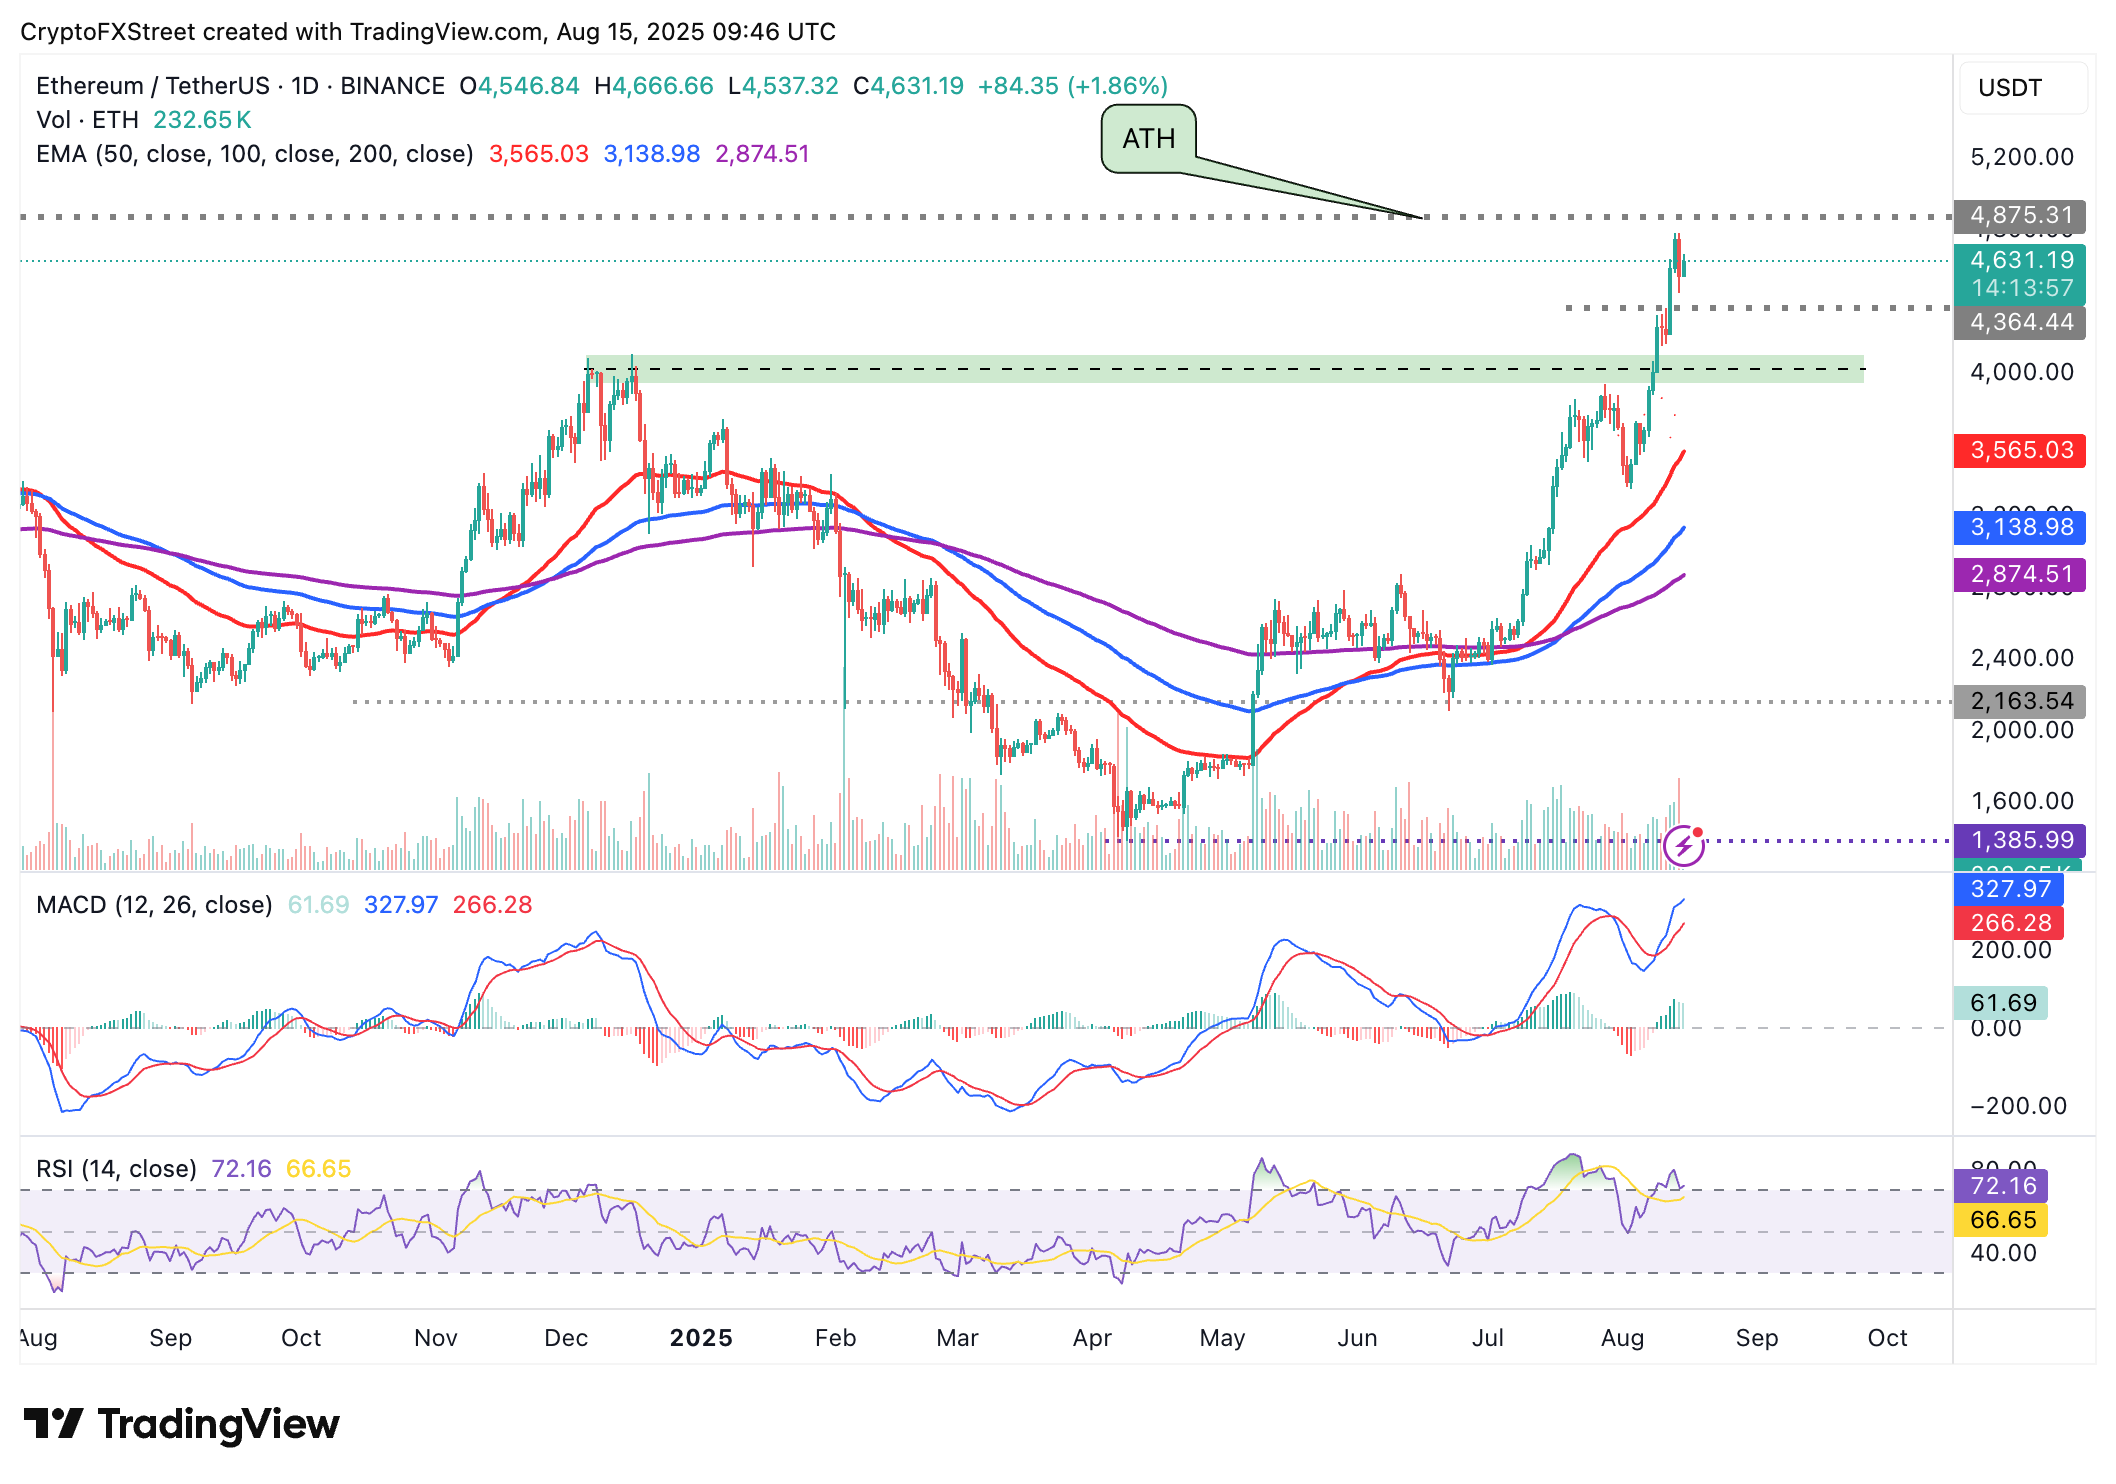
ETH/USDT daily chart
As for XRP, bears remain largely in control despite the upswing from support tested on Thursday at $3.00. The bearish outlook mirrors a MACD indicator sell signal that has been active since July 25.
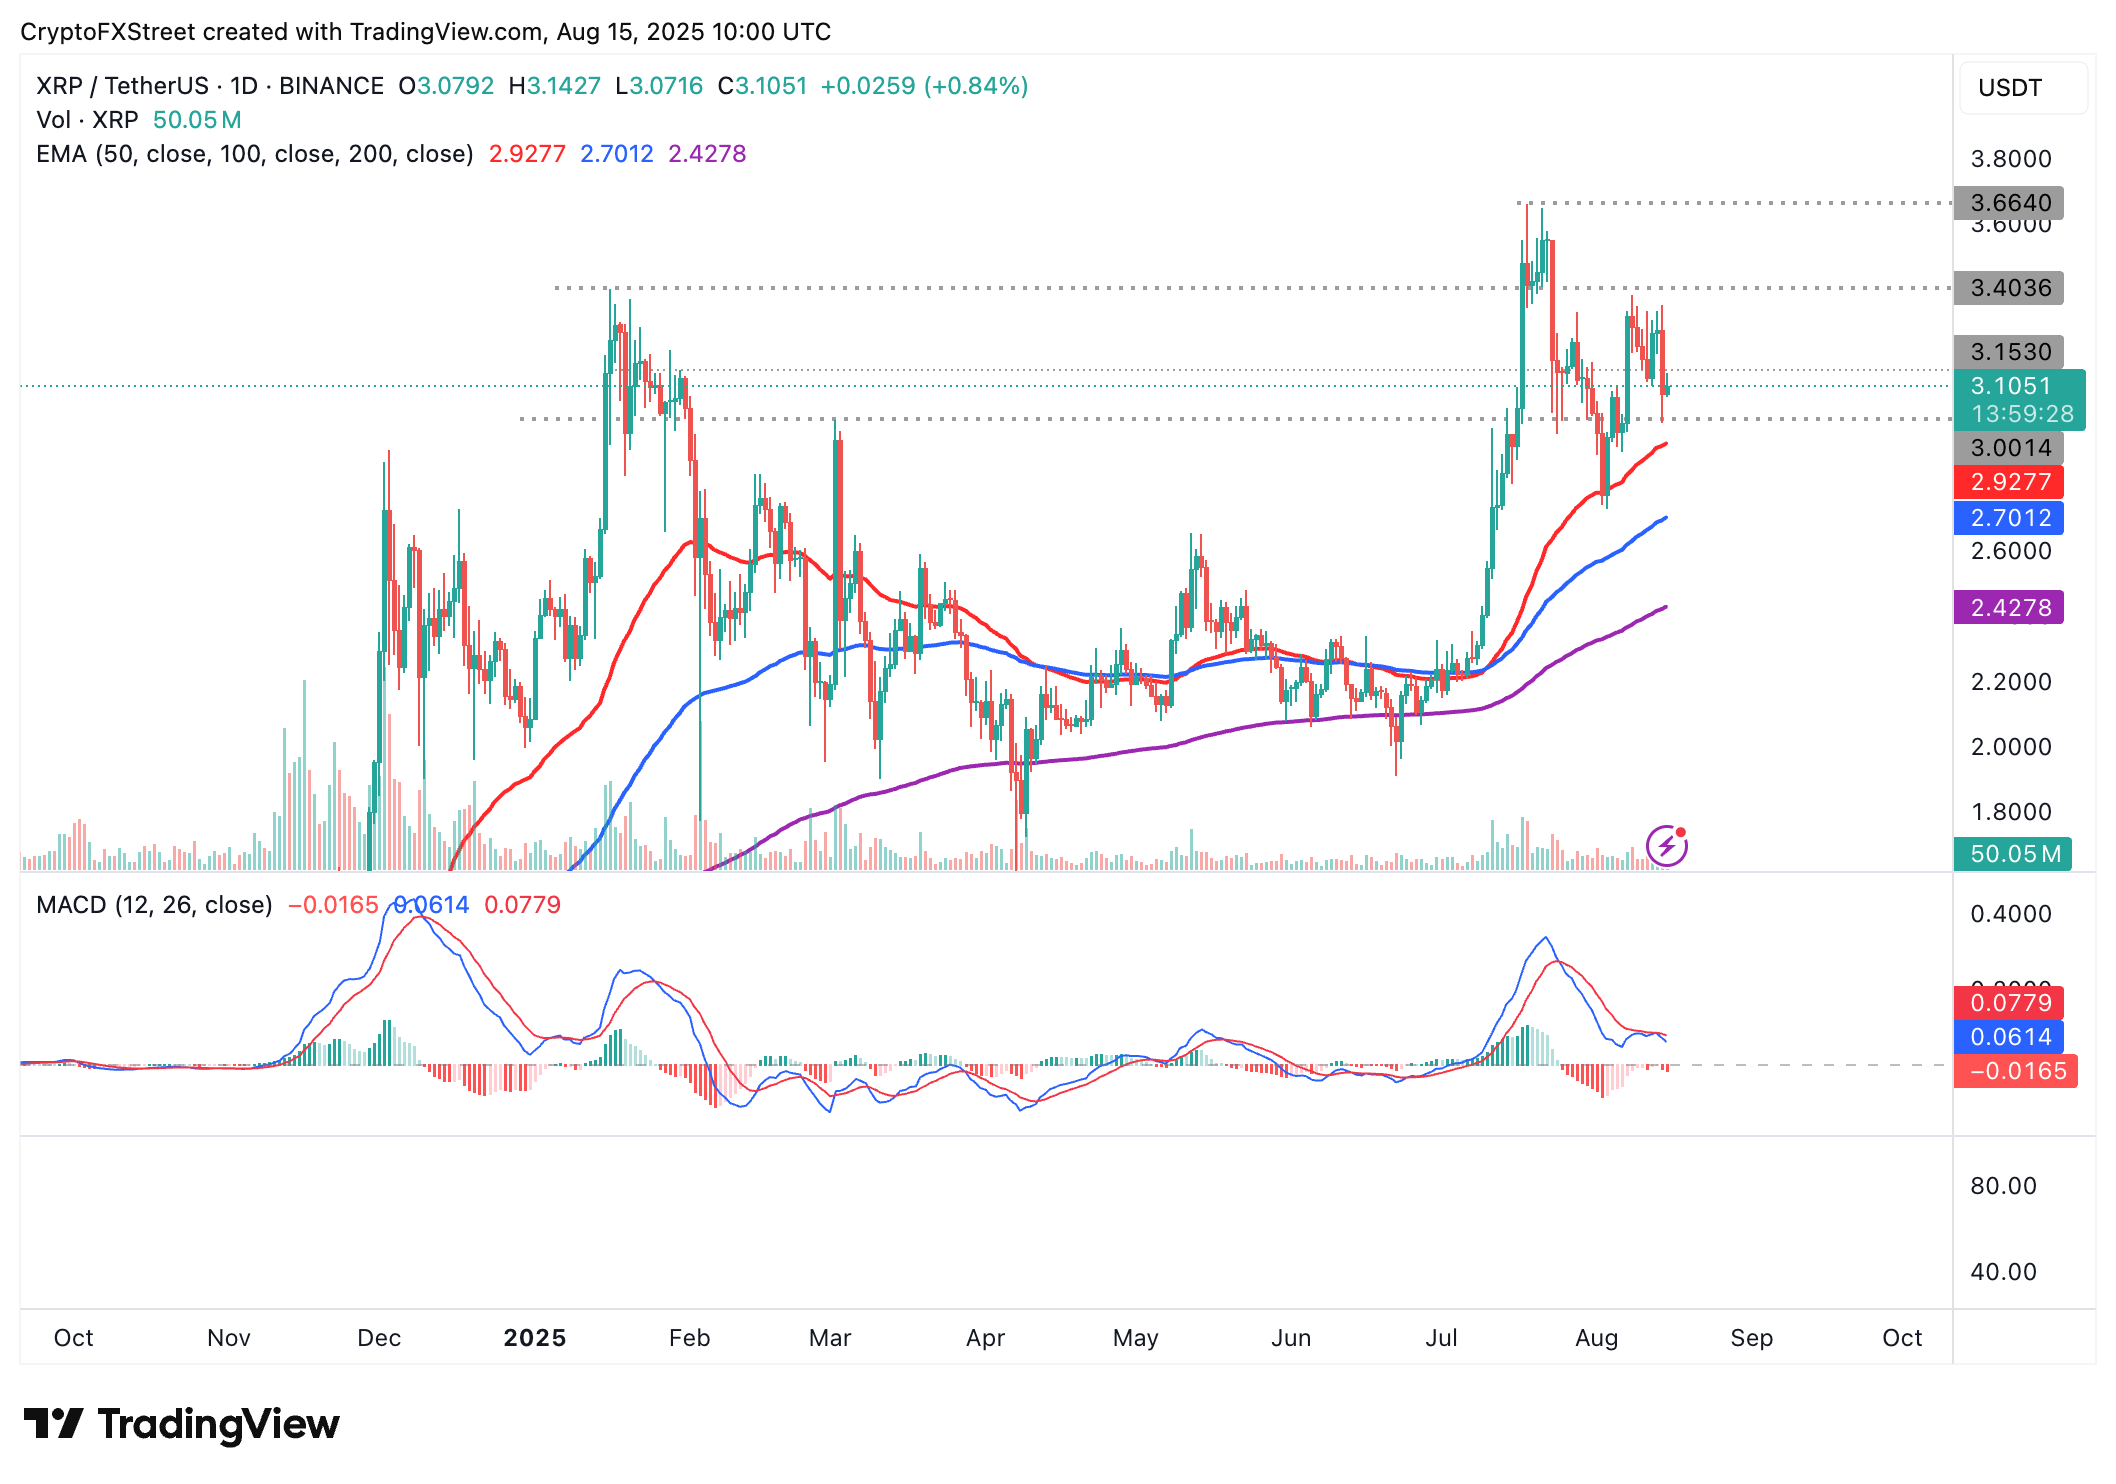
XRP/USDT daily chart
If investors continue de-risking, XRP could extend the decline below the short-term support at $3.00 toward the 50-day EMA at $2.92, the 100-day EMA at $2.70 and the 200-day EMA at $2.42.
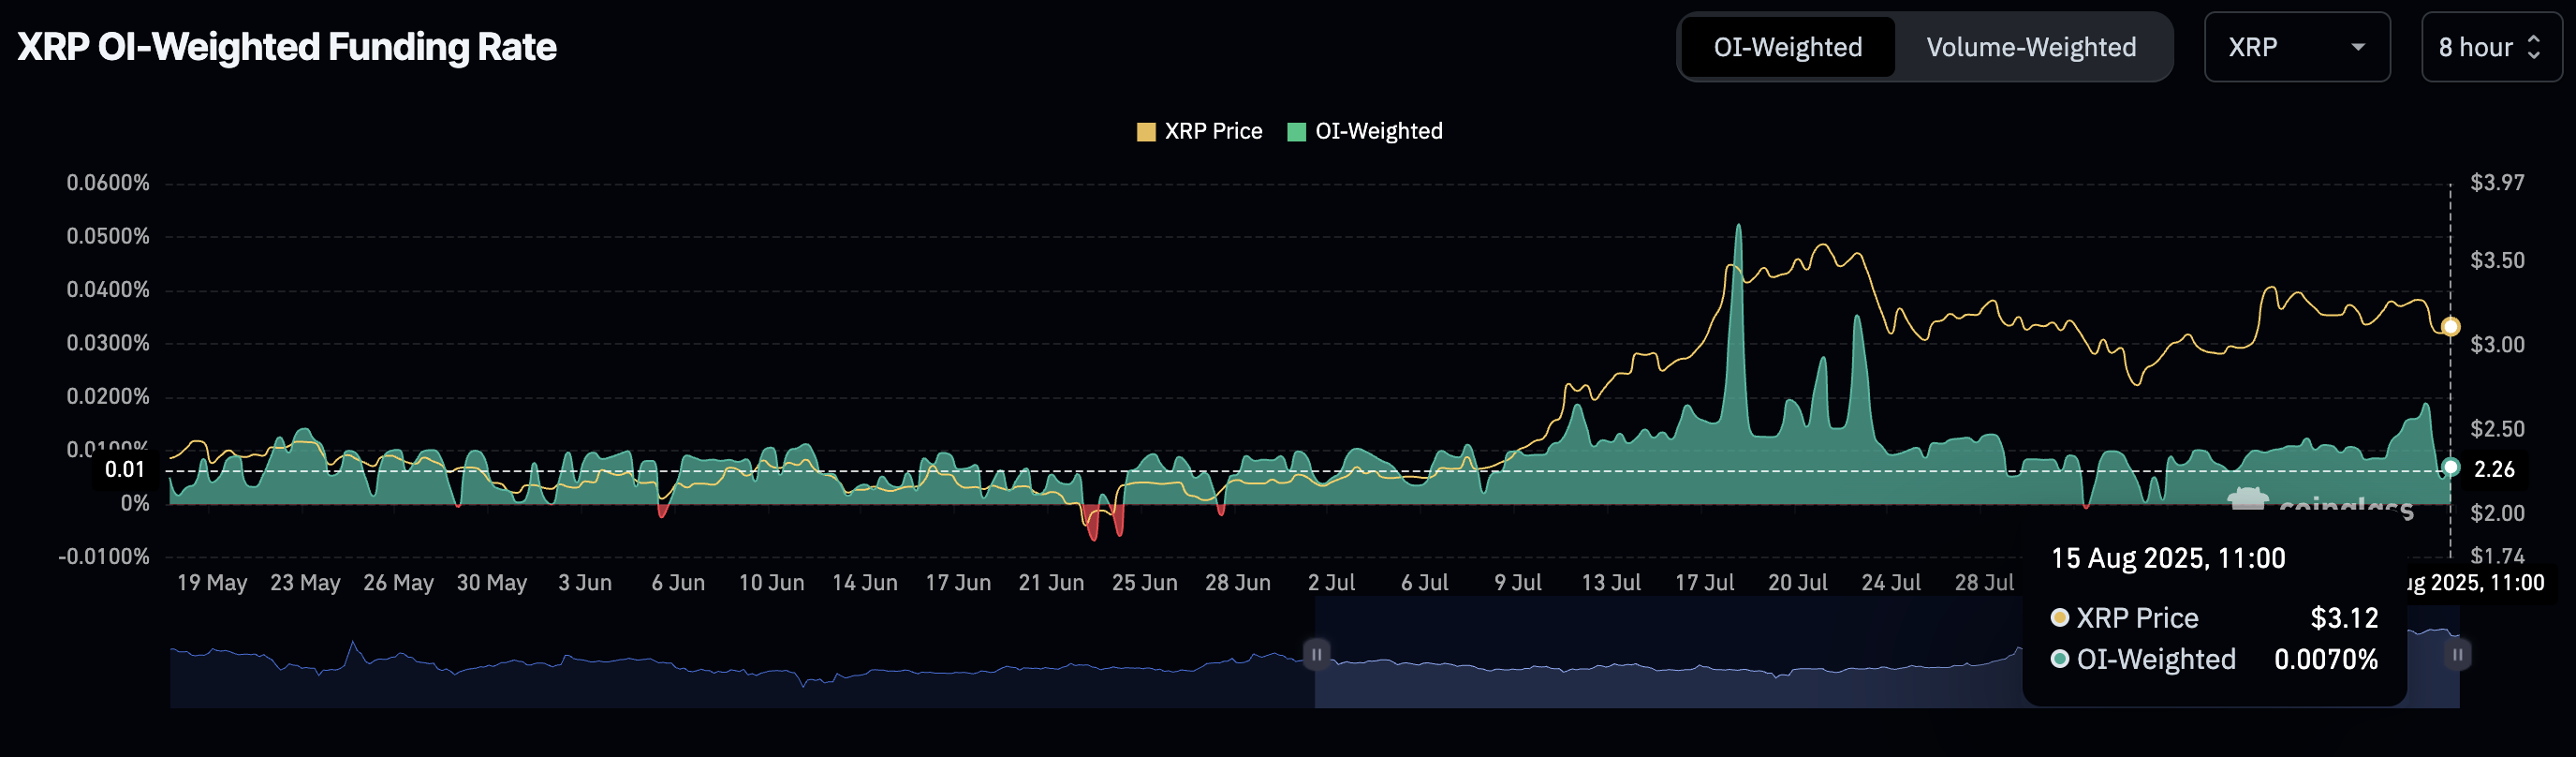
XRP Weighted Futures Funding Rate | Source: CoinGlass
Still, XRP could regain bullish momentum and rally toward the record high of $3.66, backed by a positive futures weighted funding rate as shown by CoinGlass derivatives data. Positive and growing funding rates indicate that traders are increasingly leveraging long positions in XRP amid renewed risk-on sentiment.
Bitcoin, altcoins, stablecoins FAQs
Bitcoin is the largest cryptocurrency by market capitalization, a virtual currency designed to serve as money. This form of payment cannot be controlled by any one person, group, or entity, which eliminates the need for third-party participation during financial transactions.
Altcoins are any cryptocurrency apart from Bitcoin, but some also regard Ethereum as a non-altcoin because it is from these two cryptocurrencies that forking happens. If this is true, then Litecoin is the first altcoin, forked from the Bitcoin protocol and, therefore, an “improved” version of it.
Stablecoins are cryptocurrencies designed to have a stable price, with their value backed by a reserve of the asset it represents. To achieve this, the value of any one stablecoin is pegged to a commodity or financial instrument, such as the US Dollar (USD), with its supply regulated by an algorithm or demand. The main goal of stablecoins is to provide an on/off-ramp for investors willing to trade and invest in cryptocurrencies. Stablecoins also allow investors to store value since cryptocurrencies, in general, are subject to volatility.
Bitcoin dominance is the ratio of Bitcoin's market capitalization to the total market capitalization of all cryptocurrencies combined. It provides a clear picture of Bitcoin’s interest among investors. A high BTC dominance typically happens before and during a bull run, in which investors resort to investing in relatively stable and high market capitalization cryptocurrency like Bitcoin. A drop in BTC dominance usually means that investors are moving their capital and/or profits to altcoins in a quest for higher returns, which usually triggers an explosion of altcoin rallies.
Bài viết đề xuất


