
Crypto Gainers Today: PUMP eyes further recovery as BCH, CRO rally
- Pump.fun edges higher, eyeing further recovery.
- Bitcoin Cash inches closer to reclaiming the $600 milestone.
- Cronos remains in an uptrend for the ninth day amid heightened buying pressure.
The Solana (SOL)-based meme coin launchpad, Pump.fun (PUMP), leads the market recovery with double-digit gains over the last 24 hours. Bitcoin Cash (BCH) and Cronos (CRO) continue to rally and secure the silver and bronze ranks at press time. The technical outlook remains mixed for PUMP as it forms a rising wedge pattern, while the BCH and CRO rallies could extend amid heightened buying pressure.
Pump.fun remains trapped in a rising wedge
PUMP edges higher by 5% at press time on Tuesday, extending the 10% gains from Monday. The meme coin launchpad token forms a rising wedge pattern on the 4-hour chart (shared below).
A decisive close above the overhead trendline at $0.003776 would mark a bullish breakout of the wedge pattern, potentially extending the uptrend to the $0.005000 psychological level.
The Moving Average Convergence Divergence (MACD) indicator flashed a buy signal as green histograms surged with the signal line crossing over. Furthermore, the Relative Strength Index (RSI) reads 60 on the 4-hour chart, indicating an upward trend, which signals increasing buying pressure.
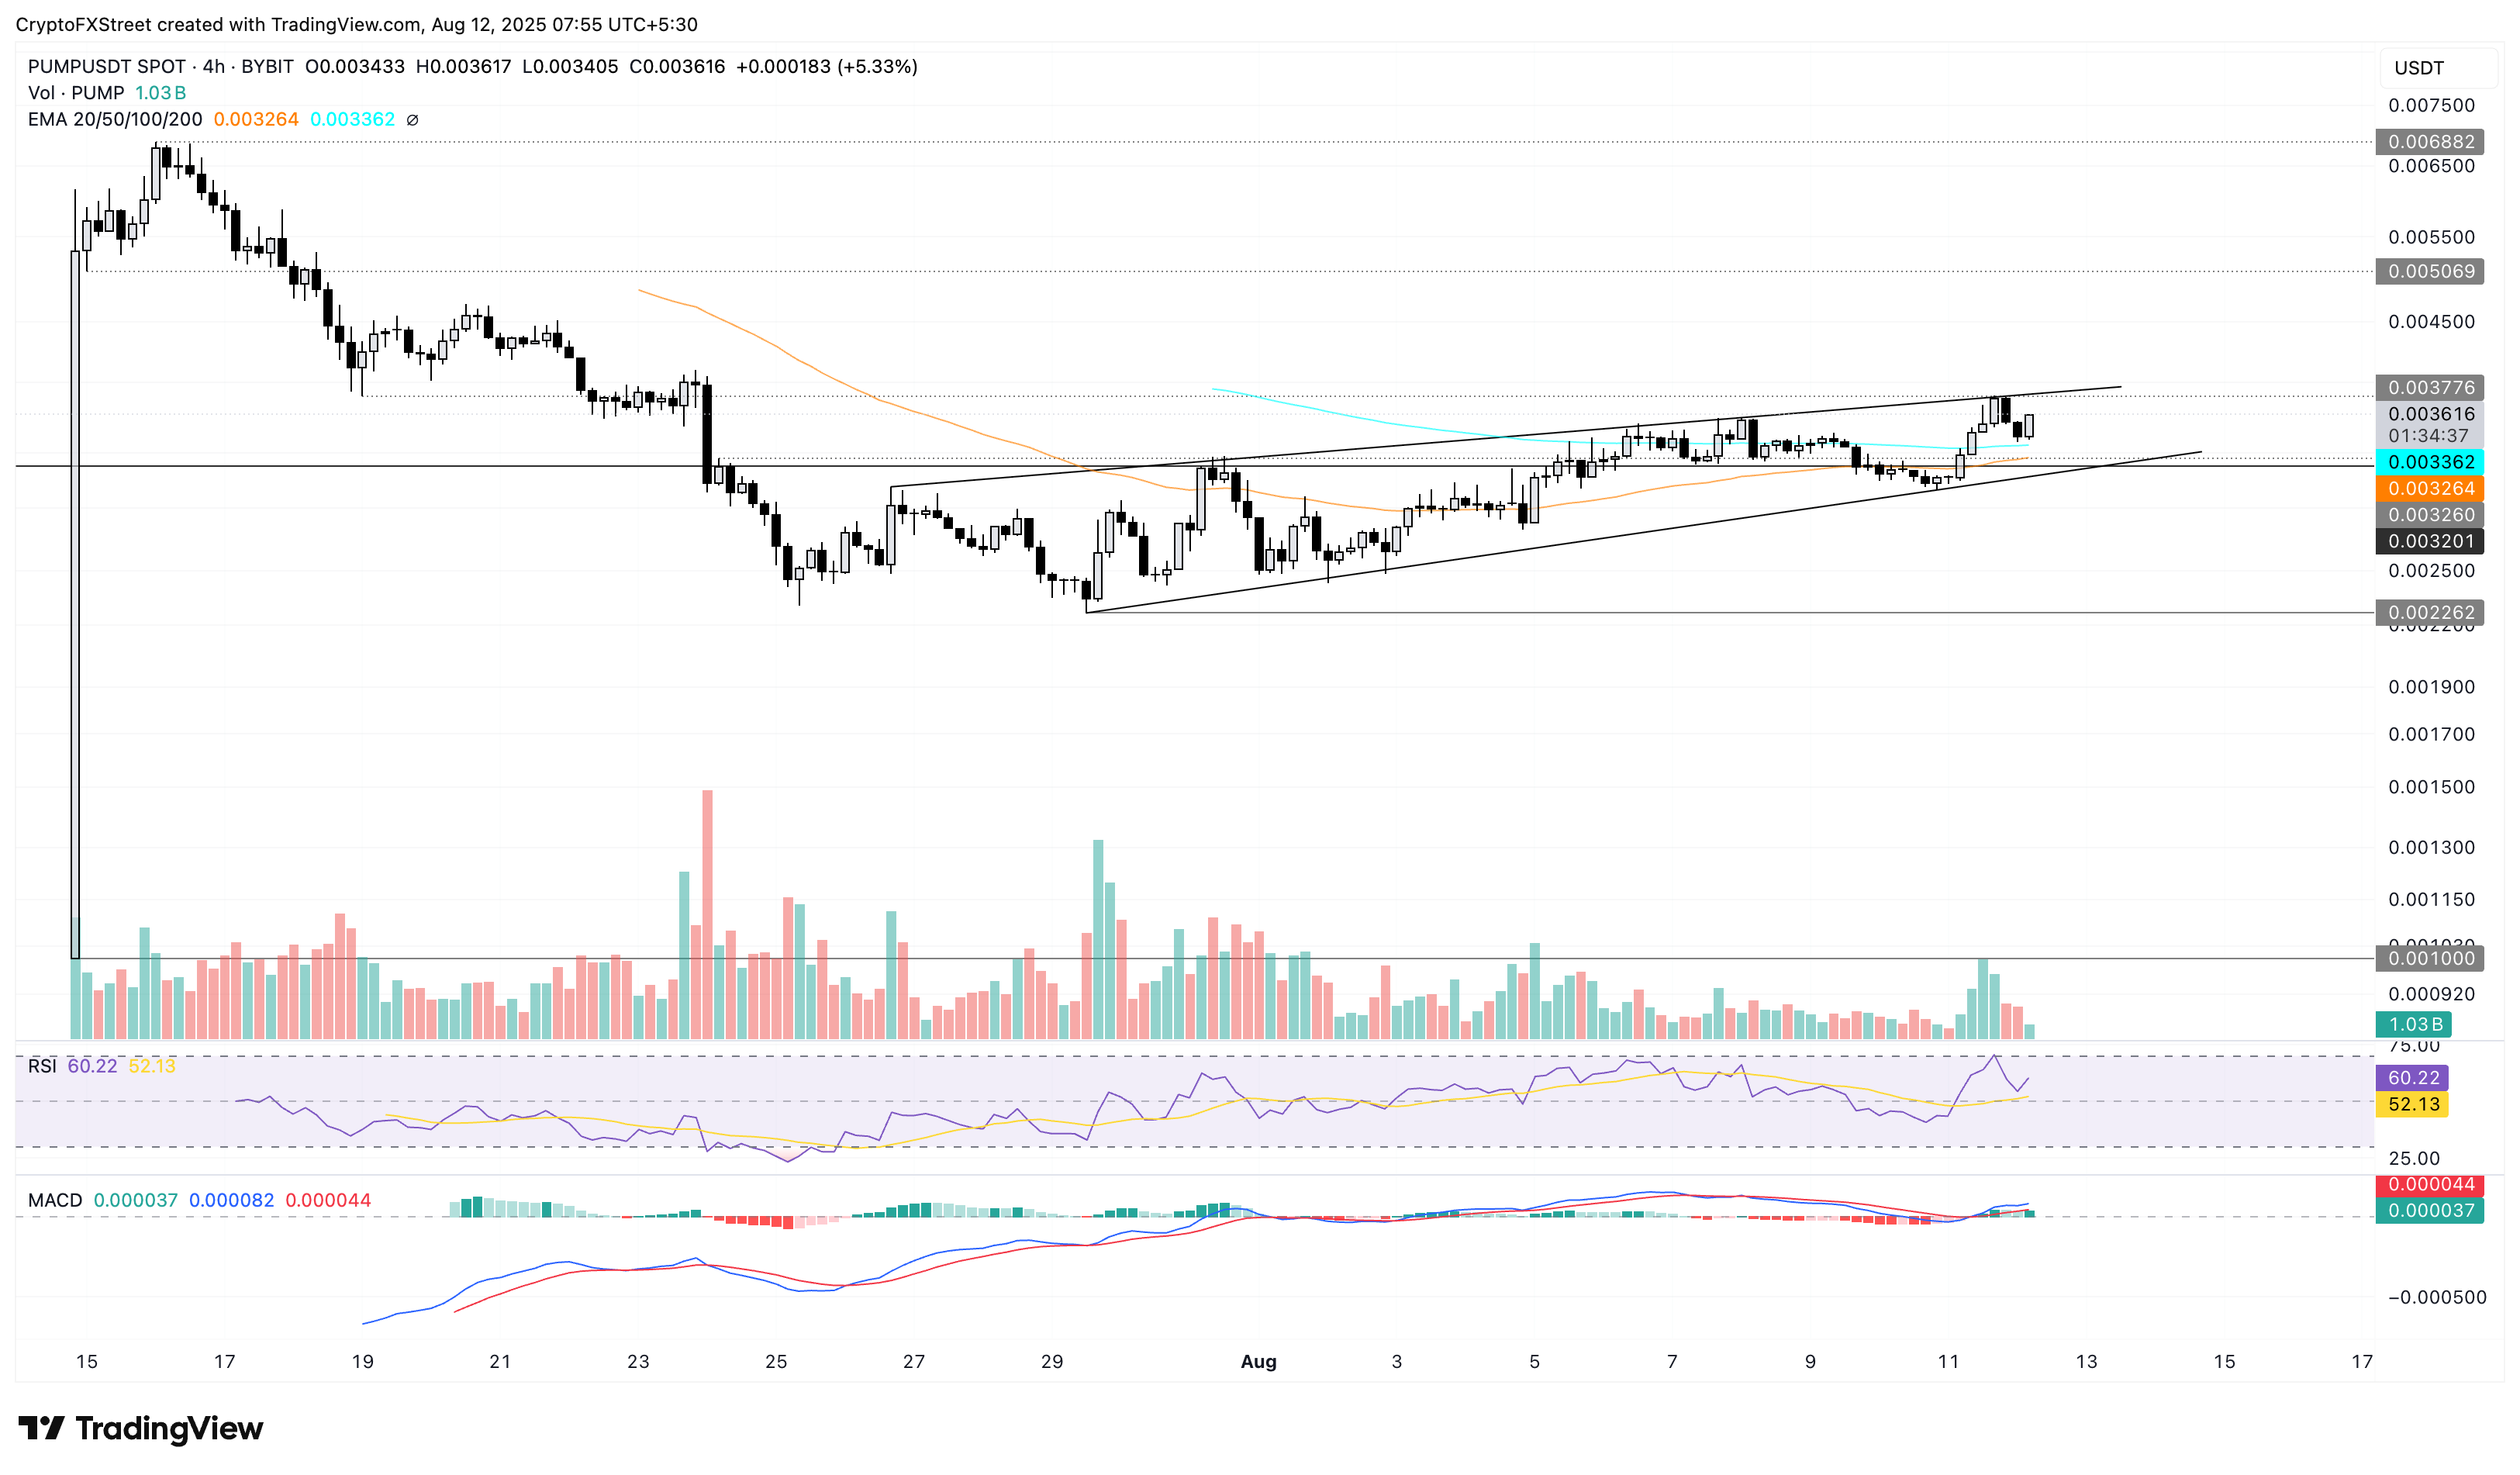
PUMP/USDT daily price chart.
Looking down, a reversal within the wedge pattern could retest the lower support trendline near $0.003260.
Bitcoin Cash targets a new annual high
Bitcoin Cash has appreciated by 3% so far on Tuesday, marking its third consecutive bullish day. The uptrend in BCH crosses above the crucial $590 resistance level, which has remained intact since July 28.
A decisive close above this level would increase the chances of BCH surpassing the $604 peak from July 27. In such a case, Bitcoin Cash could target the $640 peak from December 7.
The technical indicators maintain a bullish incline, as the MACD and signal line trend upward with rising green histogram bars, indicating increasing trend momentum. Furthermore, the RSI, at 61, heads higher toward the overbought zone, with room for further growth.
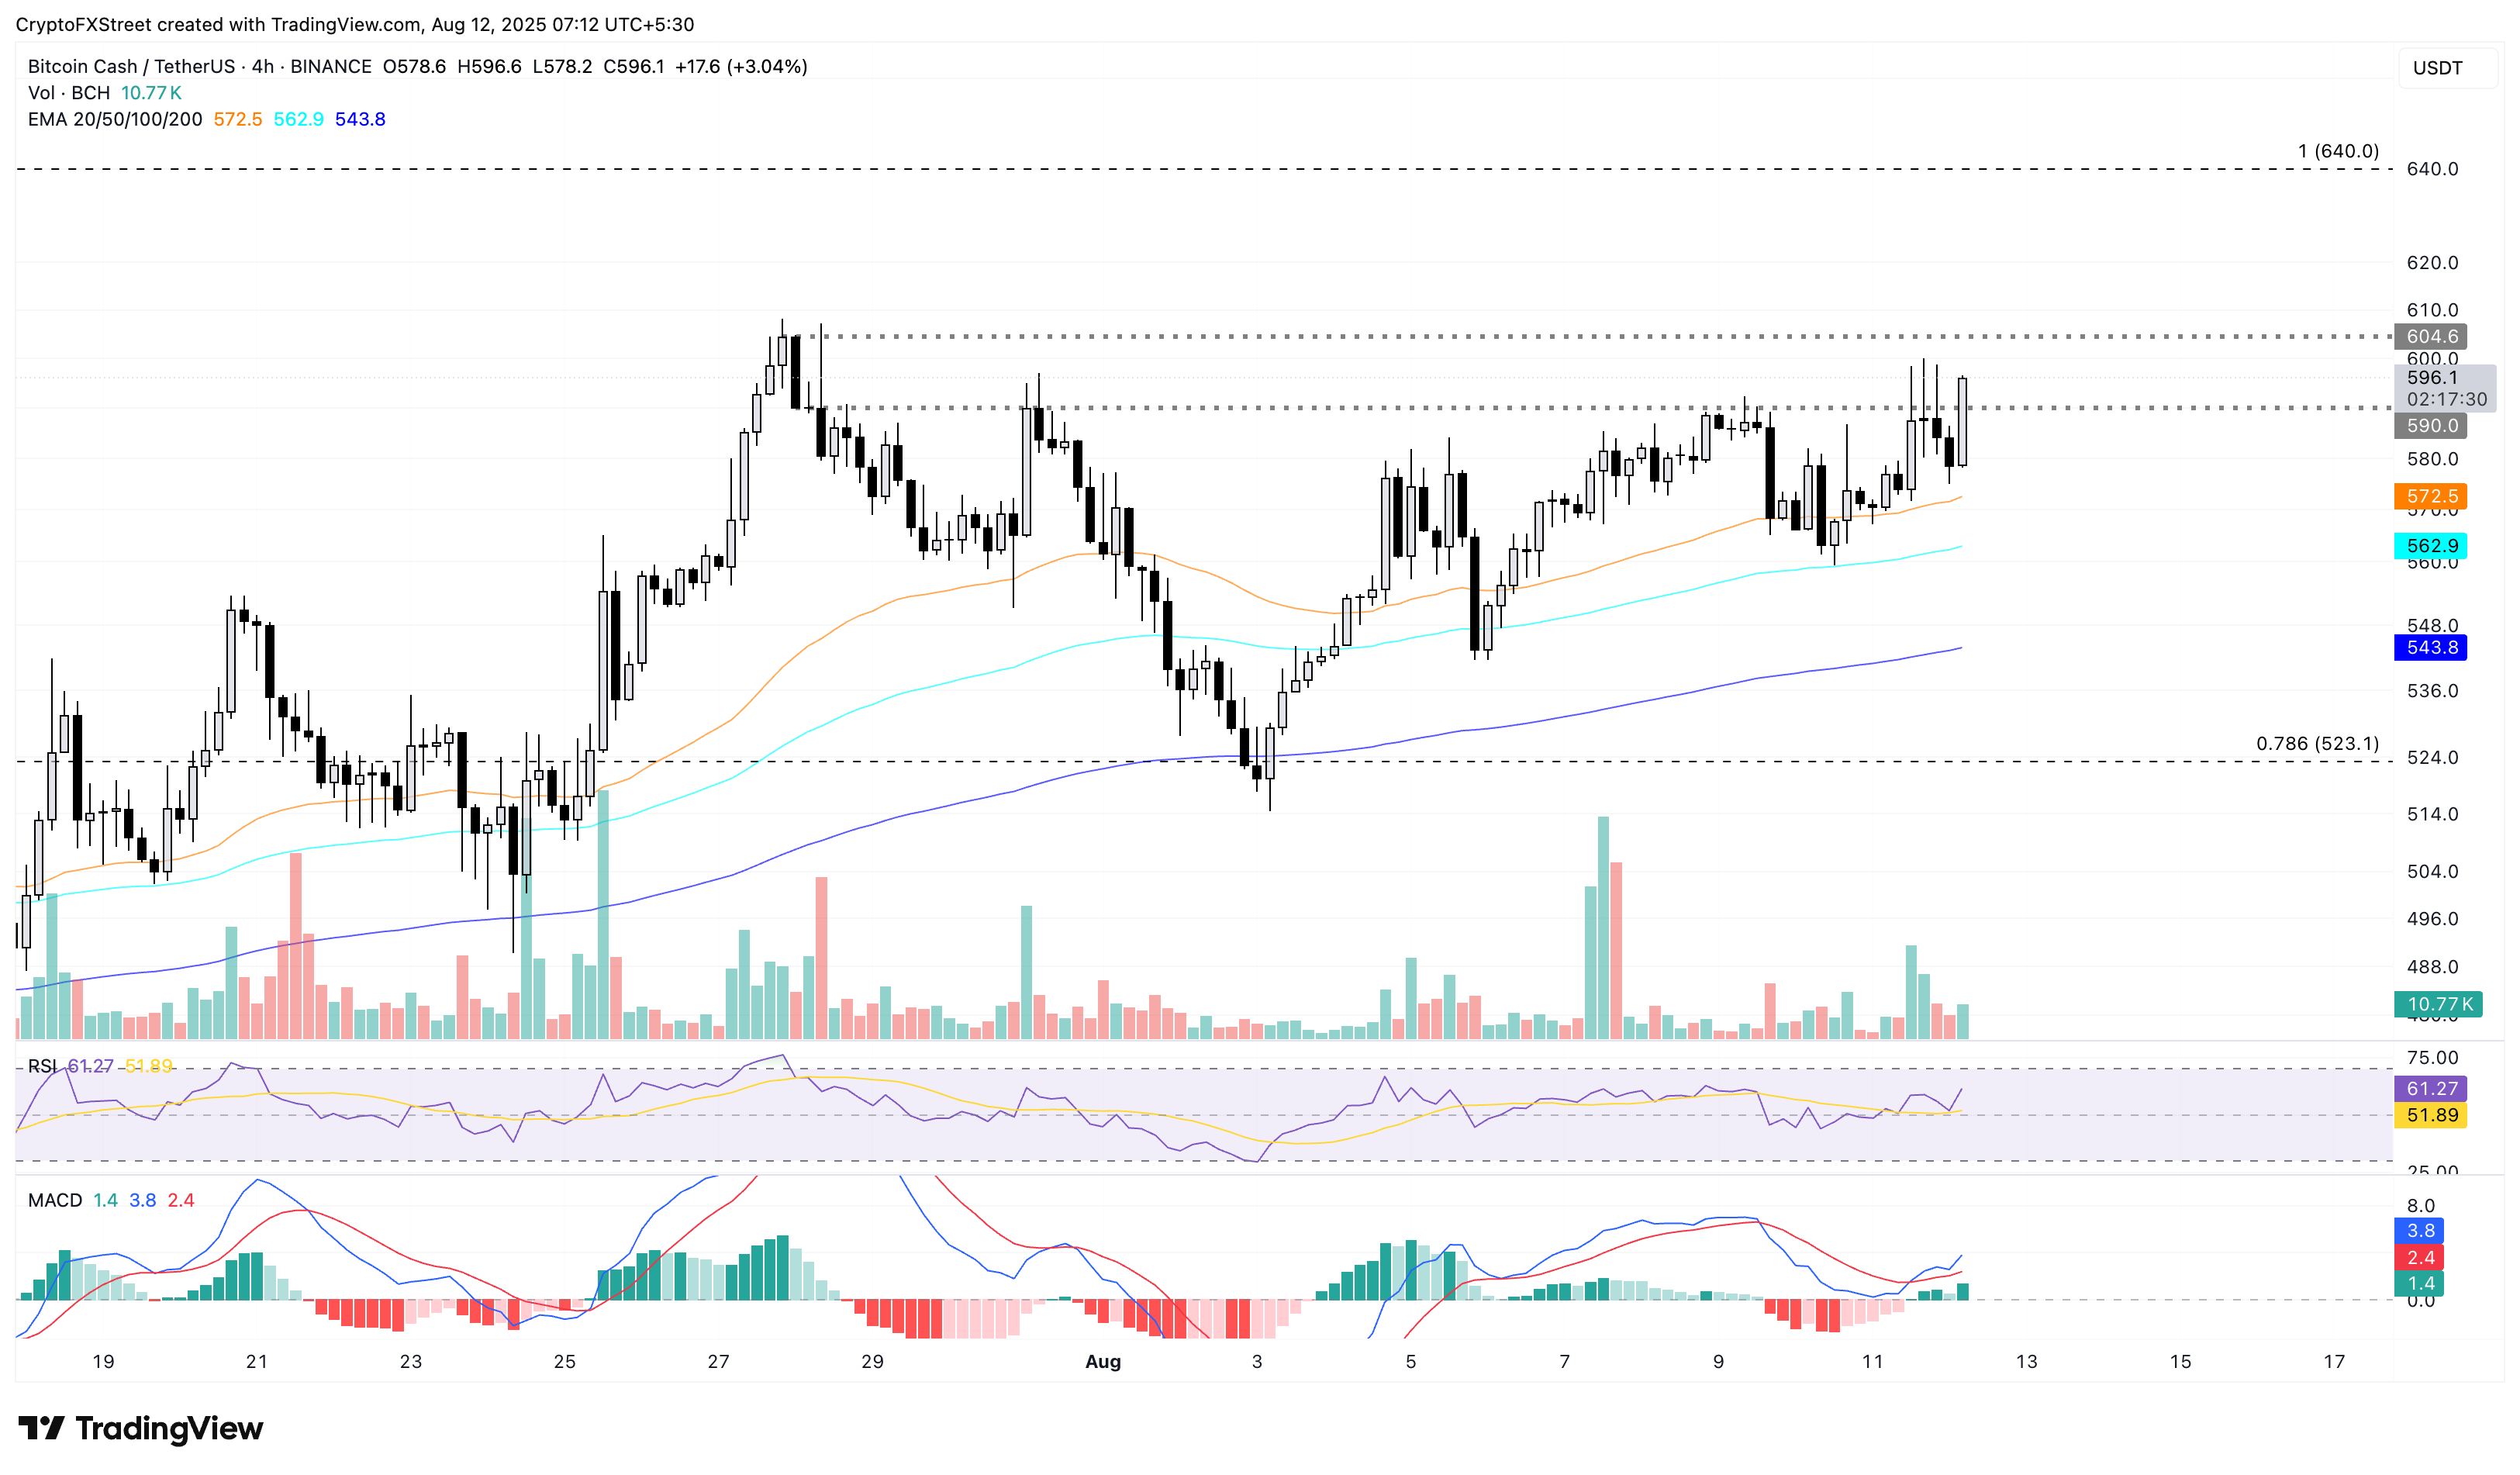
BCH/USDT daily price chart.
On the flipside, a reversal in BCH below the $590 level could retest the 50-period Exponential Moving Average at $572.
Cronos uptrend eyes further recovery
Cronos ticks higher by nearly 2% at press time on Tuesday, extending the uptrend for the ninth day. The uptrend targets the 78.6% Fibonacci level at $0.18053, which is drawn from the $0.23531 peak on November 11 to the $0.06820 low on February 28.
The Golden Cross between the 100- and 200-day EMAs aligns positively with the 50-day EMA, signaling a buy opportunity. Investors could consider the rising EMAs as dynamic support levels in the event of a bearish reversal.
The MACD indicator flashed a buy signal on Friday as the green histogram resurfaced, accompanied by average line crossover signals, indicating a resurgence of bullish momentum. Furthermore, the RSI at 76 on the daily chart enters the overbought zone, indicating heightened buying pressure.
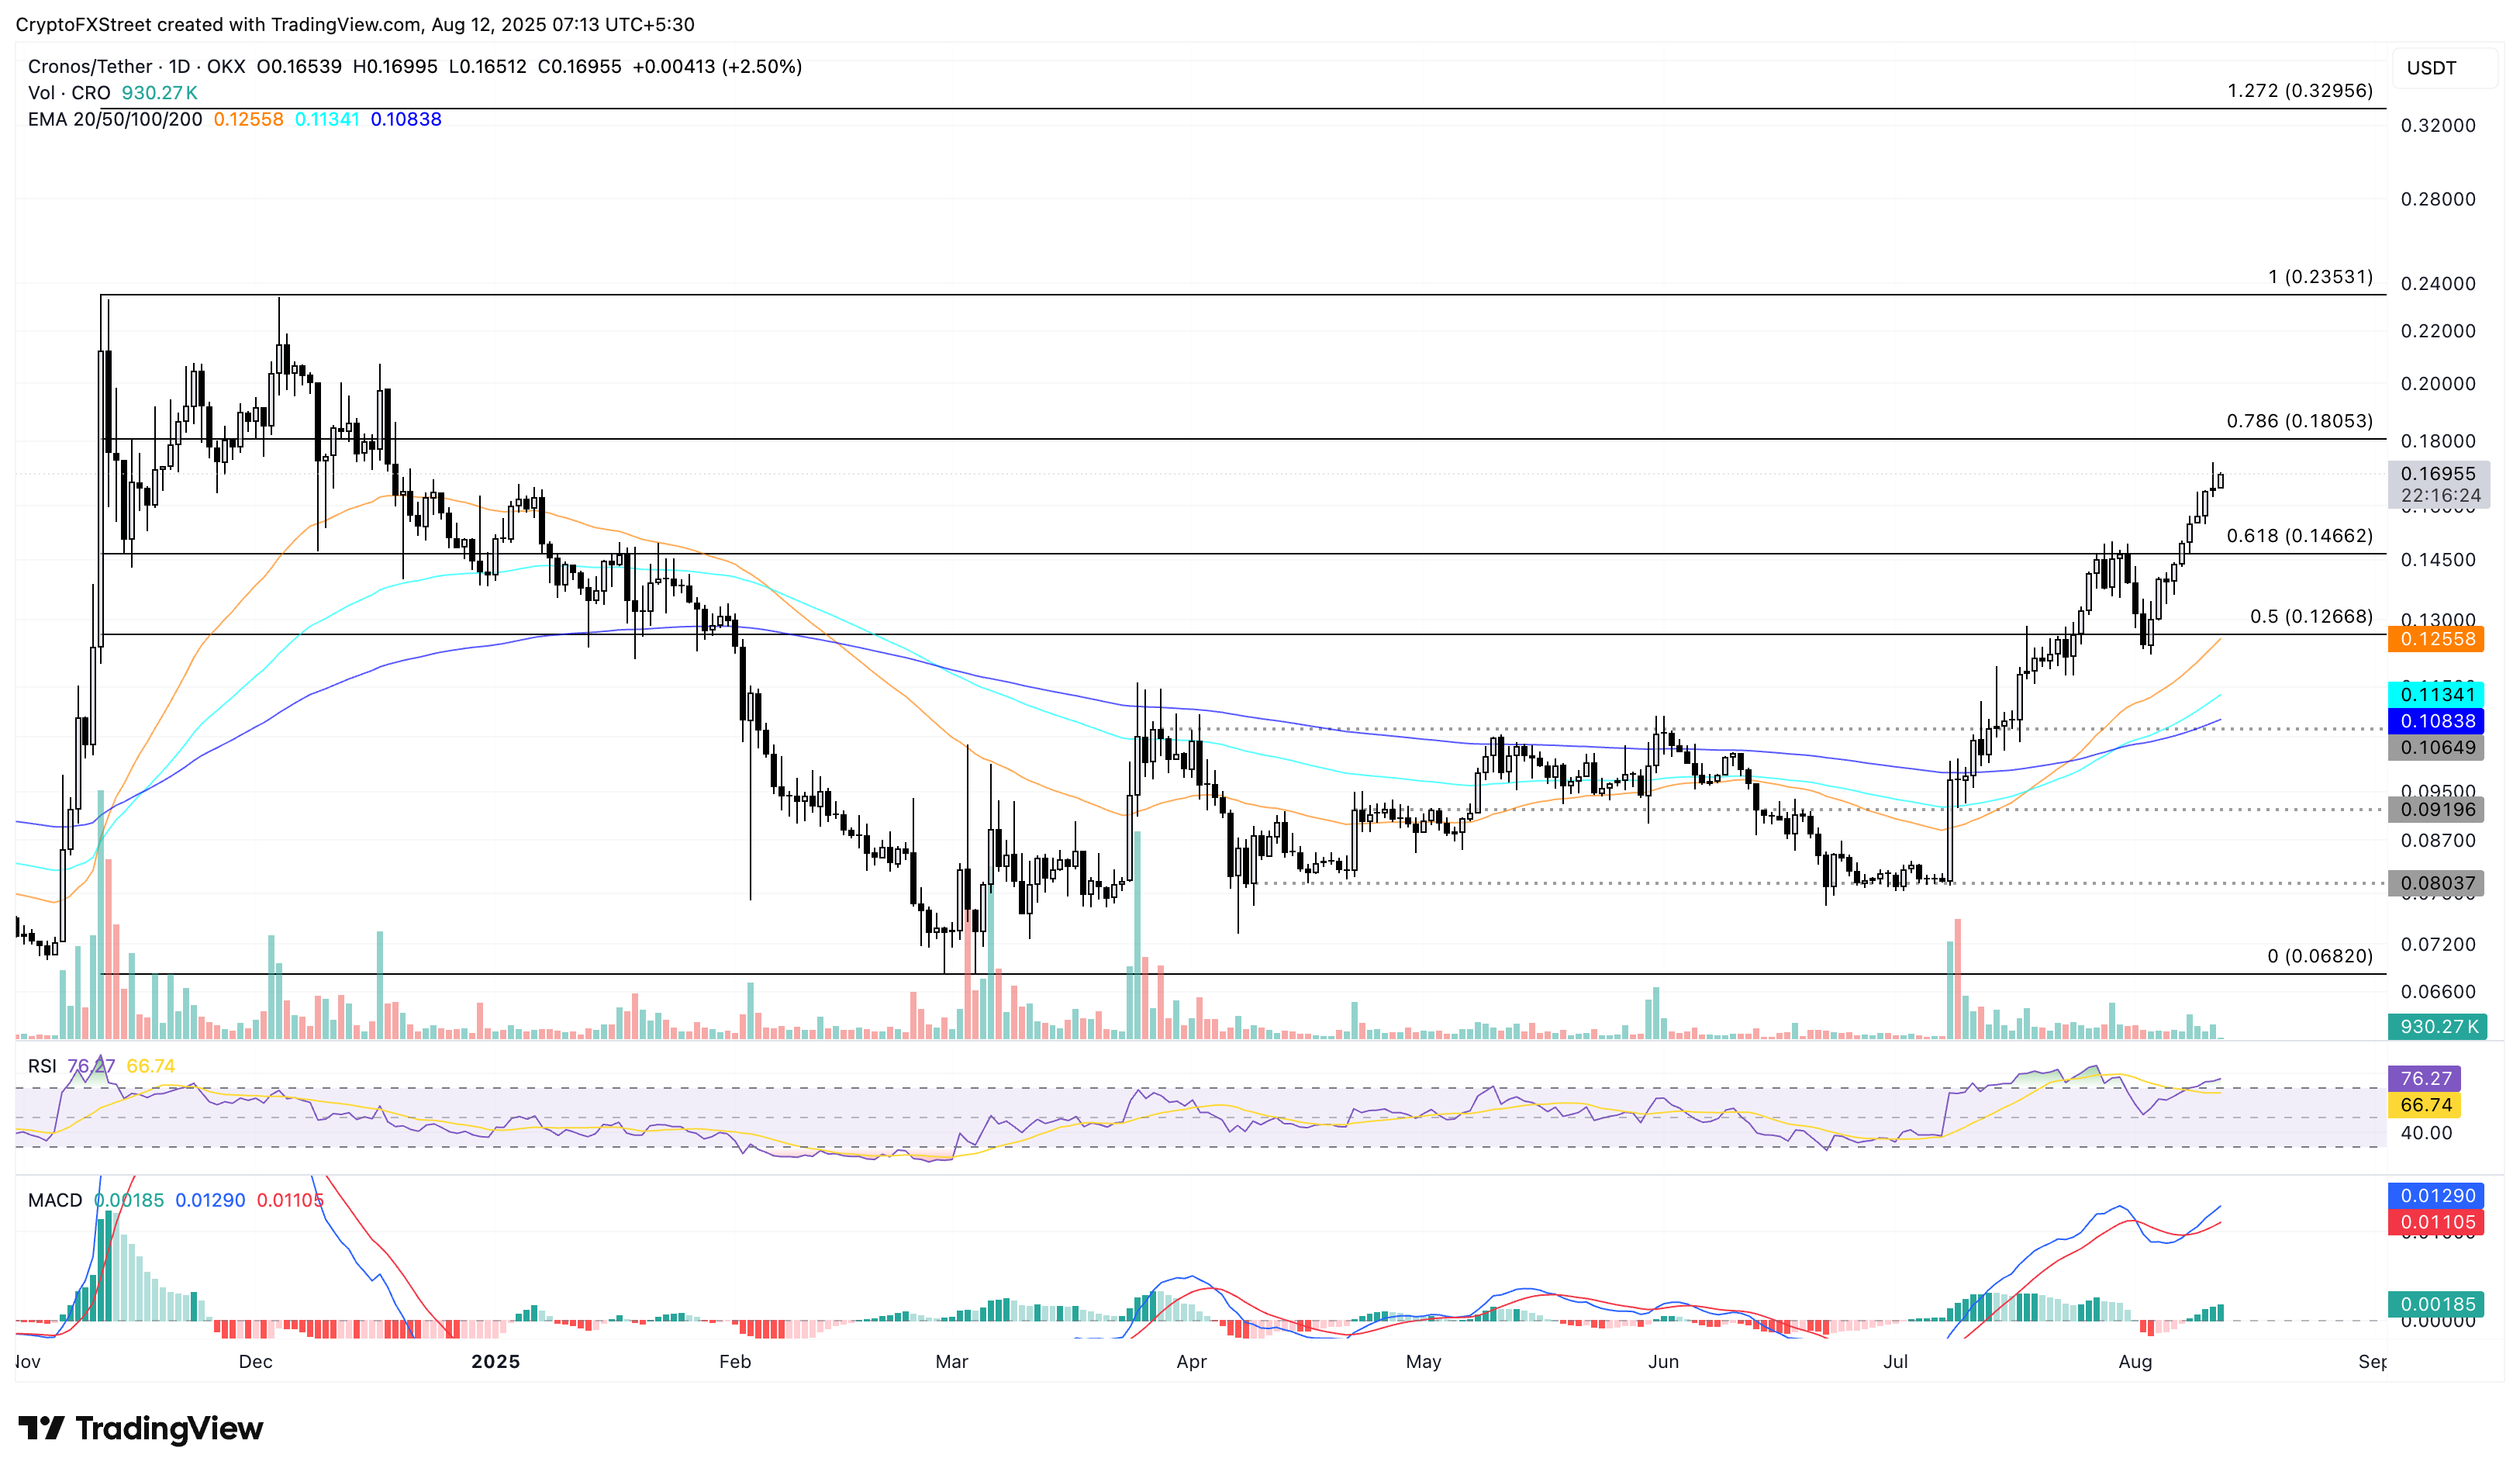
CRO/USDT daily price chart.
On the downside, a reversal in CRO could retest the 61.8% Fibonacci level at $0.14662.
Bài viết đề xuất


