
Chainlink Price Forecast: LINK brings high-quality forex and precious metals data on-chain
- Chainlink price faces resistance around the daily level of $22.05, a firm close above suggests a rally ahead.
- Chainlink announces a partnership with ICE Markets to bring high-quality forex and precious metals data onchain.
- Open interest rises to $1.21 billion while some holders realize profits.
Chainlink (LINK) price faces resistance around the daily level of $22.05, and trades around $21.47 at the time of writing on Tuesday after rallying over 35% last week. A decisive close above this resistance could suggest a further rally ahead. Moreover, LINK announced on Monday a partnership with ICE Markets to bring high-quality derived forex and precious metals data on-chain, accelerating mainstream adoption of on-chain finance. Meanwhile, on-chain and derivatives data suggest mixed sentiment as Open Interest (OI)rises to $1.21 billion while some holders realize profits.
Chainlink partners with ICE Markets to accelerate mainstream adoption of onchain finance
Chainlink announced a partnership with ICE Markets on Monday to bring high-quality derived forex and precious metals data onchain. Chainlink will utilize ICE Consolidated feed data to derive FX and precious metals rates, which will be distributed on-chain via Chainlink Data Streams. This development will accelerate mainstream adoption of onchain finance.
This announcement is a bullish sign for Chainlink and its native token LINK in the long term as it provides over 2,000 apps, banks, and asset managers access to tamper-resistant market data, enhancing greater network usage and adoption.
Maurisa Baumann, VP, Global Data Delivery Platforms at ICE, said, “With content from over 300 global exchanges and marketplaces, the ICE Consolidated Feed offers trusted, structured multi-asset class data to banks, asset managers, and ISVs located around the world. We’re happy to work with Chainlink to securely and reliably provide data for onchain markets, which is an important step in growing the global blockchain economy.”
Apart from this announcement, Chainlink announced the launch of the “Chainlink Reserve” last week on Thursday, a strategic LINK reserve pool designed to accumulate LINK tokens generated from enterprise integration and on-chain service revenue, further bolstering its bullish outlook.
Chainlink open interest reaches $1.21 billion, nearing its record highs
Futures’ OI in Chainlink at exchanges rose from $814.50 million on August 6 to $1.21 billion on Tuesday, nearing its all-time high of $1.22 billion back in January 22. Rising OI represents new or additional money entering the market and new buying, which could fuel the current LINK price rally.
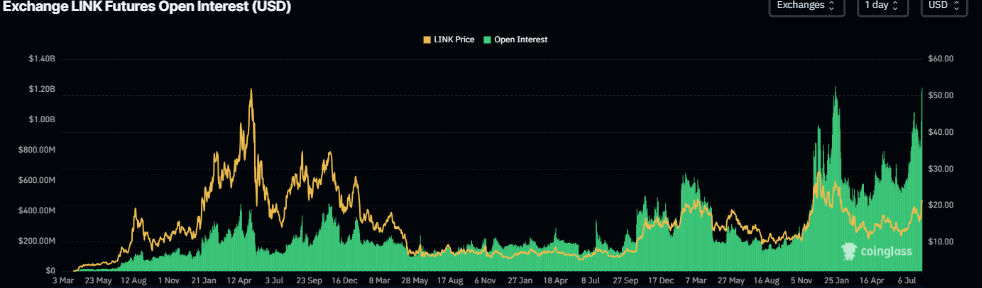
LINK Open Interest chart. Source: CoinGlass
Despite the rising open interest, traders should still remain cautious of a potential short-term pullback as LINK’s 35% rally last week has prompted some holders to lock in profits. Santiment’s Network Realized Profit/Loss (NPL) metric, as shown in the graph below, highlighted a significant spike on Monday. This spike indicates that holders are, on average, selling their bags at a significant profit and increasing the selling pressure.
 [10-1754977320966-1754977320970.43.39, 12 Aug, 2025].png)
LINK NPL chart. Source: Santiment
Chainlink Price Forecast: LINK faces resistance around $22.05 level
Chainlink price faced resistance around its daily level of $22.05, which coincides with the February 3 high on Monday, following a rally of over 35% the previous week. At the time of writing on Tuesday, it trades around $21.47.
If LINK closes above the daily level of $22.05, it could extend the rally toward its next key resistance at $26.37.
The Relative Strength Index (RSI) reads 66 above its neutral level of 50 and points upwards, indicating strong bullish momentum. The Moving Average Convergence Divergence (MACD) also showed a bullish crossover last week, indicating bullish momentum and continuation of an upward trend.
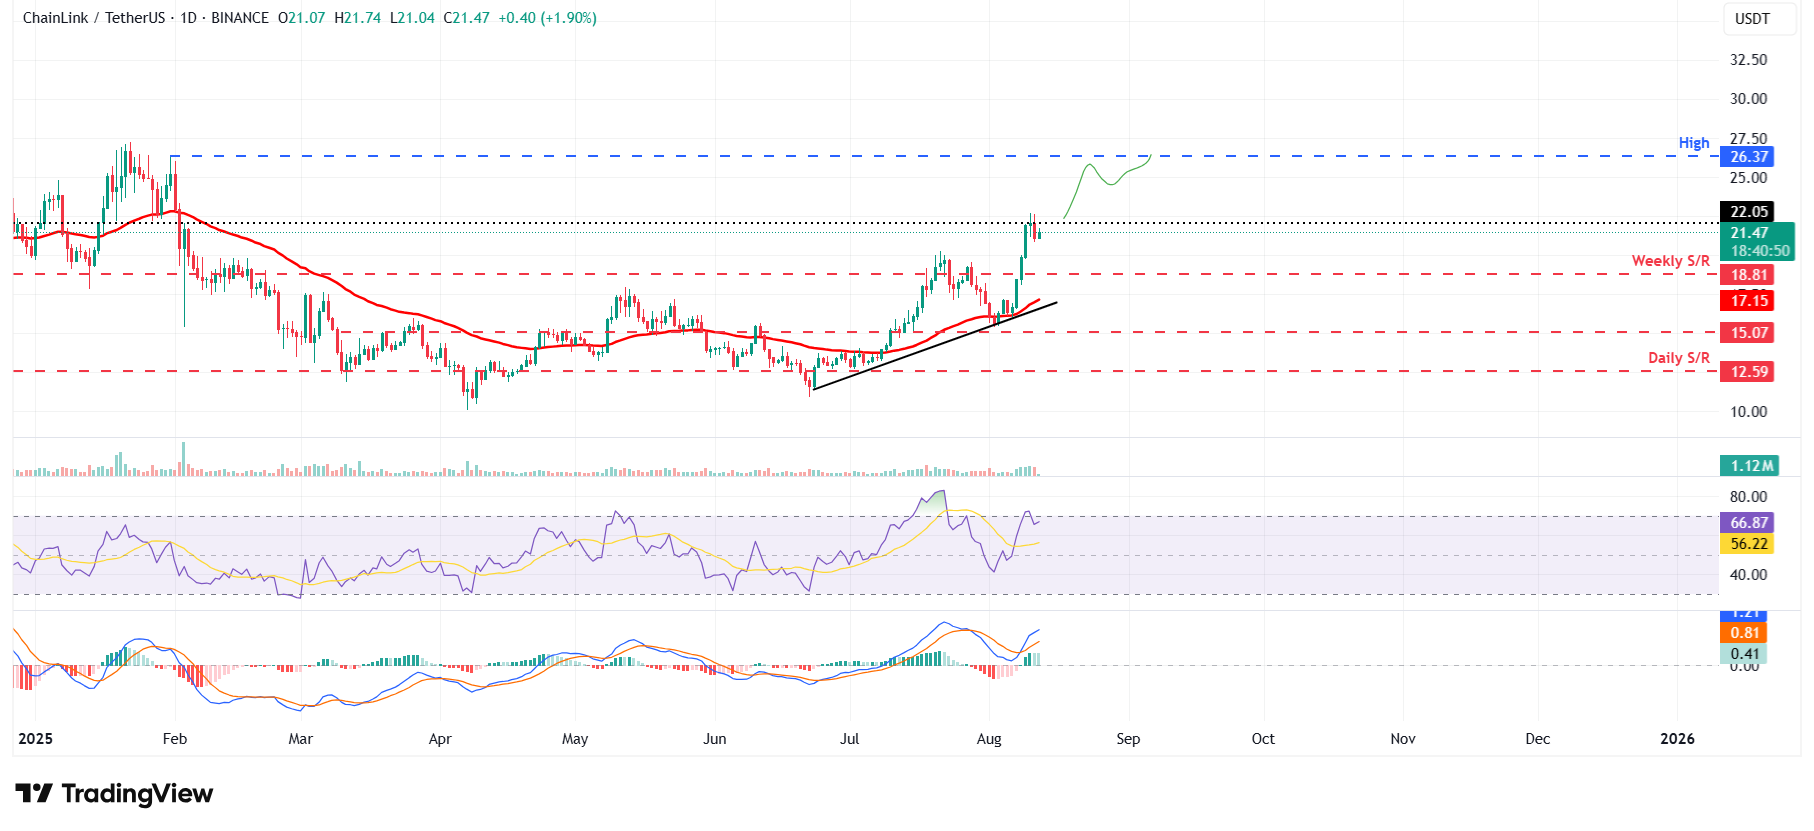
LINK/USDT daily chart
However, if LINK faces a pullback, it could extend the decline to find support around its weekly level at $18.81.
Bài viết đề xuất


