
Crypto Today: XRP holds key support, Bitcoin, Ethereum hit by rising spot ETF outflows
- Bitcoin faces a sticky risk-off sentiment as investors gauge the impact of higher tariffs and an uncertain economic outlook.
- Ethereum spot ETFs saw the largest daily outflow since their launch, of approximately $465 million on Monday.
- XRP bulls fight to keep the price above support at $3.00, but a SuperTrend sell signal shows that downside risk remains.
Cryptocurrency prices are on the edge on Tuesday, following a modest recovery on Monday, reflecting the shaky sentiment in the broader market due to sticky economic uncertainty. Bitcoin (BTC) is trading slightly below $115,000 at the time of writing, following a knee-jerk recovery from Monday's low of $113,725.
The fluctuations in the price of Bitcoin (BTC) have been mirrored by leading altcoins, including Ethereum (ETH), which struggles below the $3,700 short-term resistance. On the other hand, Ripple (XRP) holds above the $3.00 key support, buoyed by a steady derivatives market.
Market overview: Risk-off sentiment triggers spot ETF outflows
Investors are on the edge amid concerns over the impact of higher US tariffs expected to take effect this week in imported products from dozens of countries.
The uncertain economic outlook, coupled with the Federal Reserve’s (Fed) hawkish stance and steady interest rates, casts doubt on the risk-on sentiment needed to push the Bitcoin price above the $120,000 resistance, Ethereum to the $4,000 milestone, and XRP past its record high of $3.66.
Institutional investors are reducing exposure based on the increase in the volume of spot Exchange Traded Funds (ETFs) outflows. According to SoSoValue data, BTC spot ETFs listed in the US experienced approximately $333 million in outflows on Monday, marking three consecutive days of retreat.
“Last week marked the first net outflow from $BTC spot ETFs in over two months, interrupting a steady streak of inflows. While modest in size, it reflects a cautious tone as price stalls below $120K,” Glassnode highlighted in an X post.
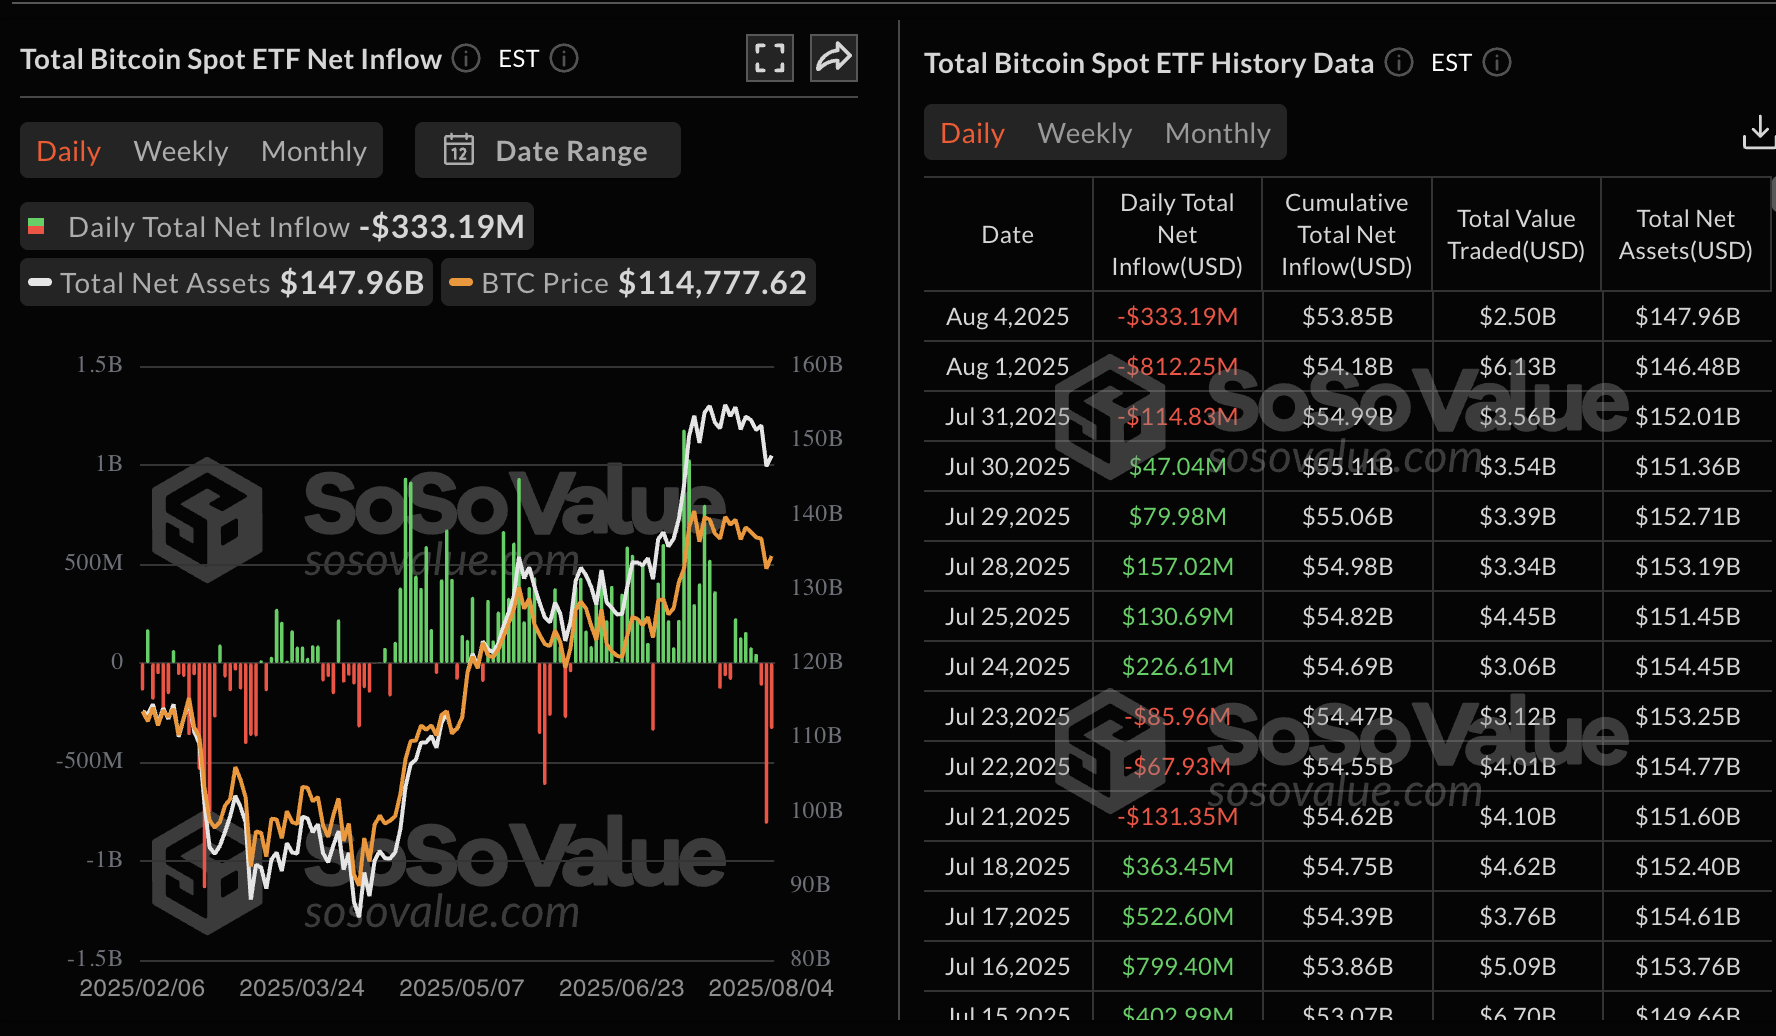
Bitcoin spot ETF stats | Source: SoSoValue
The risk-off sentiment was more evident with Ethereum, as spot ETFs recorded the largest outflow in history, worth around $465 million on Monday. This marks the second day of outflows after Ethereum broke a bullish streak maintained since July 3.
In total, ETH spot ETFs boast approximately $9 billion in net inflow volume, with the total net assets averaging $20.5 billion. BlackRock’s ETHA is the largest ETF with $10.7 billion in net assets, followed by Grayscale’s ETHE with $4.1 billion and Fidelity’s FETH with $2.44 billion.
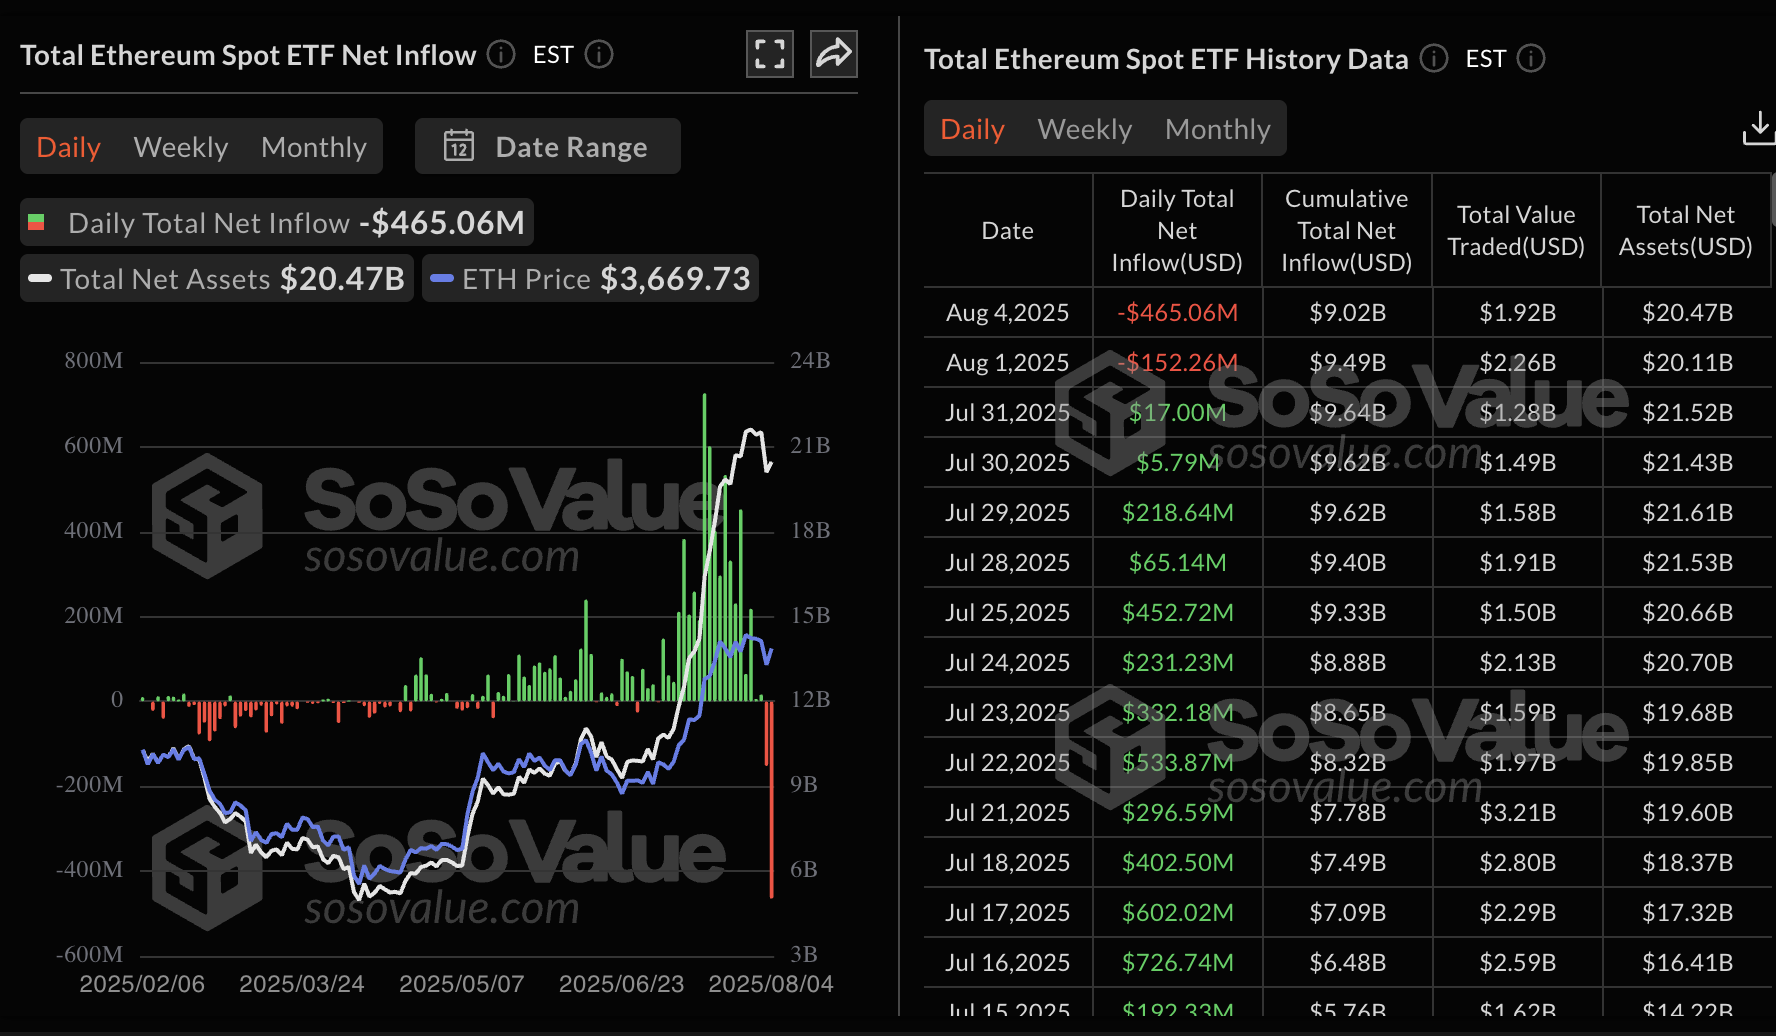
Ethereum spot ETF stats | Source: SoSoValue
The next few days could provide insight into the direction Bitcoin, Ethereum and XRP prices take. Investors could uphold the cautious approach due to macroeconomic uncertainty, especially with higher tariffs taking effect this week.
Other key events that could shape the crypto market are the US ISM services PMI, an index used to gauge the overall economic condition for the non-manufacturing sector on Tuesday, and the US Jobless Claims release on Thursday.
Chart of the day: Bitcoin struggles below $115,000
Bitcoin price is trading slightly below the stubborn $115,000 resistance, reflecting the shaky sentiment in the broader cryptocurrency market. The Relative Strength Index (RSI), which is edging slightly below the midline, underpins the suppressed buying pressure.
If the RSI’s general downtrend persists, Bitcoin could drop to collect liquidity at lower levels, such as the 50-day Exponential Moving Average (EMA), providing support at around $113,058, and the previous record high at approximately $112,000.
Still, a daily close above the $115,000 level could make BTC more attractive to long position traders who will likely bet on the price rising toward $120,000.
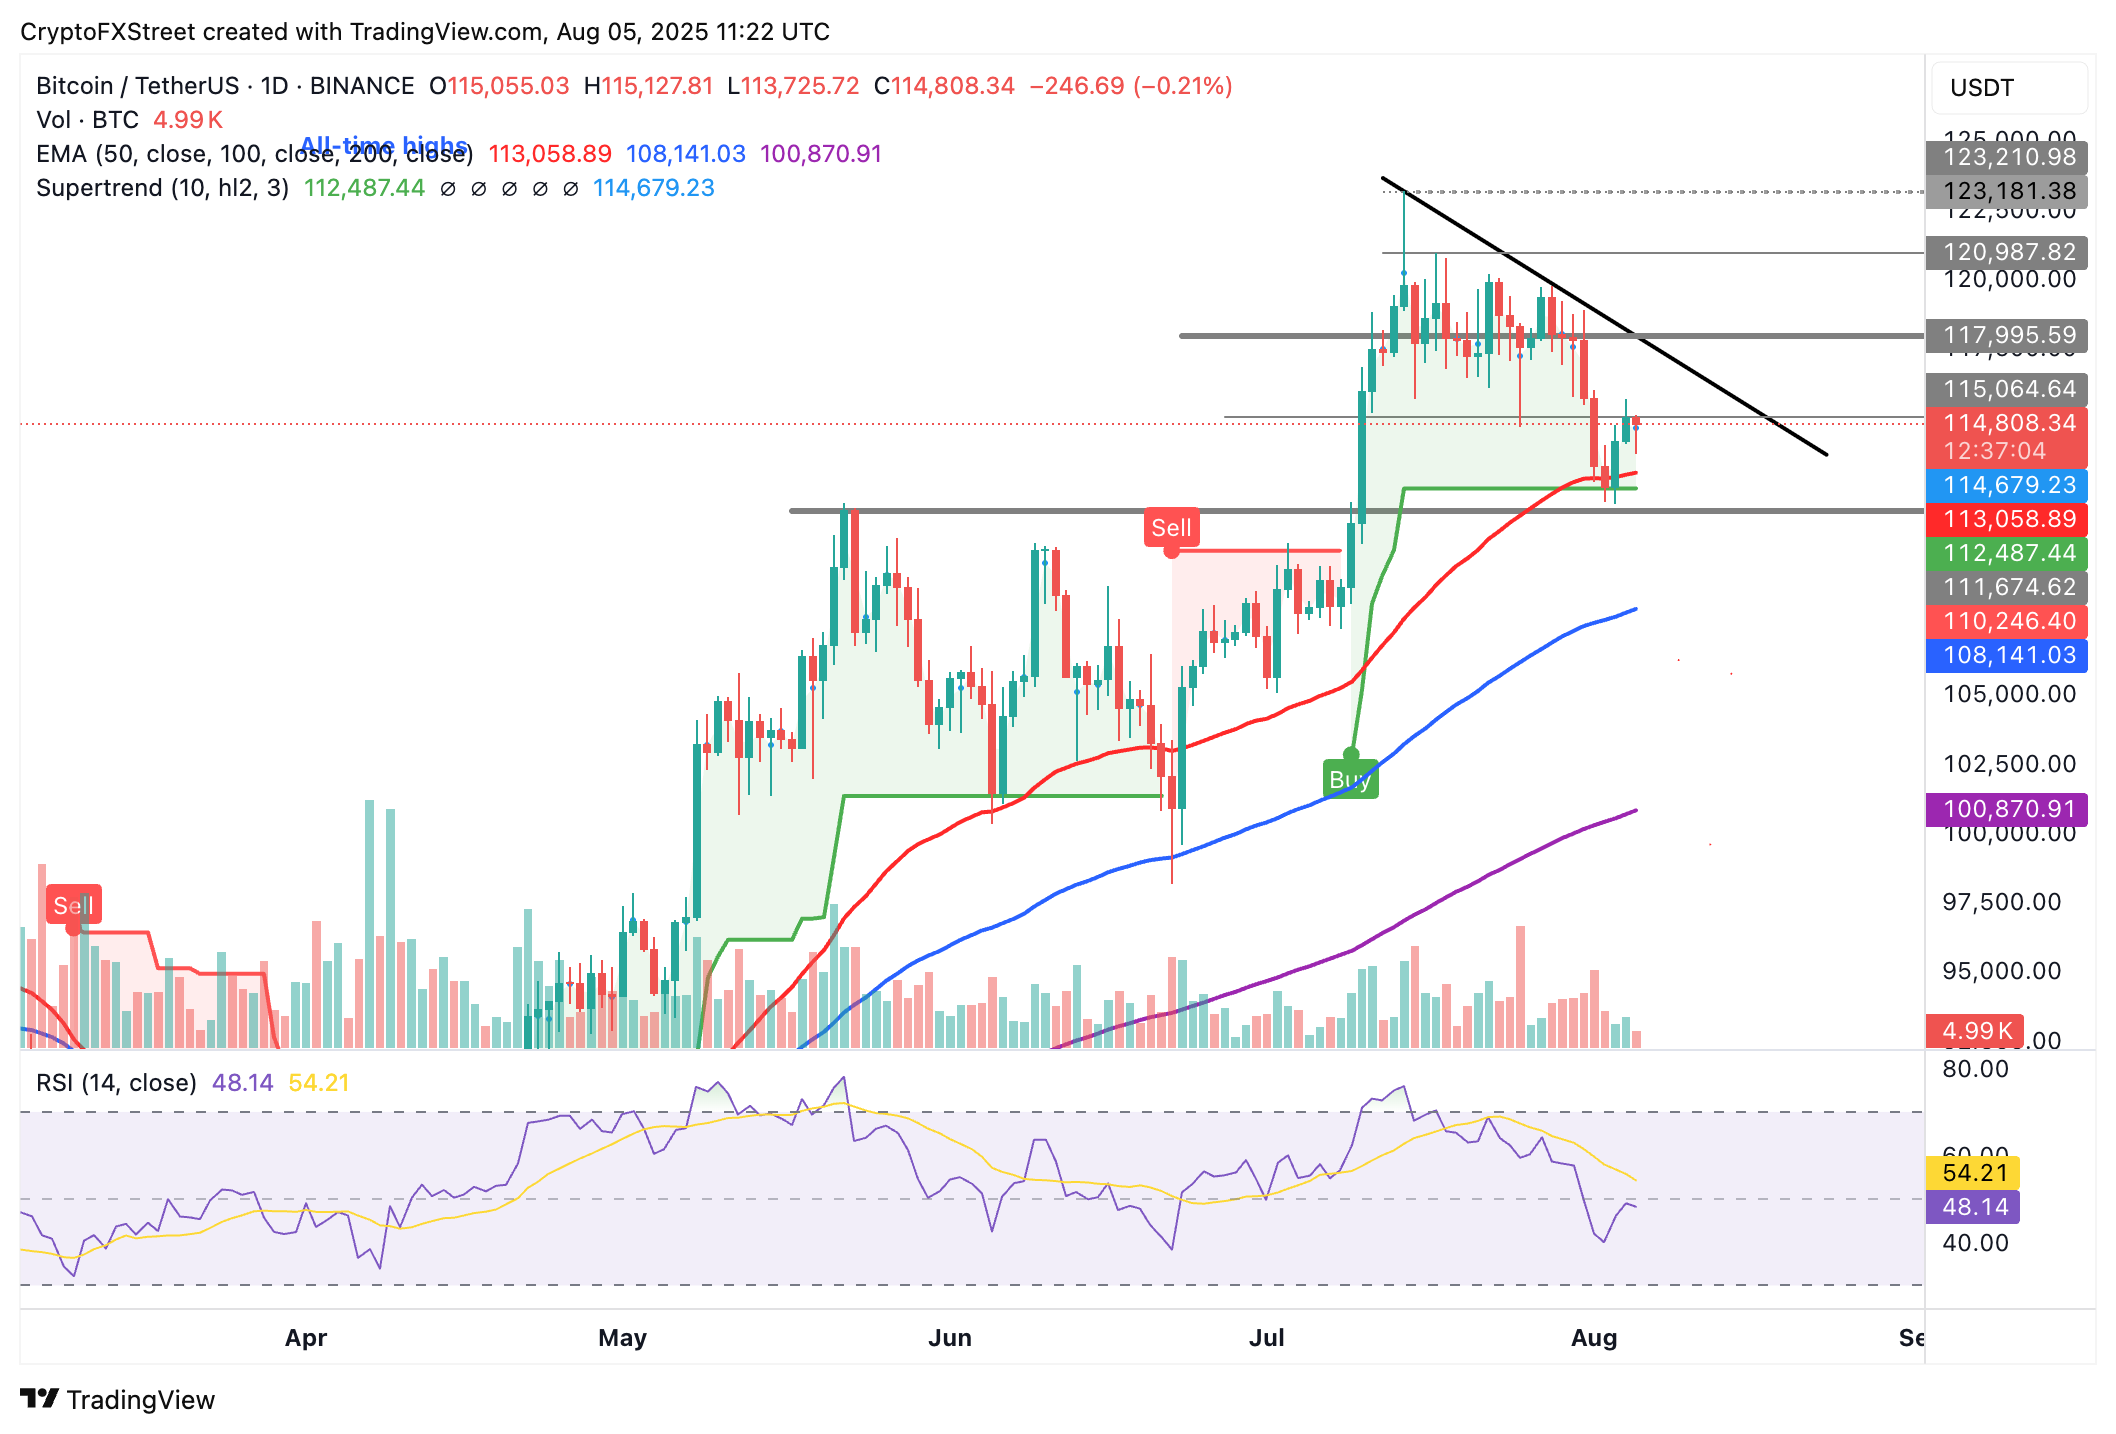
BTC/USDT daily chart
Altcoins update: Ethereum battles risk-off sentiment, XRP holds key support
Ethereum price is struggling to uphold its recovery slightly below $3,700 resistance, primarily held back by the sticky risk-off sentiment as traders remain cautious due to macroeconomic uncertainty.
The Moving Average Convergence Divergence (MACD) indicator maintains a sell signal triggered on July 30, when the blue MACD line crossed below the red signal line.
Traders will likely continue to de-risk as long as the MACD indicator slopes toward the mean line. The red histogram bars growing below the same mean line indicate bearish momentum building.
However, Ethereum also sits above strong support levels provided by the 50-day EMA at $3,195, the 100-day EMA at $2,882 and the 200-day EMA at $2,725. Bulls still have their eyes on the $4,000 milestone, which could boost the wobbling uptrend and pave the way for risk-on sentiment.
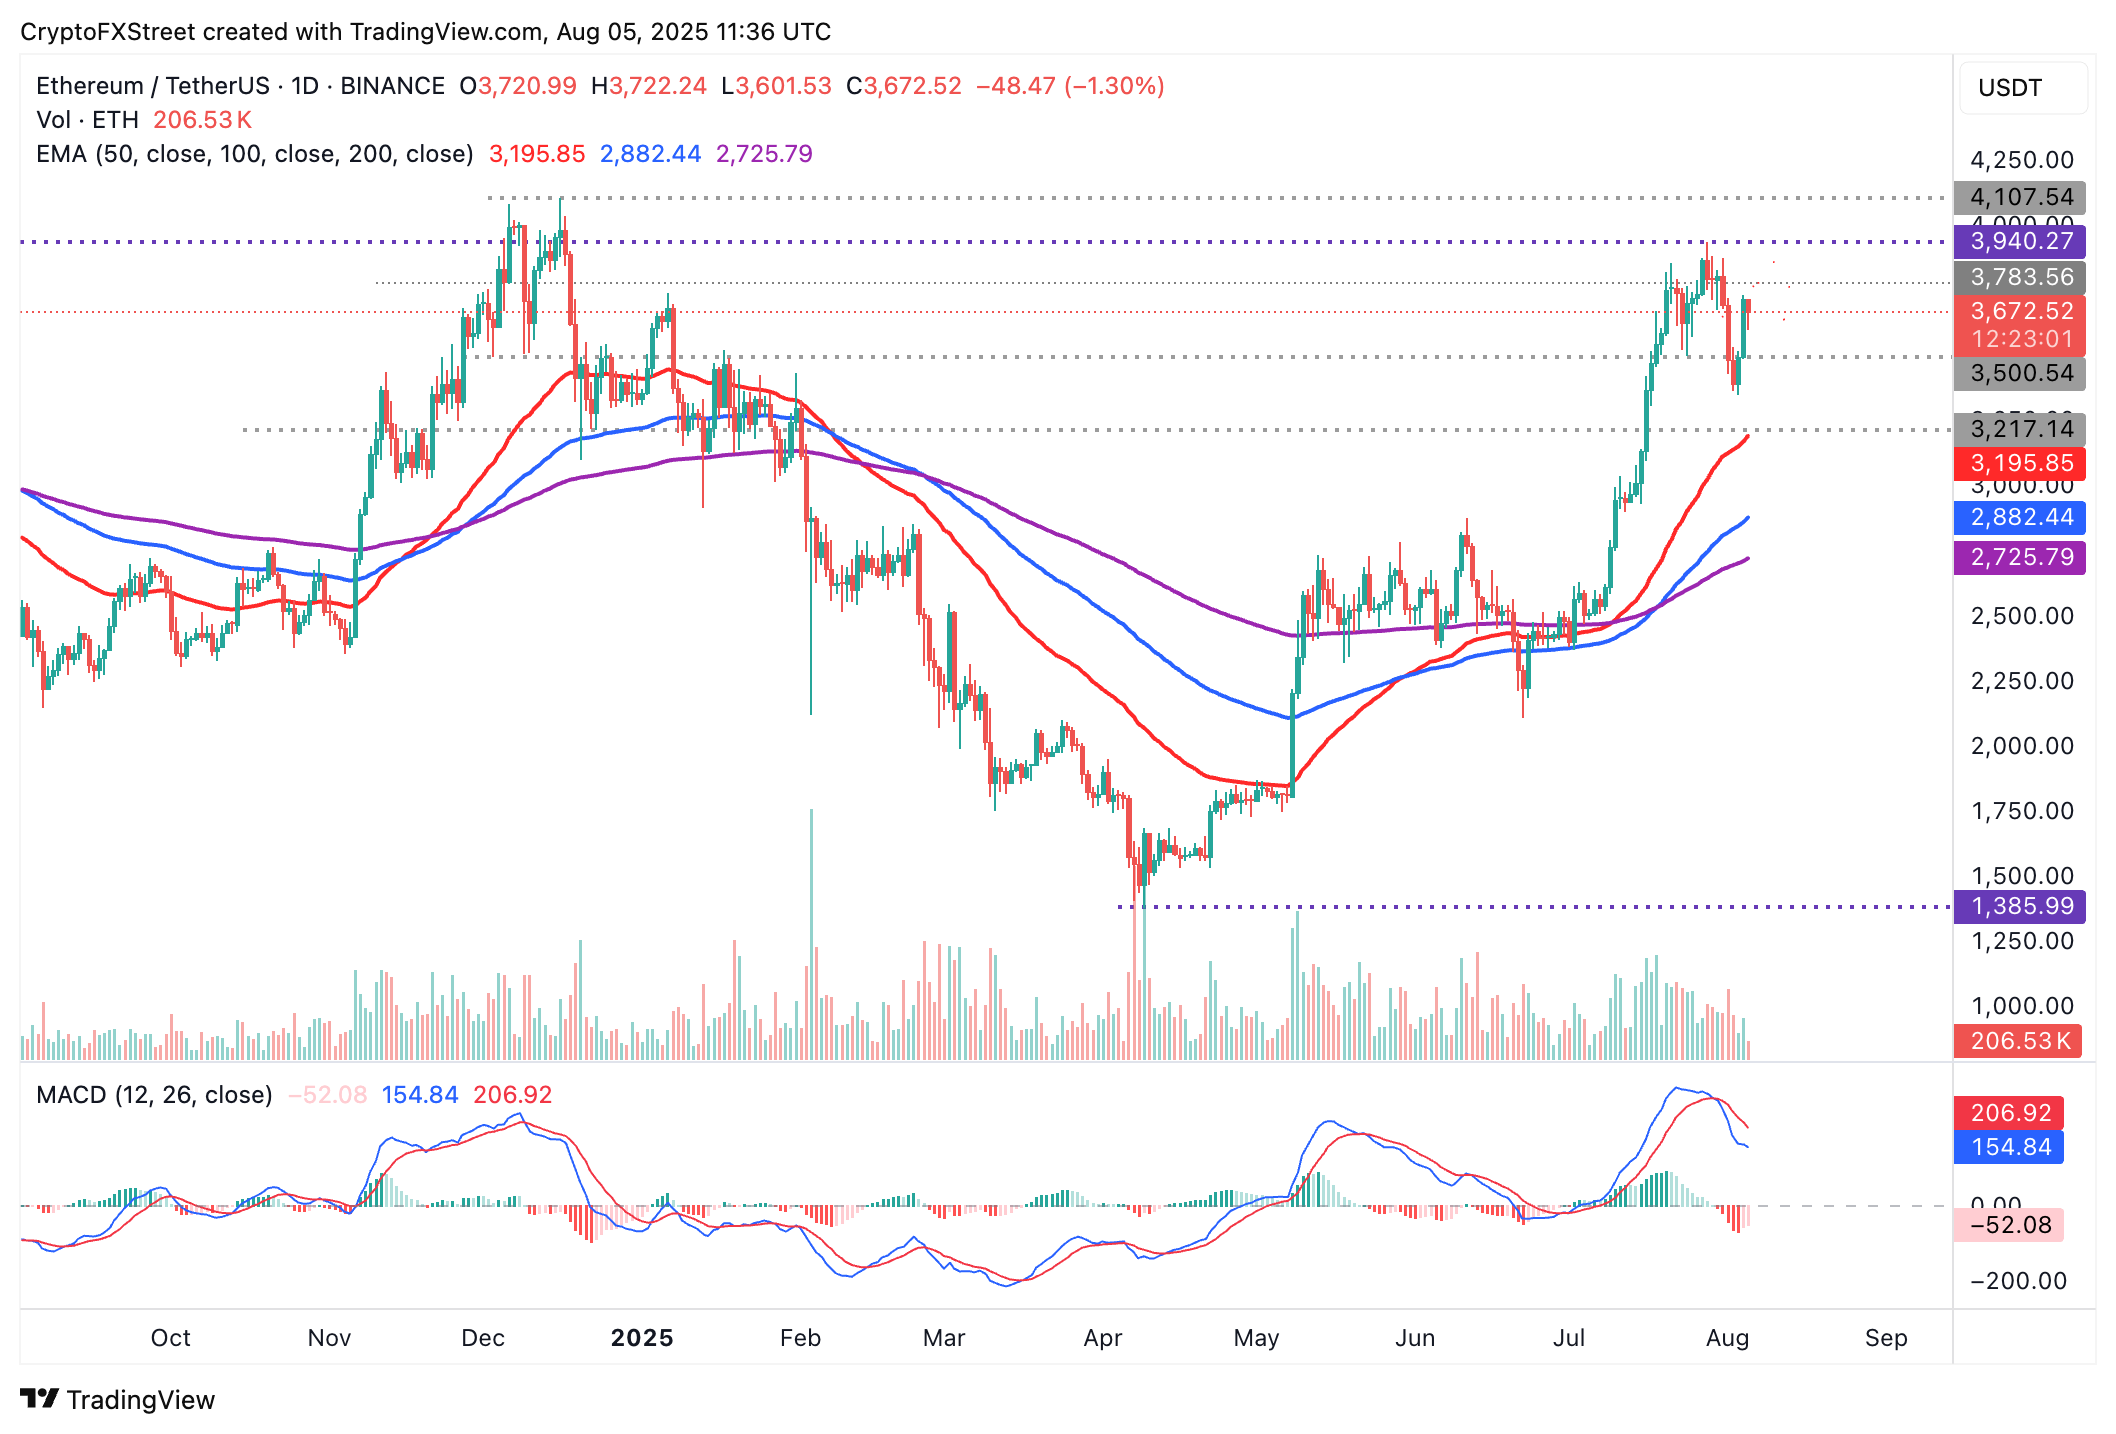
ETH/USDT daily chart
As for XRP, bulls have managed to uphold support at $3.00 since Monday, increasing the probability of the recovery extending toward the short-term resistance at $3.30 and, later, to the record high of $3.66 reached on July 18.
However, a sell signal from the MACD indicator suggests that bearish pressure is apparent and cannot be shrugged off. Investors may reduce exposure as long as the blue MACD line remains below the red signal line while the red histogram bars extend below the mean line.
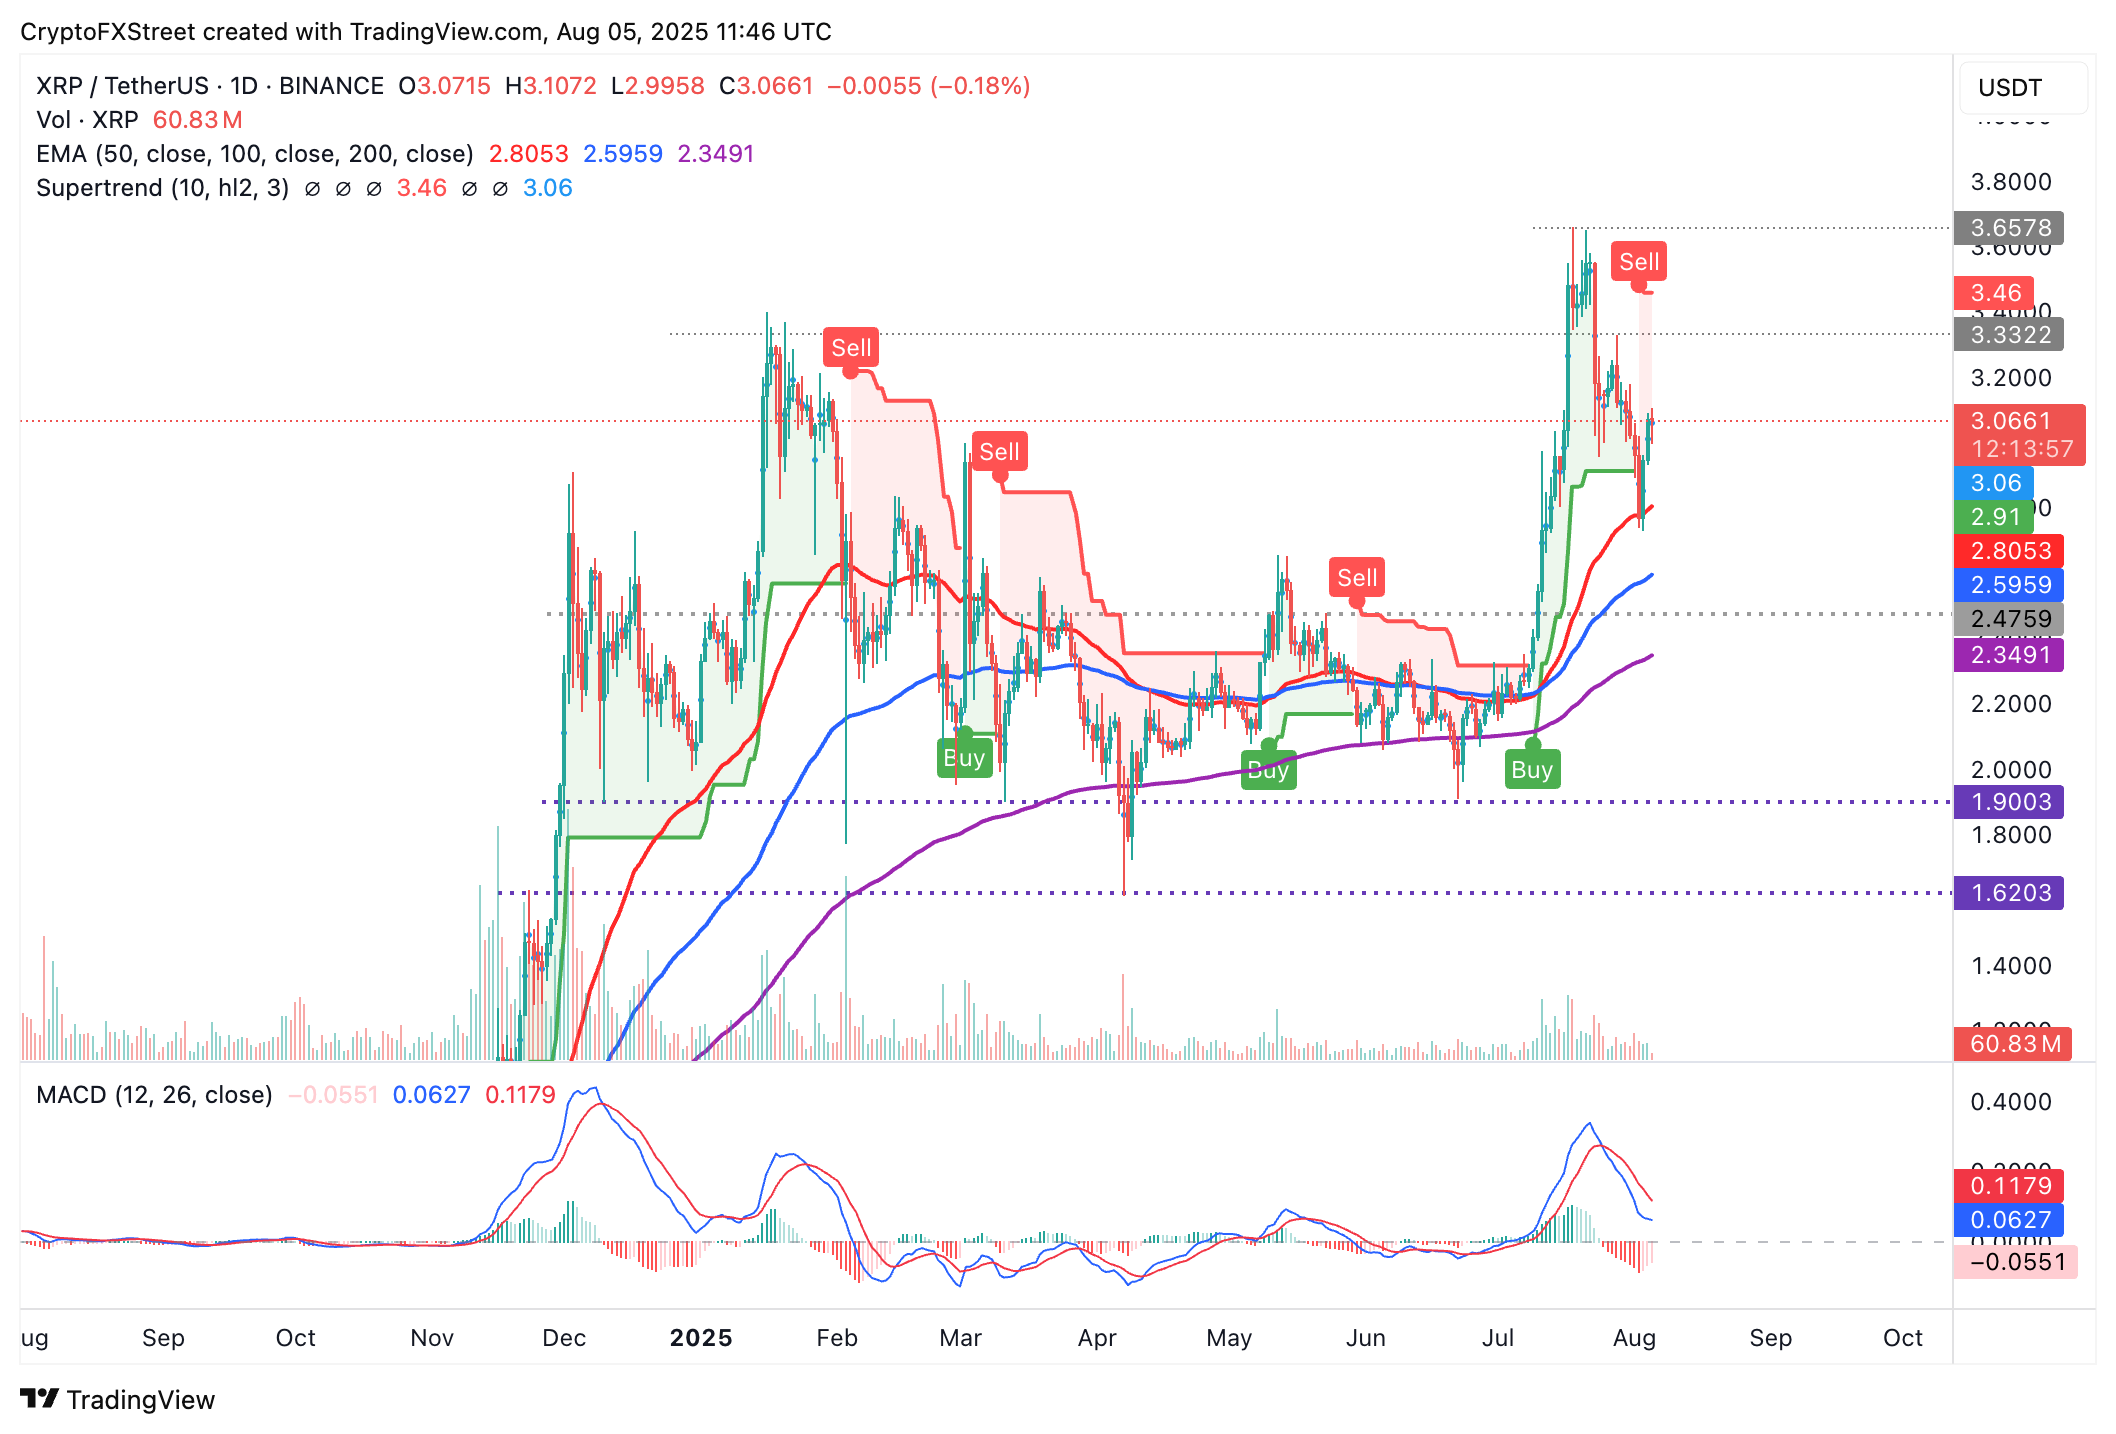
XRP/USDT daily chart
At the same time, the SuperTrend indicator recently flipped above the price of XRP, triggering a sell signal. Suppose bulls lose support at $3.00 and the SuperTrend indicator line holds above the price. In that case, the path of least resistance will stay downward, increasing the chances of XRP sliding toward support provided by the 50-day EMA at $2.80 and the 100-day EMA at $2.59.
Cryptocurrency prices FAQs
Token launches influence demand and adoption among market participants. Listings on crypto exchanges deepen the liquidity for an asset and add new participants to an asset’s network. This is typically bullish for a digital asset.
A hack is an event in which an attacker captures a large volume of the asset from a DeFi bridge or hot wallet of an exchange or any other crypto platform via exploits, bugs or other methods. The exploiter then transfers these tokens out of the exchange platforms to ultimately sell or swap the assets for other cryptocurrencies or stablecoins. Such events often involve an en masse panic triggering a sell-off in the affected assets.
Macroeconomic events like the US Federal Reserve’s decision on interest rates influence crypto assets mainly through the direct impact they have on the US Dollar. An increase in interest rate typically negatively influences Bitcoin and altcoin prices, and vice versa. If the US Dollar index declines, risk assets and associated leverage for trading gets cheaper, in turn driving crypto prices higher.
Halvings are typically considered bullish events as they slash the block reward in half for miners, constricting the supply of the asset. At consistent demand if the supply reduces, the asset’s price climbs.
Bài viết đề xuất


