
Top Crypto Gainers: CFX jumps 100% ahead of Mainnet release, ENA and DOGE record double-digit gains
- Conflux advances from the 100% surge on Sunday, reclaiming the $0.20 level.
- Ethena edges higher to hit $0.50, extending the 13% gains from Sunday.
- Dogecoin takes a breather following the 13% surge on Sunday, with bulls targeting $0.30.
Conflux (CFX) recorded a rise of over 100% on Sunday, outpacing the broader market recovery over the last 24 hours. CFX rose amid the ongoing Conflux Technology and Ecosystem Conference, ahead of the release of the “Conflux 3.0 Architecture.”
Dogecoin (DOGE) and Ethena (ENA) hold onto the double-digit gains on Sunday, securing the silver and bronze ranks as top performers in the last 24 hours.
Conflux’s triple-digit rise eyes further gains
CFX ticks higher by 1% at press time on Monday, following the 107% surge from Sunday. The bullish run could be on the back of Dr. Guang Yang, CTO of Conflux, highlighting the Conflux 3.0 Architecture in the Conflux Technology & Ecosystem Conference on Saturday.
The uptrend exceeds the 50% retracement level at $0.1847, which is drawn from the $0.5500 peak on March 24, 2024, to the $0.0620 low on April 17, 2025. CFX bulls target a daily close above the 61.8% Fibonacci level at $0.2390 to extend the uptrend. Sidelined investors could watch for a decisive push above $0.2390, targeting the 78.6% Fibonacci level at $0.3448.
The Moving Average Convergence/Divergence (MACD) and its signal line display an uptrend as the green histogram bars rise from the zero line, suggesting increased bullish momentum.
The Relative Strength Index (RSI) reads 93 on the daily chart, indicating extreme buying pressure and potentially overbought conditions.
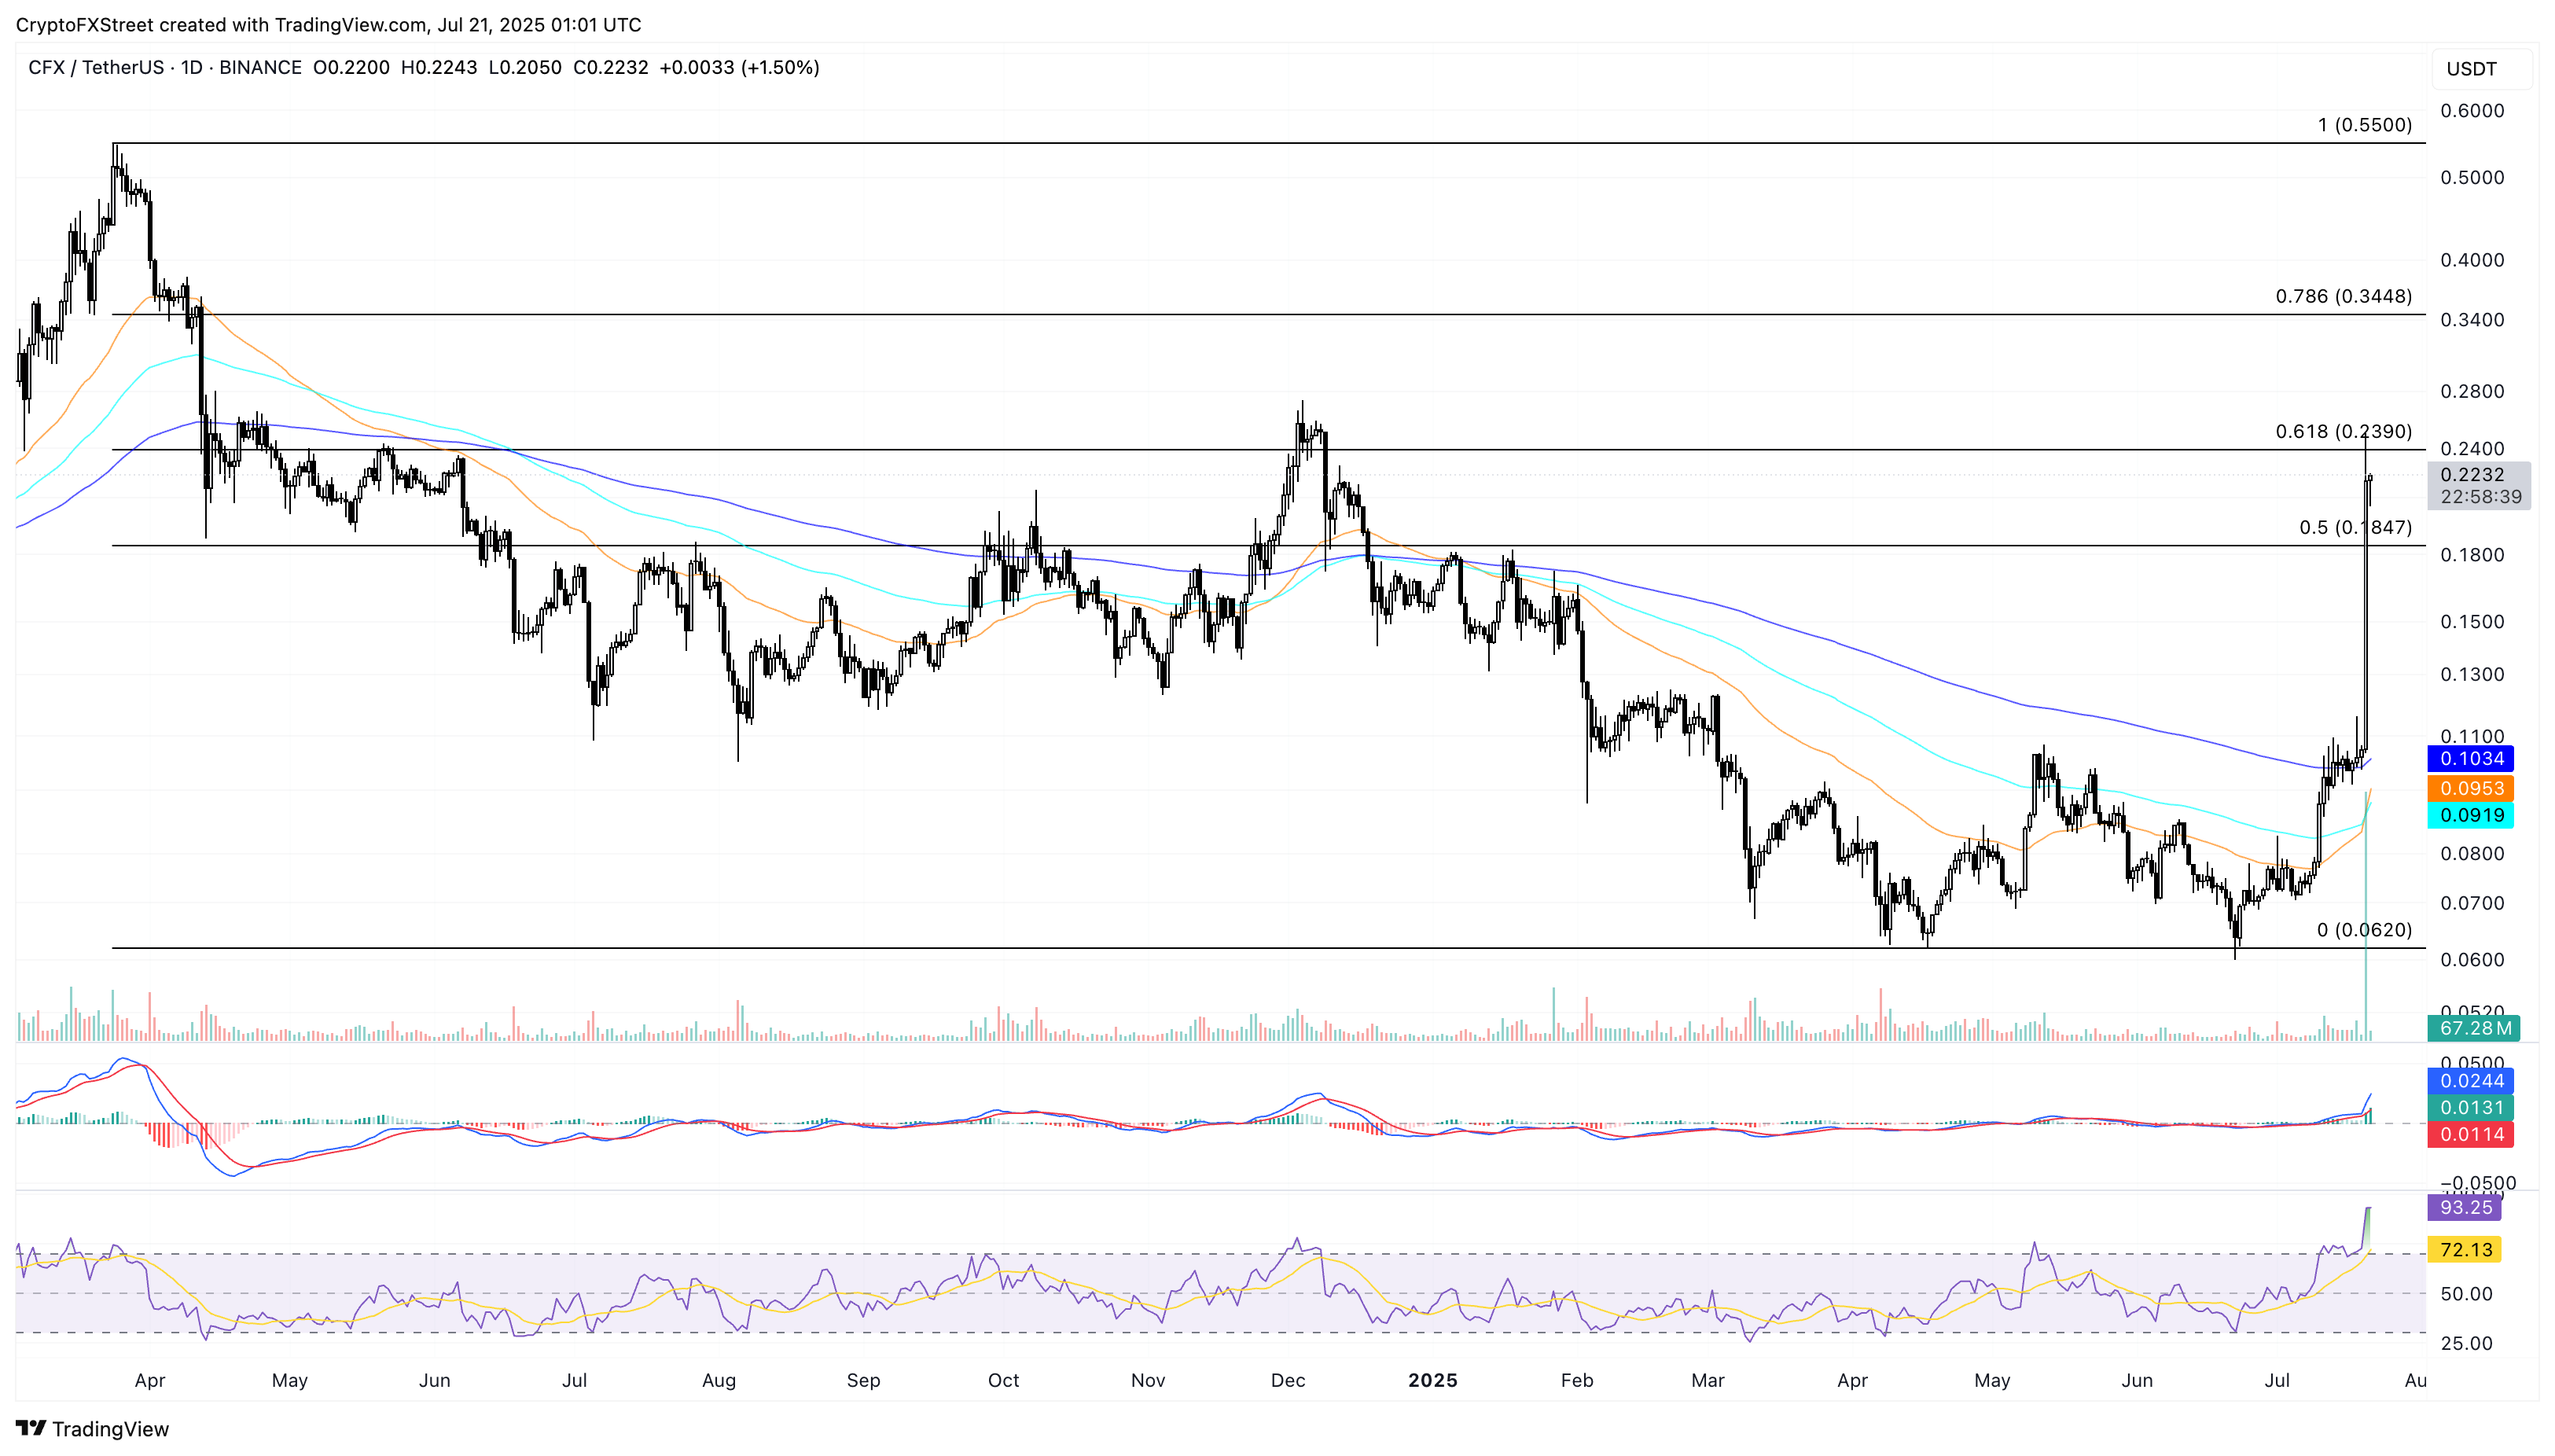
CFX/USDT daily price chart.
A reversal from the 61.8% Fibonacci level at $0.2390 could retest the 50% Fibonacci level at $0.1847.
Ethena’s uptrend crosses $0.50, bulls target $0.6576
Ethena edges higher by over 2% at press time on Monday, marking its seventh successive bullish candle on the daily chart. The uptrend targets the $0.5446 level marked by the low of February 2 as it reclaims the $0.50 psychological level for the first time since February 19.
A decisive close above this level could stretch the bullish run to $0.6576, marked by the January 28 close.
The MACD indicator displays successively rising green histogram bars, suggesting an increasing trend momentum. Meanwhile, the uptrend in the MACD and its signal line indicates a bullish trend in motion.
The RSI reads 82, with a sideways shift in the overbought conditions. Sidelined investors must remain cautious as sudden reversals are possible at overbought levels.
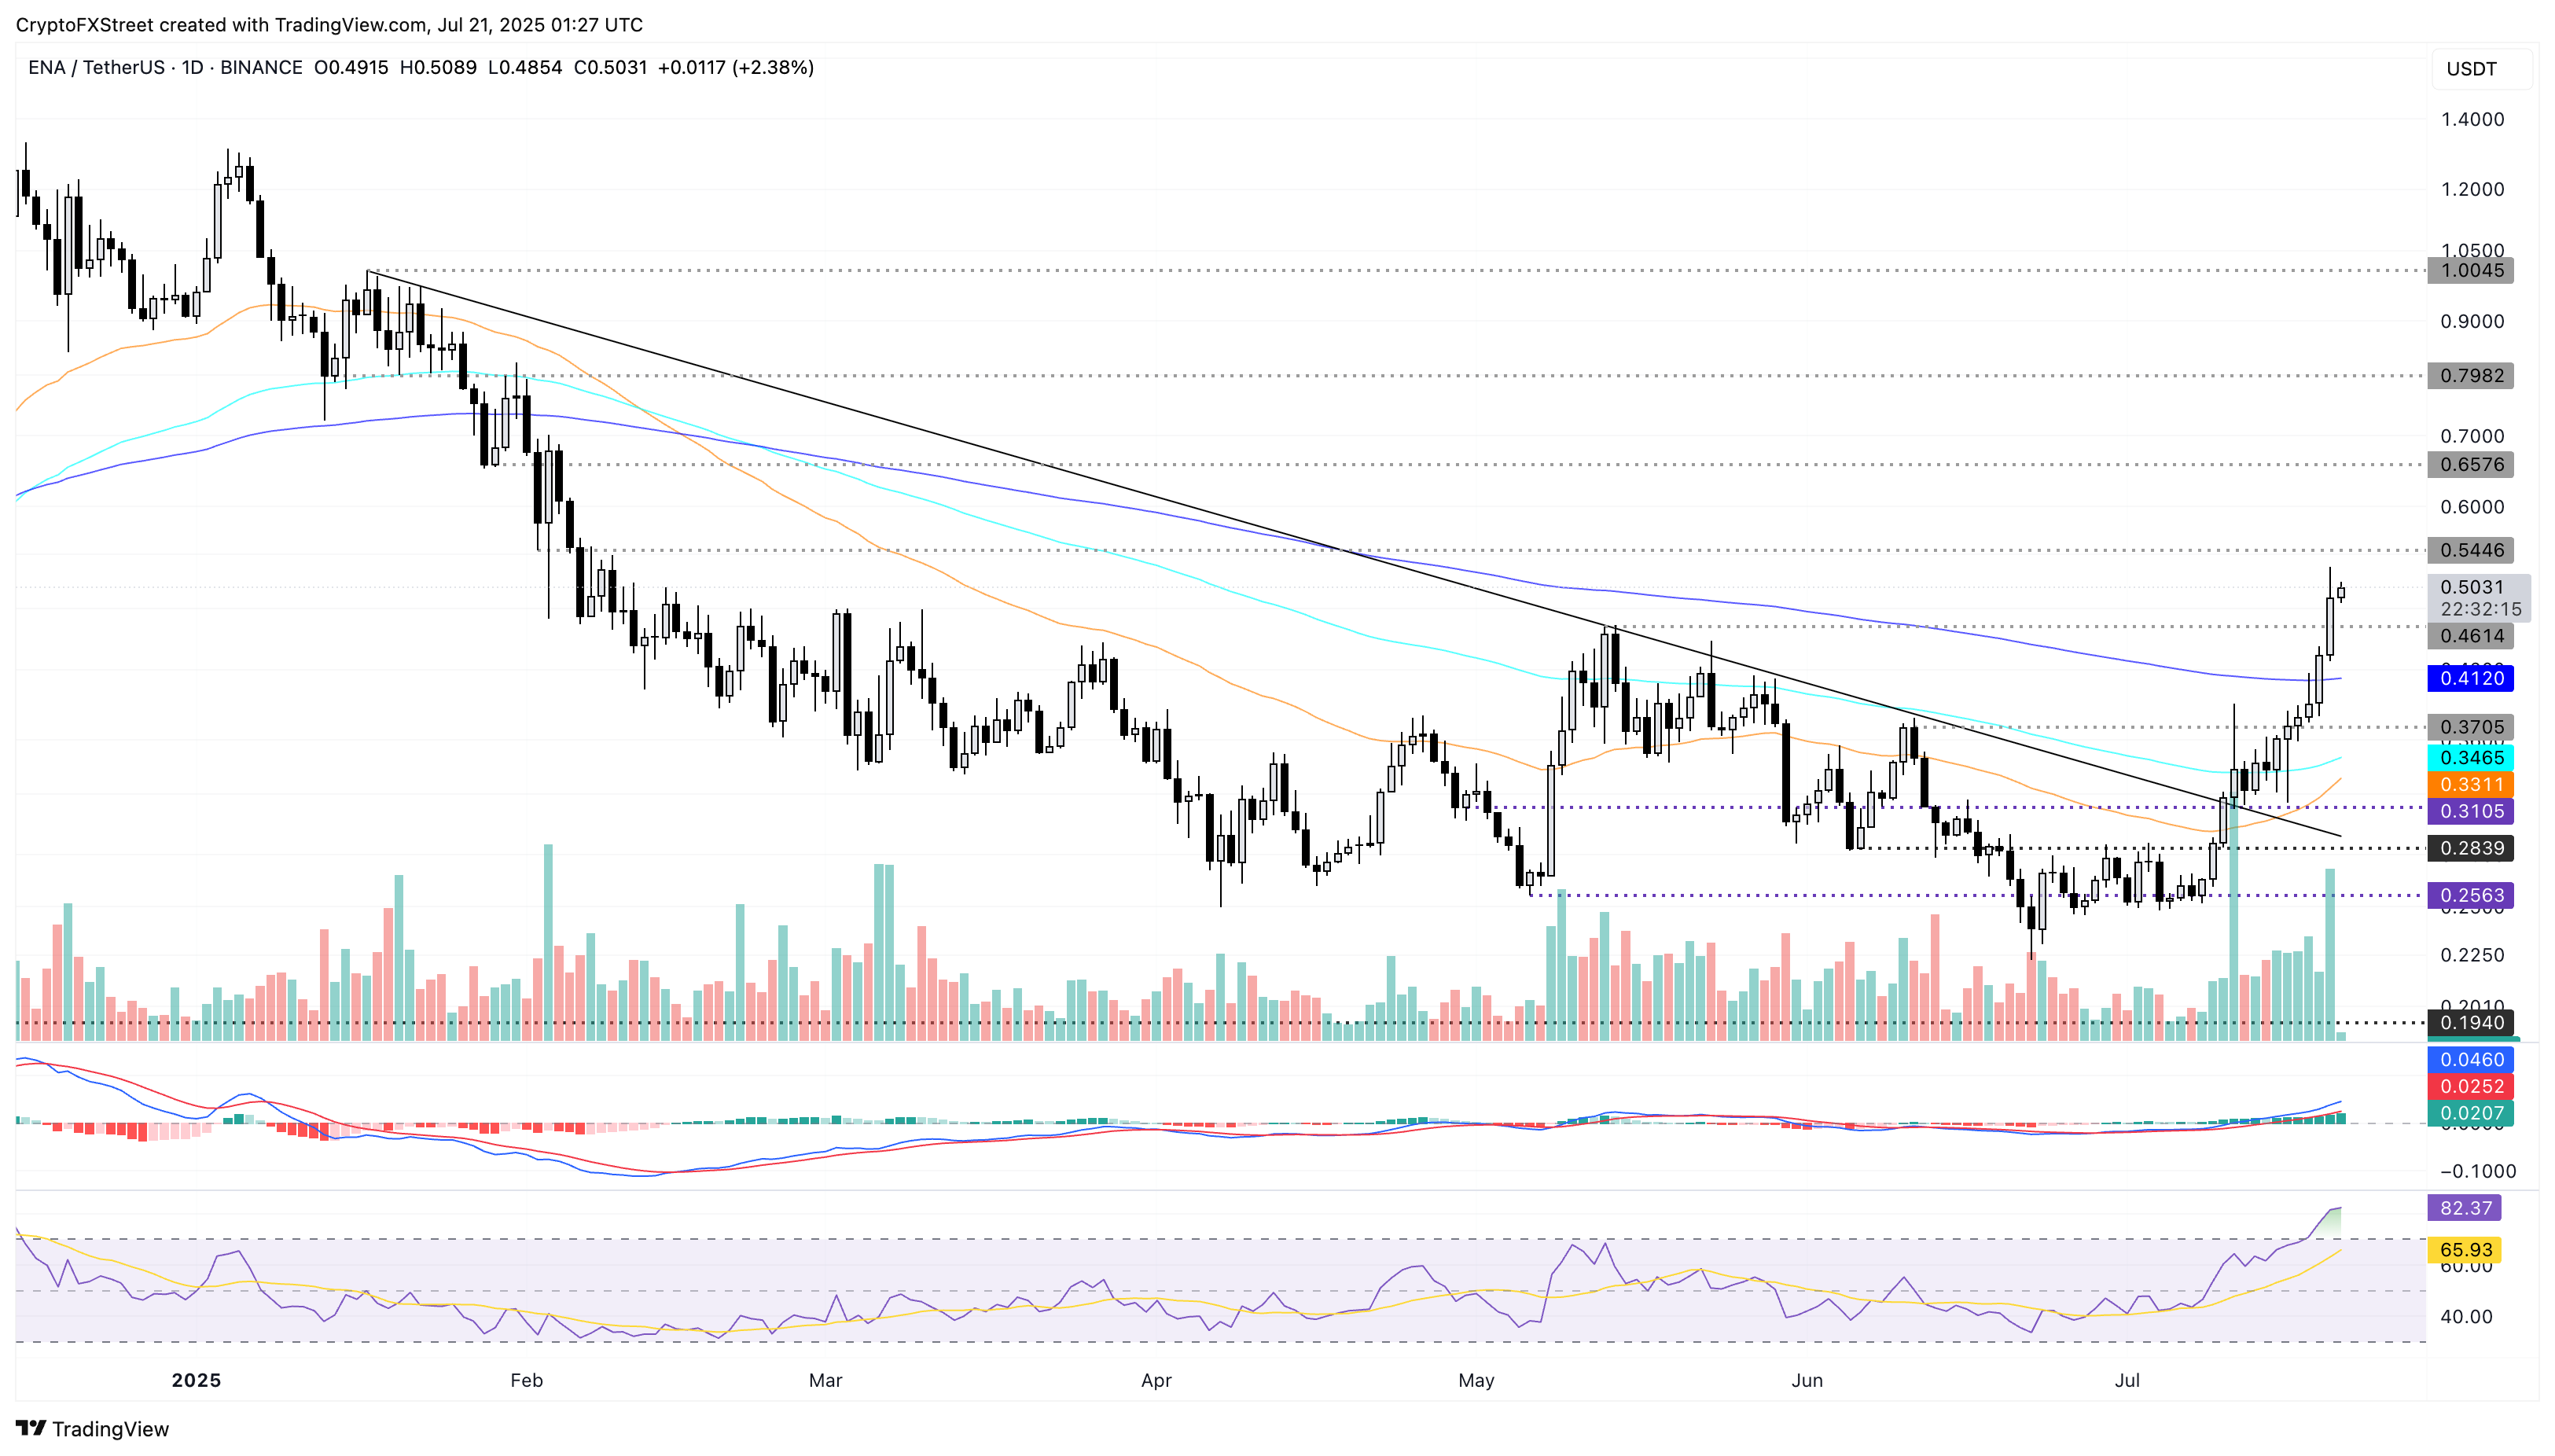
ENA/USDT daily price chart.
On the flipside, a reversal in Ethena below $0.4614 level could test the 200-day Exponential Moving Average (EMA) at $0.4120.
Dogecoin at crossroads as RSI signals overbought conditions
DOGE ticks lower by nearly 2% so far on Monday following six consecutive bullish candles. Dogecoin’s 13% jump from Sunday exceeded the $0.2597, with bulls targeting the $0.2867 peak from February 14.
A clean push above this level with a daily close could extend the uptrend to $0.3143, last tested on January 21.
The MACD and its signal line display an upward trend, accompanied by the rising green histogram bars, which suggest increased bullish momentum. The RSI on the daily chart reads 81, indicating overbought conditions for Dogecoin.
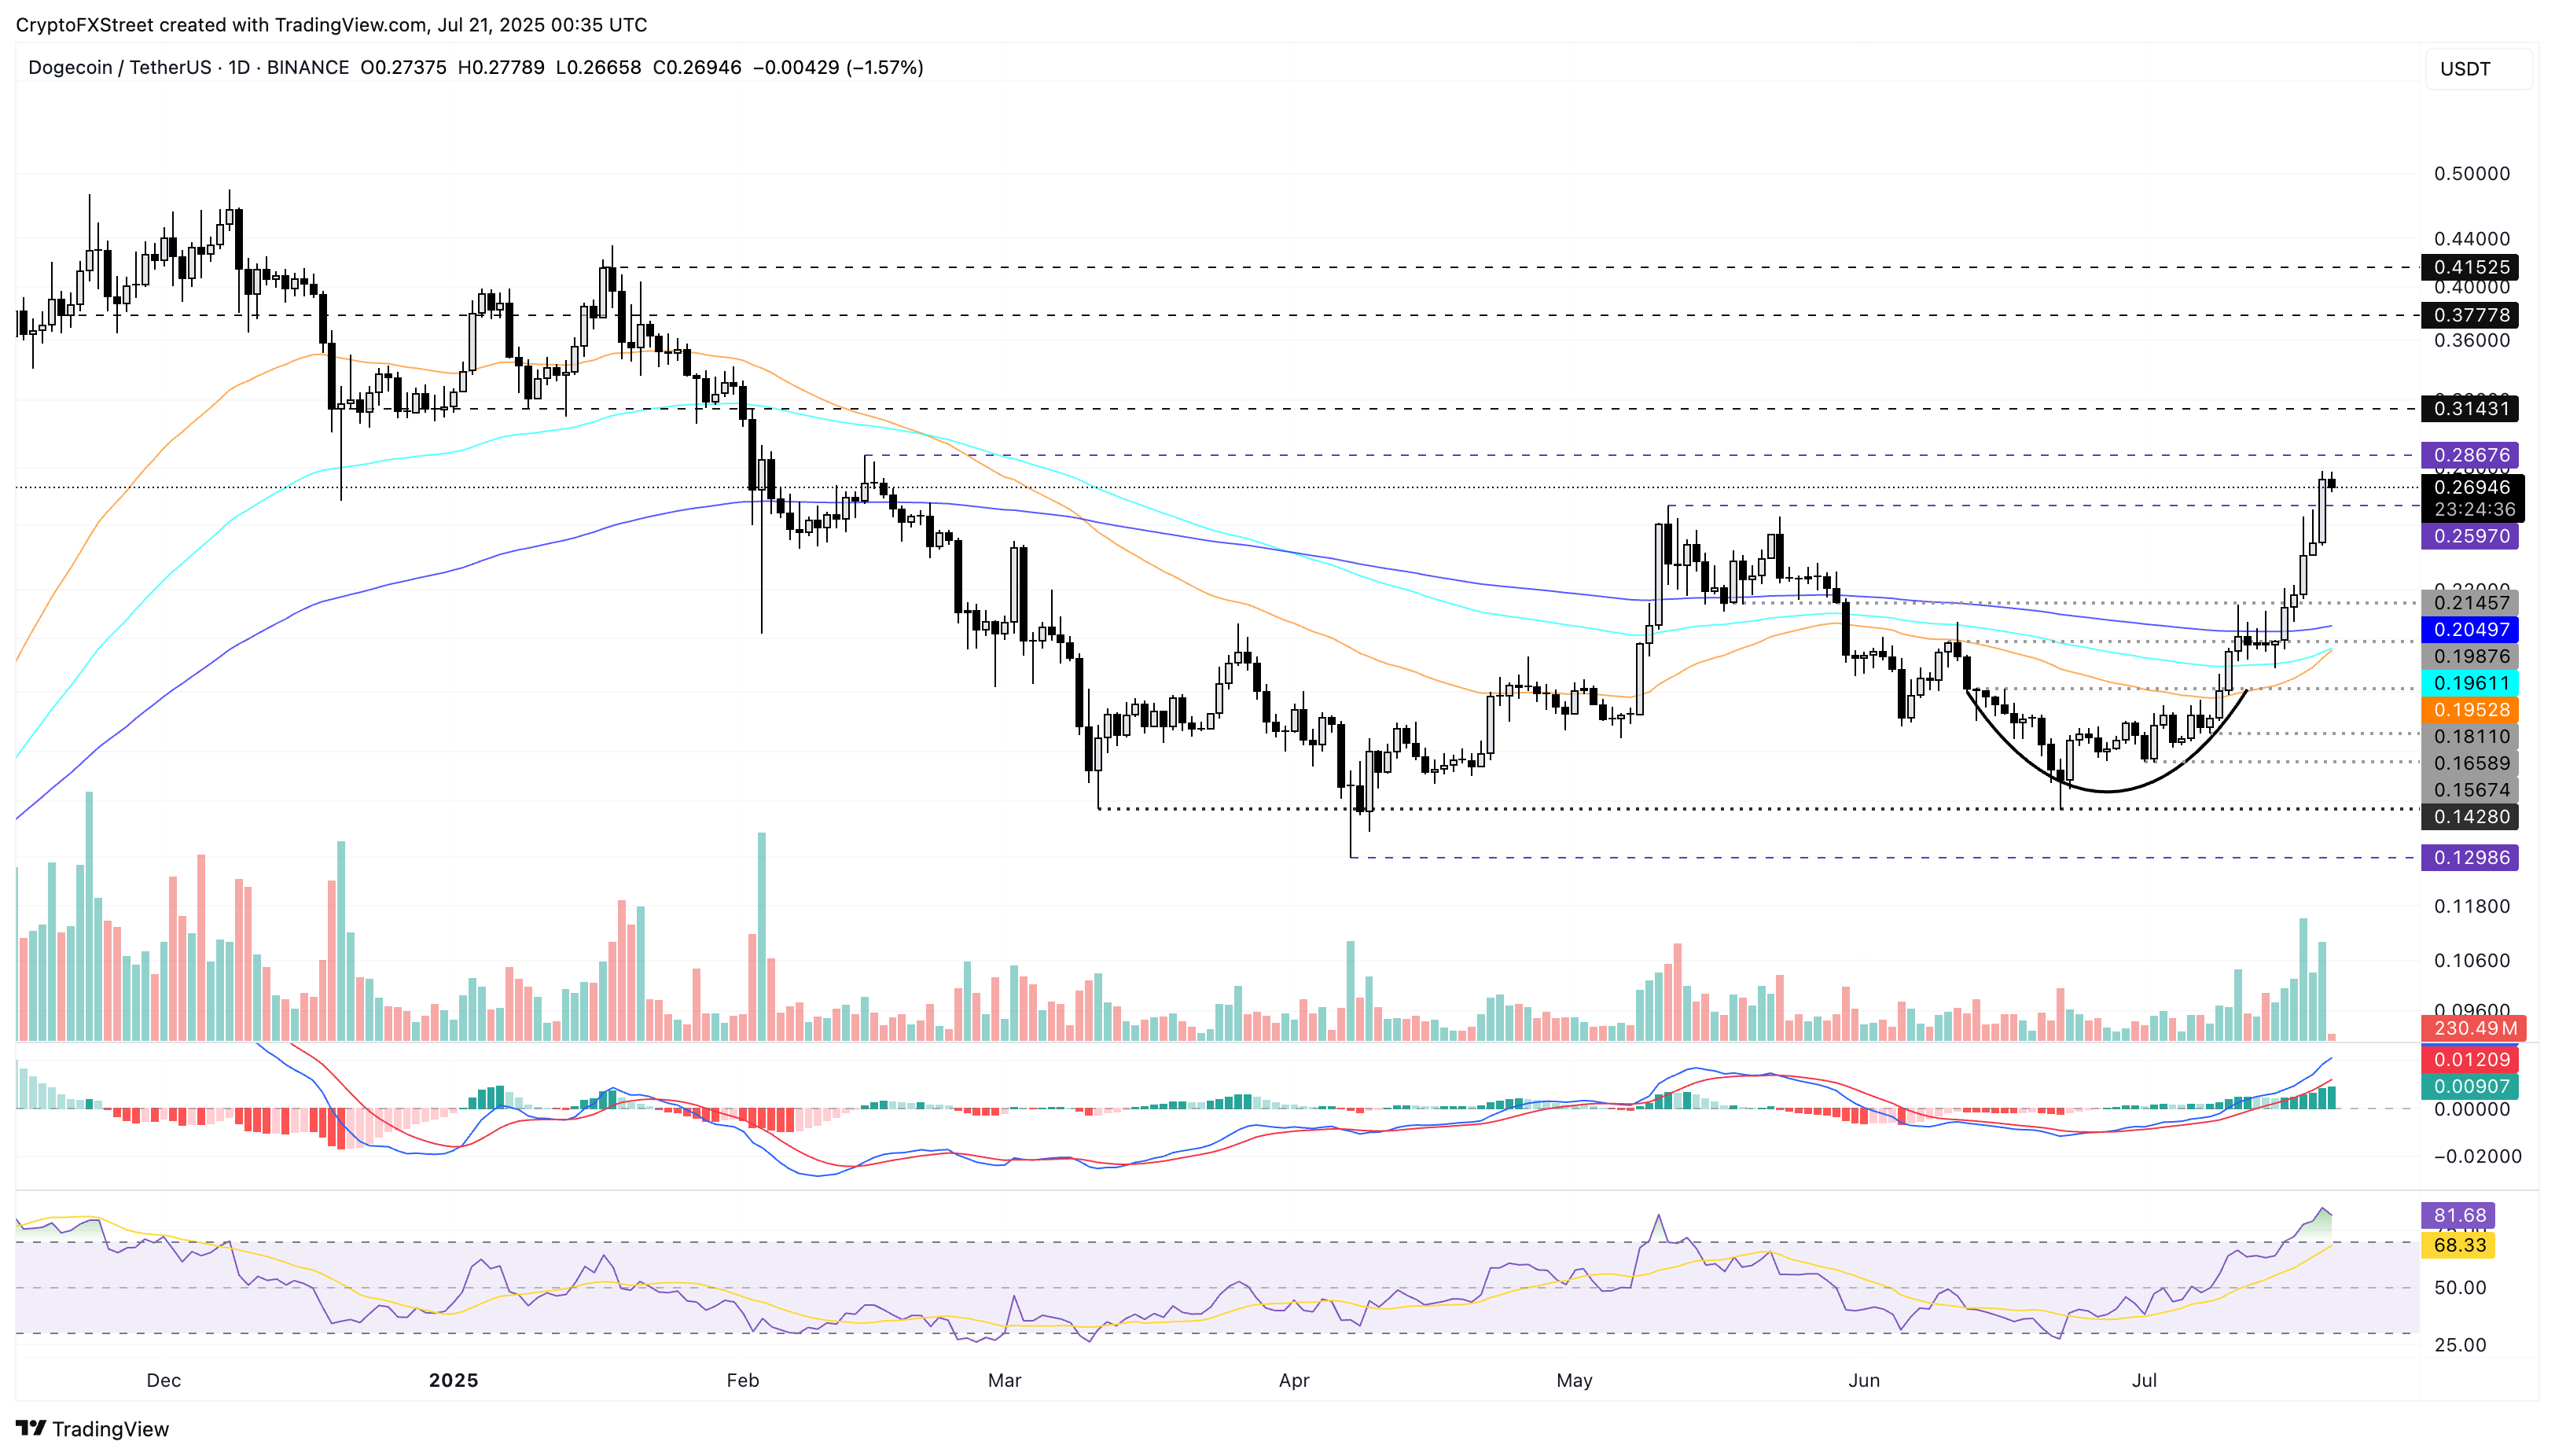
DOGE/USDT daily price chart.
On the downside, a reversal below the $0.2597 level could result in the retest of the $0.2145 level marked by the May 17 daily close.
Bài viết đề xuất


