
Litecoin Price Forecast: LTC signals bullish move as large wallets accumulate tokens
- Litecoin price closes above its weekly resistance at $96.30, signaling a potential bullish move on the horizon.
- Santiment data shows that large wallets are accumulating LTC tokens.
- Derivatives data and the technical outlook suggest rally continuation, targeting the $107.5 mark.
Litecoin (LTC) price trades slightly above $98 at the time of writing on Thursday, posting gains for a fifth consecutive session, after closing above its key resistance level the previous day. On-chain data suggests the continuation of the rally is likely as larger wallets accumulate LTC tokens, signaling growing confidence among traders. Derivatives and technical outlook support this bullish thesis, with LTC bulls aiming for $107.5 mark.
Litecoin’s large wallets accumulate as smaller holders exit positions
Santiment’s Supply Distribution data supports a bullish outlook for Litecoin, as the number of large-wallet holders (whales) is increasing.
The metric indicates that whales holding between 1 million and 10 million LTC tokens (yellow line) have accumulated 360,000 tokens from June 5 to Thursday. During the same period, wallets holding between 100,000 and 1 million LTC tokens (red line) have shed 140,000 tokens.
This shows that the second cohort of whales could have fallen prey to the capitulation event. In contrast, the first set of wallets seized the opportunity and accumulated Litecoin at a discount.
 [11-1752736153396.01.20, 17 Jul, 2025].png)
LTC Supply distribution chart. Source: Sentiment
CoinGlass derivatives data show that the Open Interest (OI) for LTC has increased by 9.52% over the last 24 hours, reaching $746.84 million. An increasing OI represents new or additional money entering the market and new buying, which could fuel the current LTC price rally.
Additionally, the LTC OI-Weighted Funding Rate data shows a massive positive spike, reading 0.022% on Thursday, indicating that longs are paying shorts. Historically, as shown in the chart below, when funding rates experience a significant spike, Litecoin prices have surged sharply afterwards.
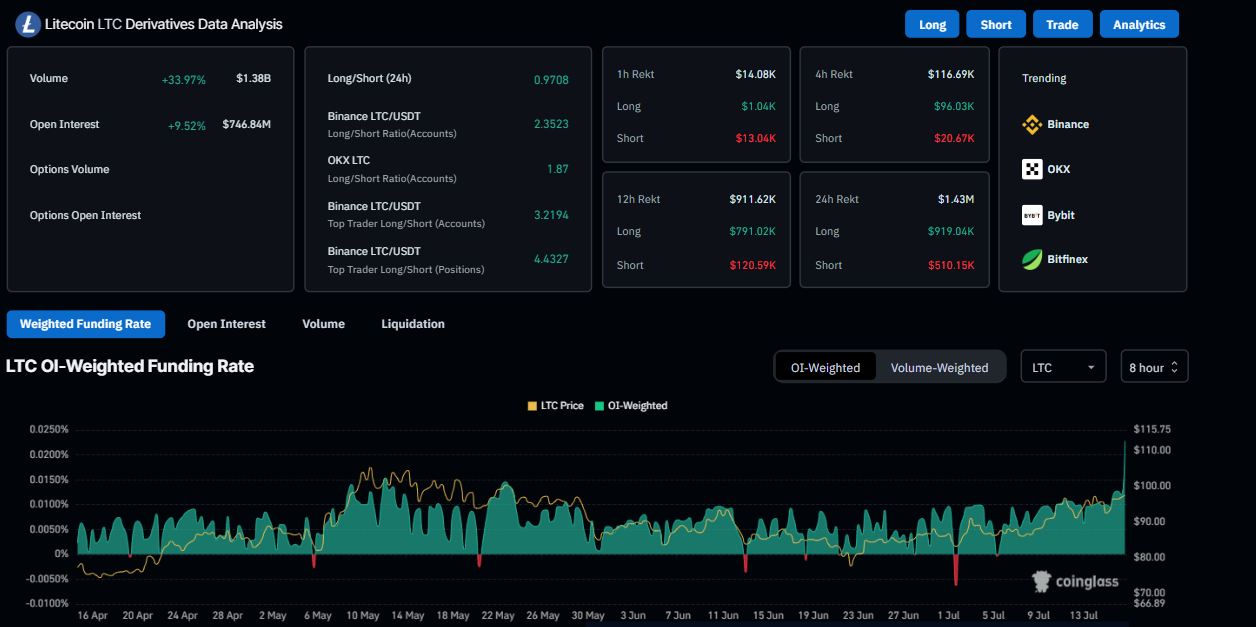
Litecoin derivatives data chart. Source: Coinglass
Litecoin Price Forecast: LTC bulls aiming for levels above $100
Litecoin price closed above the weekly resistance level at $96.30 on Wednesday after finding support around its 50% Fibonacci retracement at $91.61 (drawn from the May 10 high of $107.05 to the June 22 low of $76.17) and the 200-day Exponential Moving Average (EMA) at $91.78 on Tuesday. At the time of writing on Thursday, it continues to trade higher at around $98.27.
If LTC continues its upward trend, it could extend the rally to retest the May 10 high of $107.05.
The Relative Strength Index (RSI) on the daily chart reads 67, which is above its neutral line but still below overbought conditions, indicating strong bullish momentum. The Moving Average Convergence Divergence (MACD) exhibited a bullish crossover at the end of June that still holds. The rising green histogram bars above its neutral zero line suggest that bullish momentum is gaining traction.
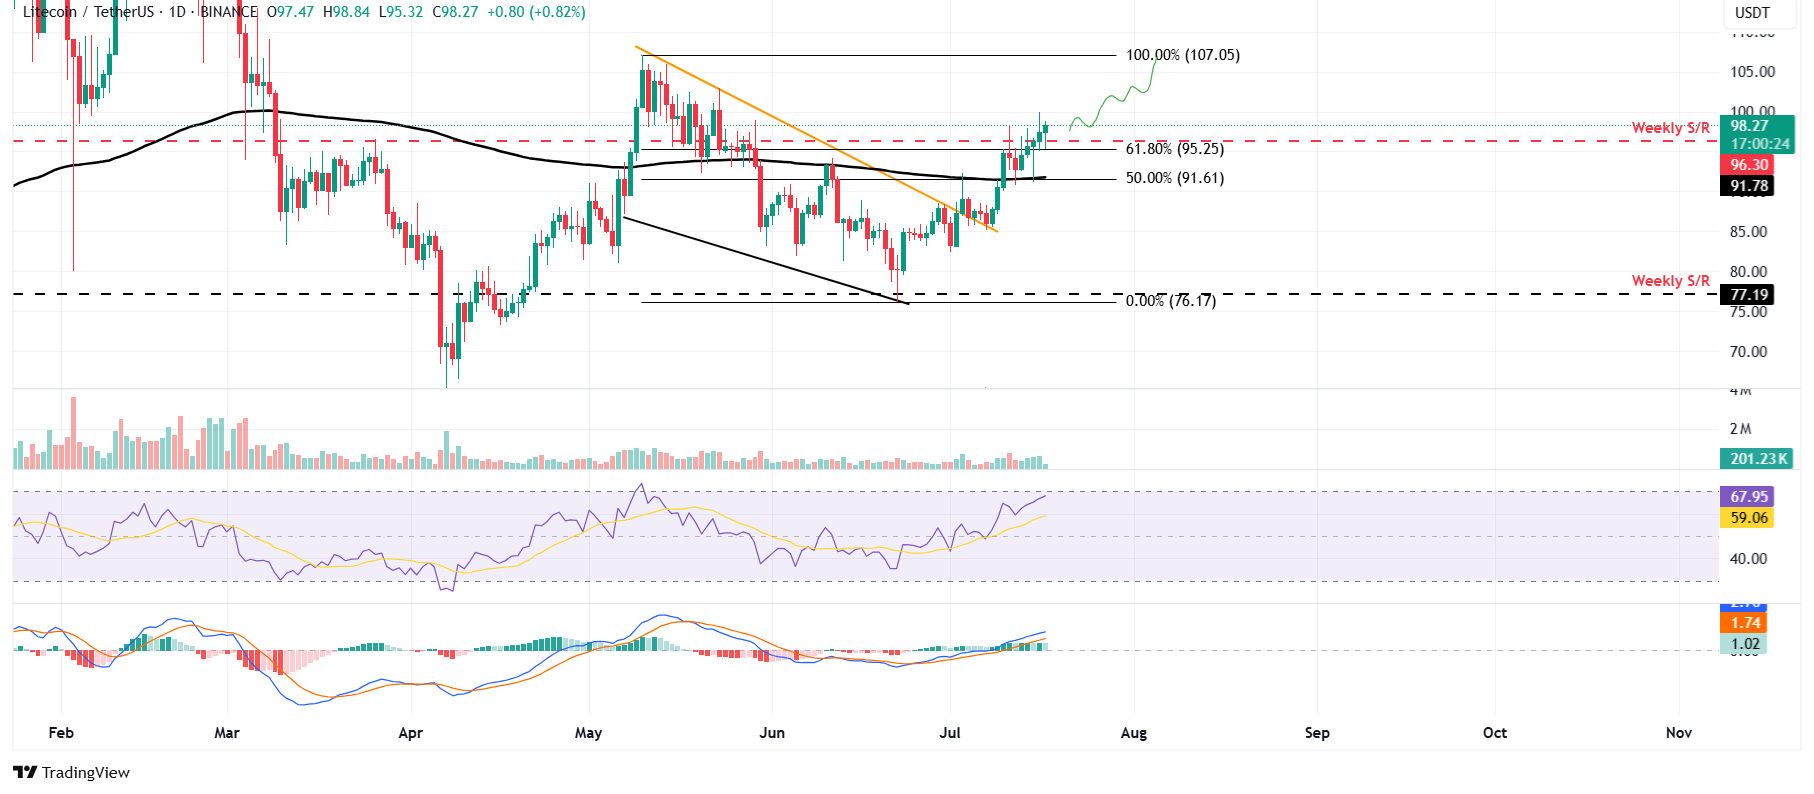
LTC/USDT daily chart
If LTC faces a pullback and closes below the weekly level at $96.30, it could extend the decline to find support around the 200-day EMA at $91.78.
Bài viết đề xuất


