
Chainlink stabilizes as Westpac and Imperium Markets adopt LINK in Project Acacia
- Chainlink price stabilizes around $16.47 on Thursday after rallying 5% so far this week.
- The Westpac Institutional Bank and Imperium Markets are implementing Chainlink in Project Acacia.
- The technical outlook suggests a continuation of the rally, targeting the $18.81 mark.
Chainlink (LINK) price is stabilizing at around $16.47 on Thursday after rallying 5% so far this week. LINK announced on Thursday that major institutions, including Westpac Institutional Bank and Imperium Markets, will integrate Chainlink in Project Acacia, thereby boosting institutional use cases. The technical setup supports the bullish sentiment, with LINK poised to target the $18.81 level if momentum continues.
Chainlink collaborates with Reserve Bank of Australia-backed project Acacia
Chainlink announced on Thursday that Westpac Institutional Bank and Imperium Markets are implementing Chainlink in Project Acacia, a new joint initiative between the Reserve Bank of Australia and Digital Finance CRC.
The Project Acacia leverages Chainlink’s Runtime Environment (CRE), orchestrating secure, seamless, and compliant Delivery vs. Payment (DvP) settlement of tokenized assets across blockchain markets and the existing PayTo Australia domestic payments system.
“This capability is key to accelerating the adoption of digital assets and bringing institutional capital onchain,” said Chainlink on its X post.
“The Australian central bank has estimated that the potential savings from tokenisation – where assets are issued as digital tokens on a blockchain – could be in the range of AUD 1 billion to AUD 4 billion each year, with annual savings of up to AUD 13 billion available to issuers in Australian capital markets,” said Westpac Institutional Bank on its blog post.
This news announcement is bullish for Chainlink in the long term, as it indicates that global banks and central banks are adopting LINK to power the future of money, thereby boosting institutional use cases, which could drive investor confidence, lead to more partnerships, and ultimately increase the utility of LINK tokens.
Chainlink Price Forecast: LINK finds support around a key level
Chainlink price broke and found support around the daily resistance level at $15.07 on June 11. This daily level coincided with the 200-day Exponential Moving Average (EMA) at $15.18, making this a key support zone. LINK rebounded after retesting this level on Tuesday and rallied 3.48% the next day. At the time of writing on Thursday, it trades slightly down at around $16.47.
If the $15.07 support level continues to hold, the LINK price could extend its rally to retest its next weekly resistance at $18.81.
The Relative Strength Index (RSI) on the daily chart reads 70, following rejection from its overbought conditions on Wednesday, indicating a fading of bullish momentum. However, the Moving Average Convergence Divergence (MACD) showed a bullish crossover at the end of June. It also shows rising green histogram bars above its neutral zero line, suggesting that bullish momentum is gaining traction and continuing an upward trend.
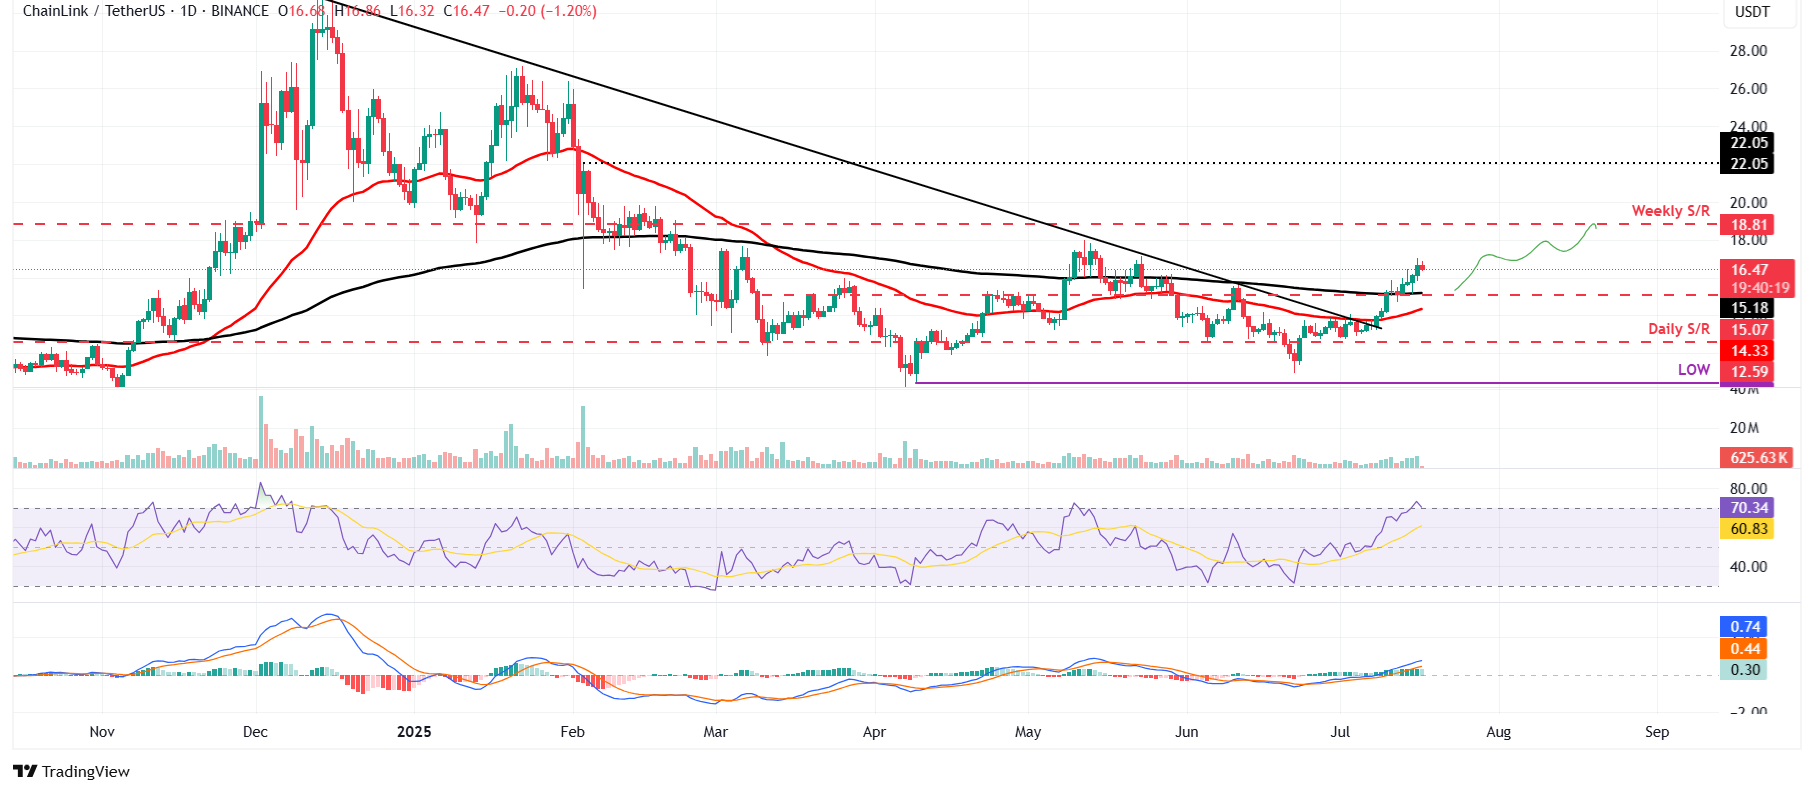
LINK/USDT daily chart
However, if LINK faces a correction and closes below its daily support at $15.07, it could extend the decline to find support around its 50-day EMA at $14.33.
Bài viết đề xuất


