
Crypto Today: Bitcoin's new all-time high reignites risk-on sentiment as Ethereum, XRP bulls increase exposure
- Bitcoin could extend its price discovery phase amid renewed risk-on sentiment following its new record high.
- Ethereum extends gains toward $2,880 critical resistance on the backdrop of rising spot ETF inflows.
- XRP extends recovery above $2.40, underpinned by multiple technical bullish signals.
The cryptocurrency market offers bullish signals on Thursday, buoyed by steady institutional interest, particularly in Bitcoin (BTC) and Ethereum (ETH) spot Exchange Traded Funds (ETFs). Investors appear to be largely ignoring the rise in macroeconomic uncertainty due to tariff developments in the United States (US) and President Trump’s continued pressure on the Federal Reserve (Fed). At the same time, a weaker US Dollar (USD) seems to be pushing investors toward riskier assets such as Bitcoin, which reached a fresh all-time high on Wednesday and retreated afterwards.
Leading altcoins, including Ethereum and Ripple (XRP), are also following in Bitcoin’s footsteps as recovery continues during the European session. Ethereum boasts steady spot ETF inflows, while XRP builds on a technical pattern breakout.
Market overview: Bitcoin hits record highs as the US Dollar struggles
Bitcoin price shrugged off volatility surrounding tariff developments in the US, backed by growing institutional interest and risk-on sentiment, particularly in the derivatives market.
Open Interest (OI), which represents the value of all futures and options contracts that have not been settled or closed, has increased by more than 8% over the past 24 hours to approximately $80 billion. A subsequent 80% rise in volume to nearly $99 billion suggests that traders are increasingly betting on future price increases.
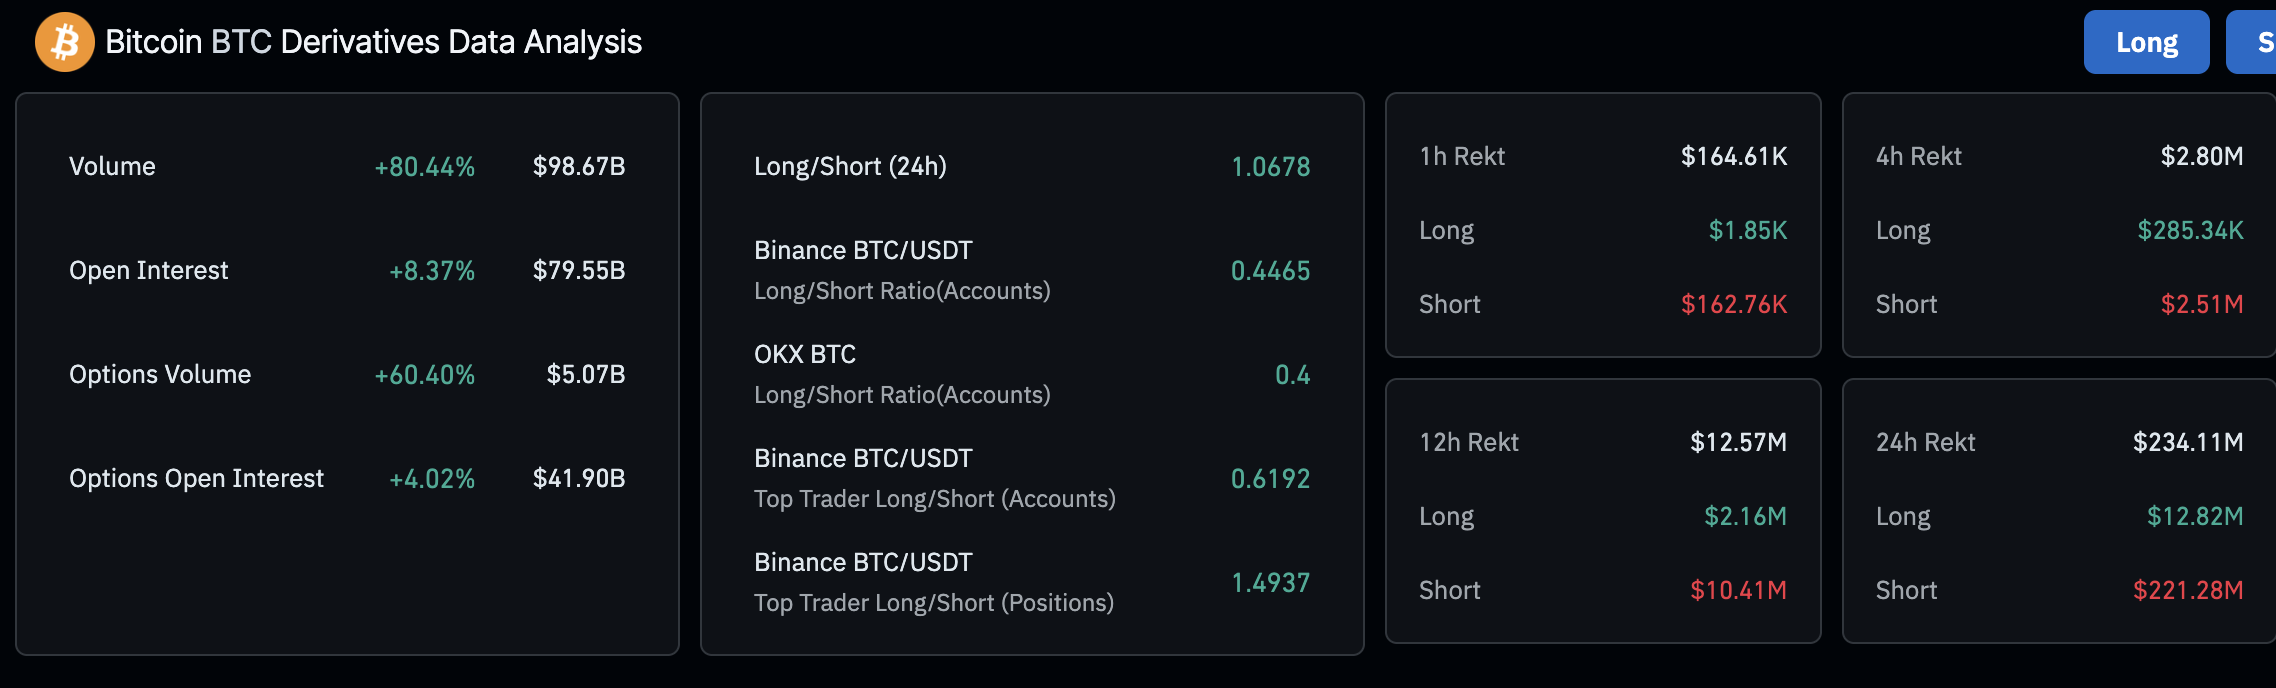
Bitcoin derivatives market data | Source CoinGlass
Meanwhile, the US Dollar Index (DXY), which tracks the value of the US Dollar (USD) against a basket of six major foreign currencies, shows signs of wobbling after its recovery from the multi-year low of 96.36 seen on July 1.
As the Greenback struggles due to macroeconomic factors, including pressure from tariffs and President Trump’s persistent attacks on Fed Chair Jerome Powell, investors view assets like Bitcoin as a hedge against these headwinds.
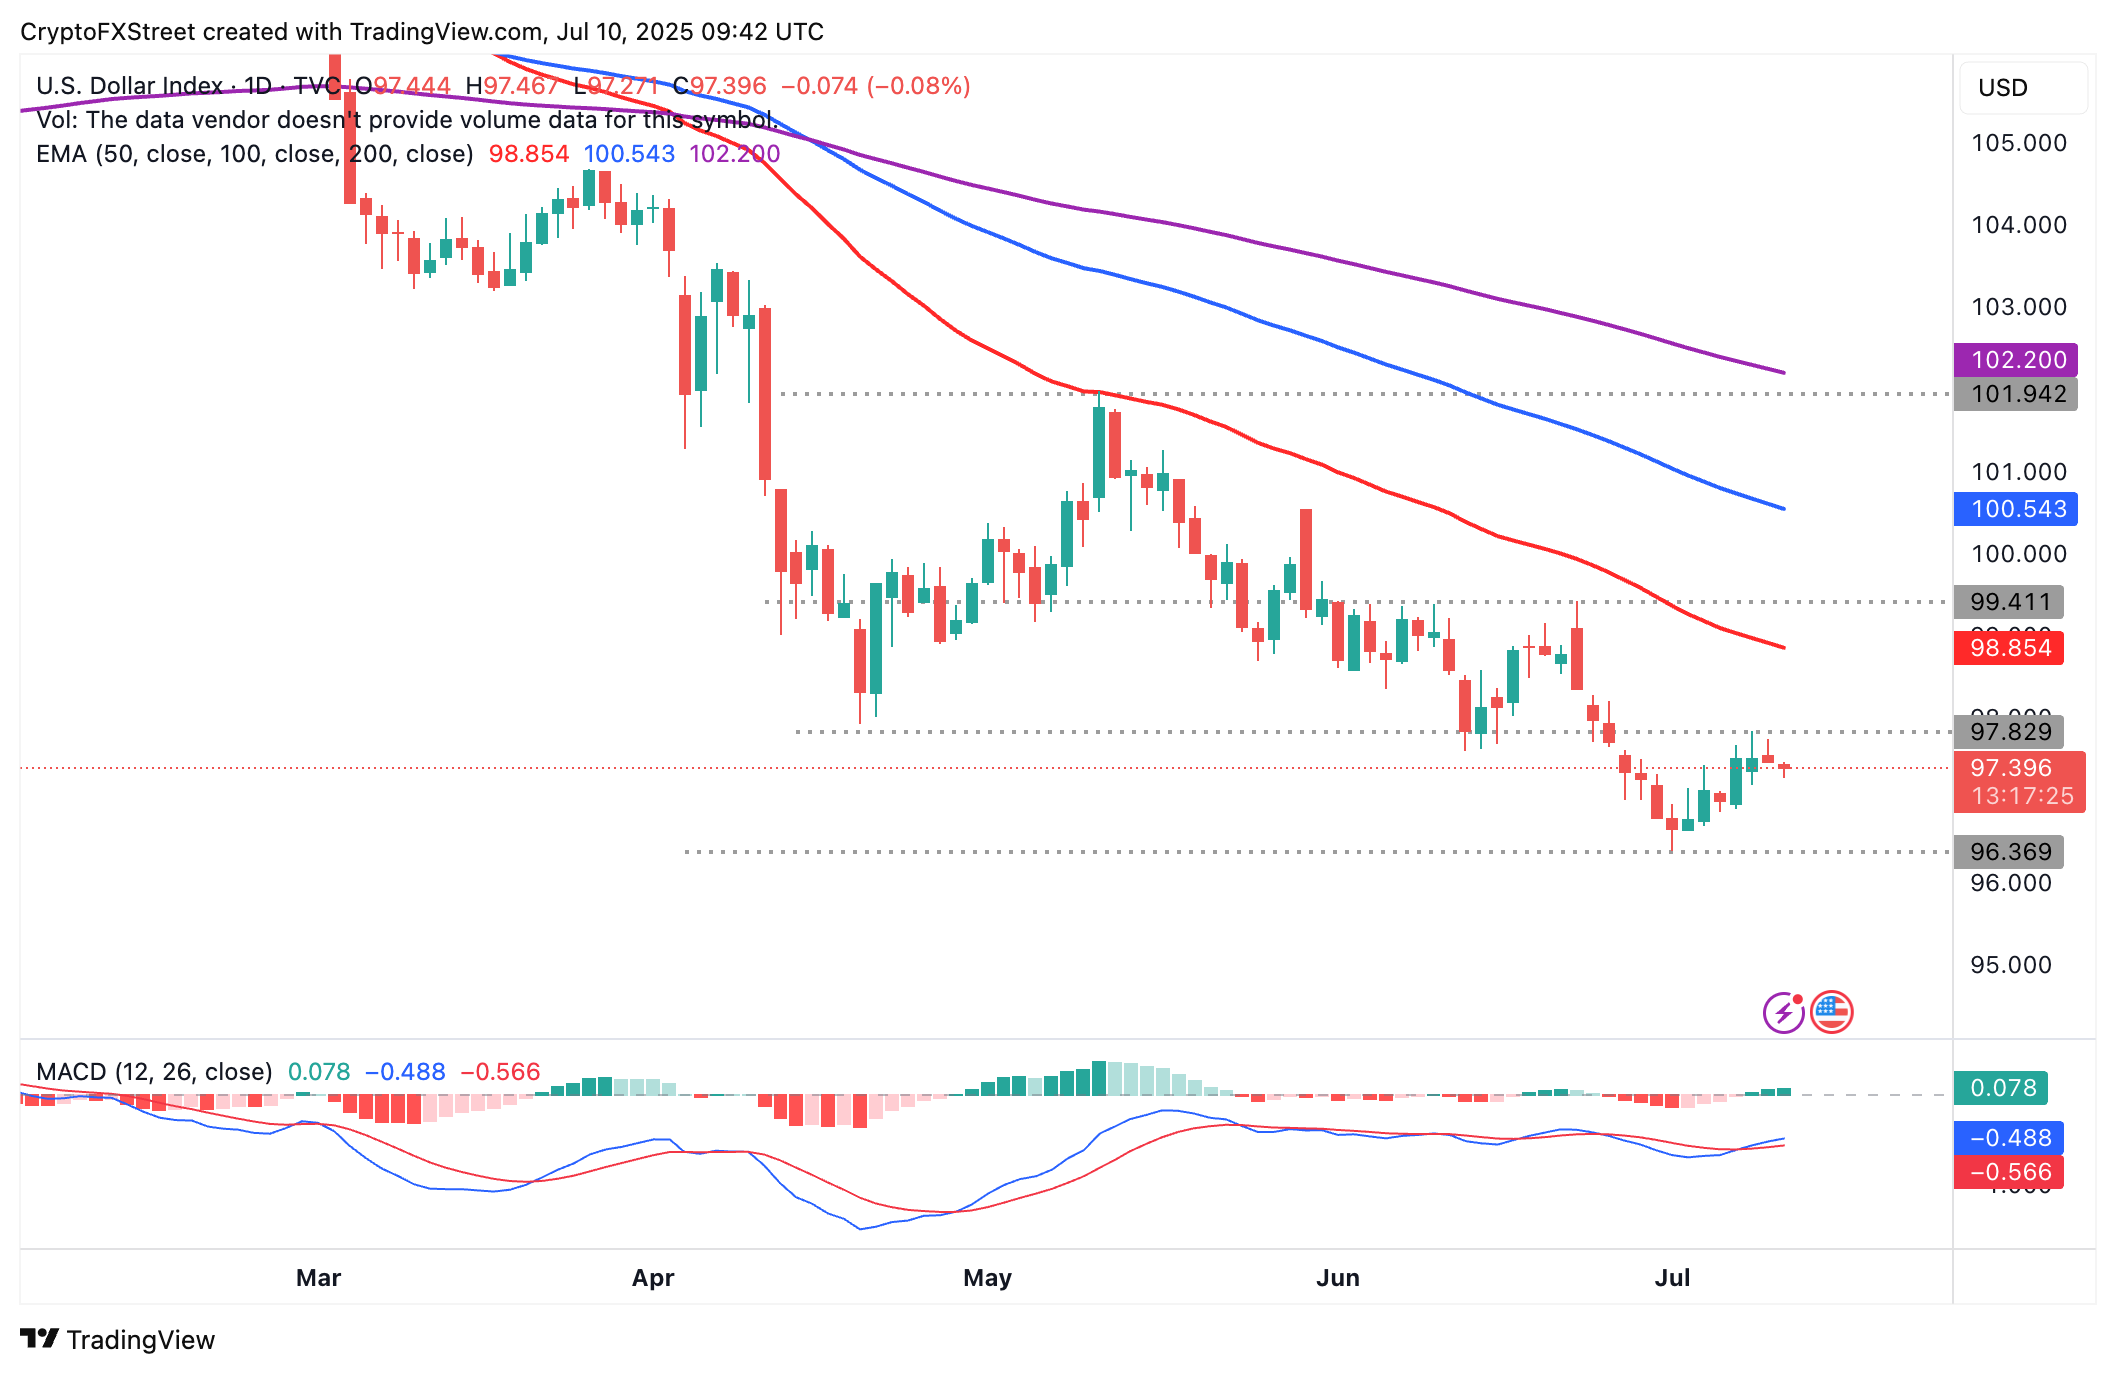
DXY daily chart
Data spotlight: Investors increase exposure to Bitcoin, Ethereum spot ETFs
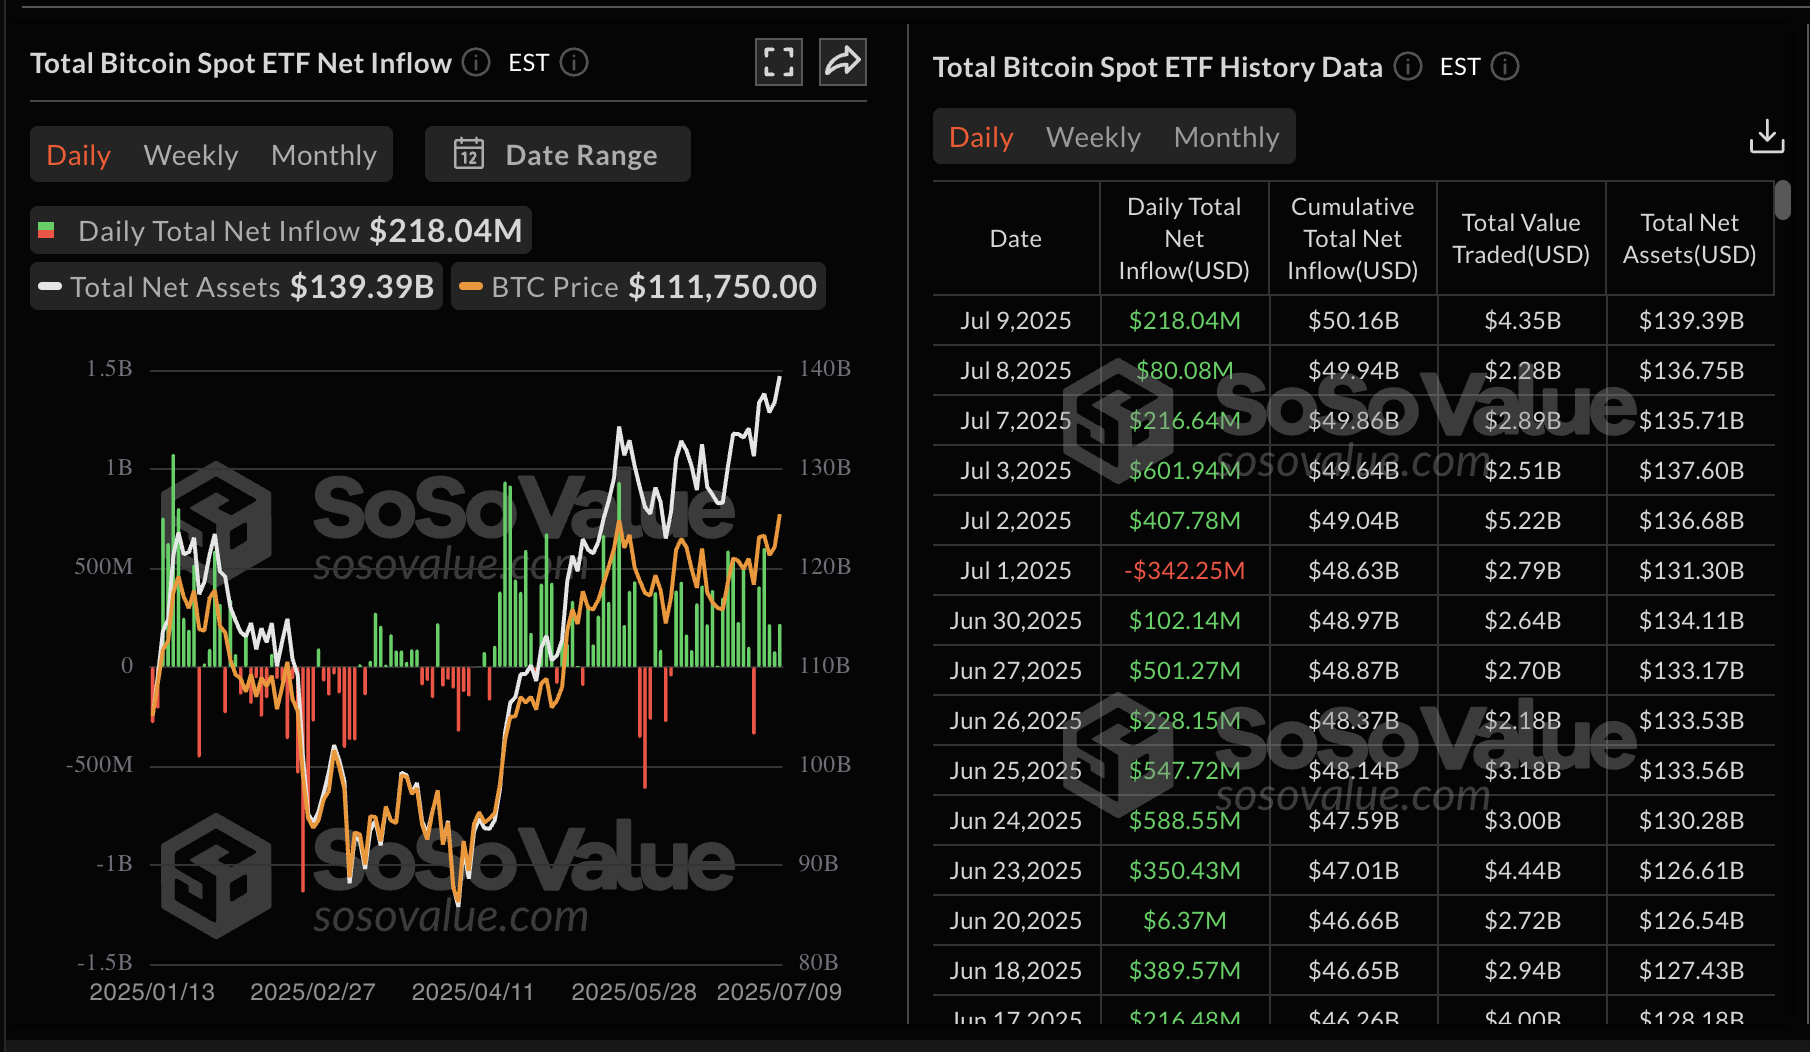
Bitcoin spot ETFs extended the bullish streak for a fourth consecutive day, with approximately $218 million in daily net inflow volume recorded on Wednesday. This marked a significant increase from the $80 million inflow posted on Tuesday, bringing the total net assets to around $139.4 billion.
Bitcoin spot ETF data | Source: SoSoValue
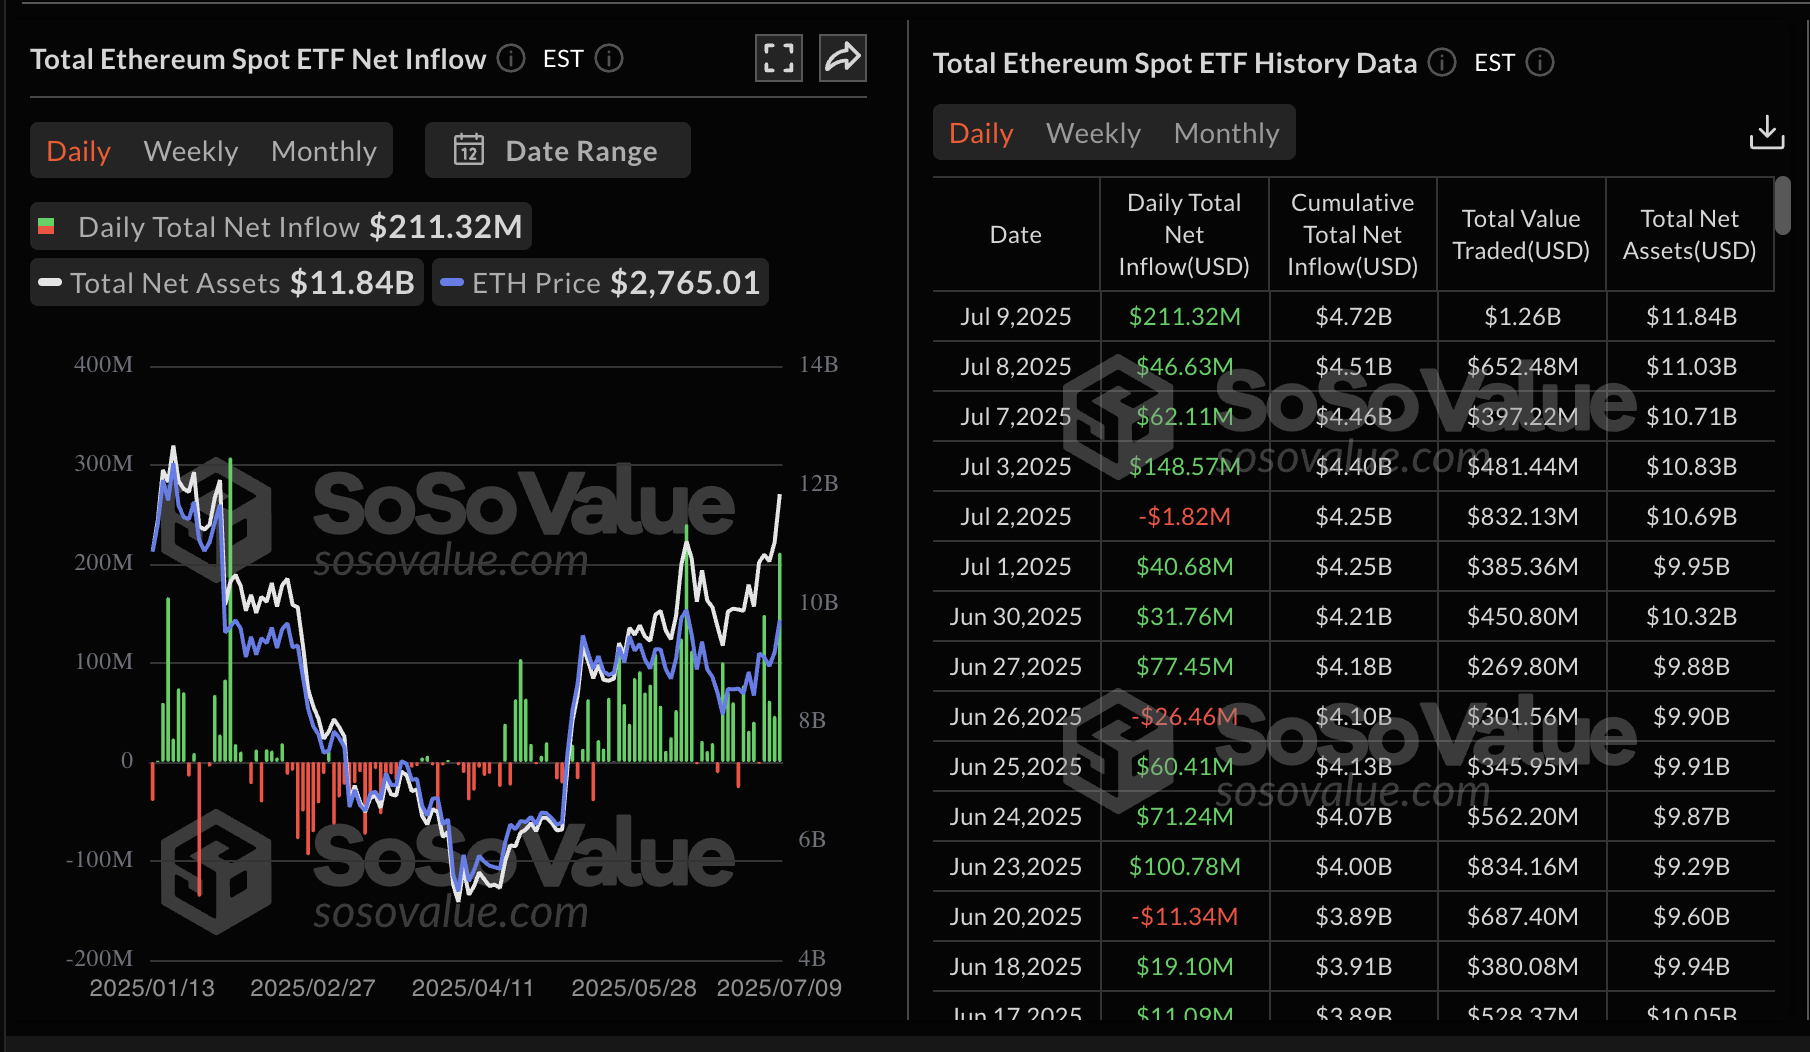
According to SoSoValue Data, Ethereum spot ETFs also saw a significant increase in inflow, totaling approximately $211 million on Wednesday. This marked a 78% increase compared to Tuesday’s inflow of around $47 million, underpinning the growing interest among institutional investors. Currently, the cumulative total net inflow stands at $4.72 billion, with the total net assets at $11.84 billion.
Ethereum spot ETF data | Source: SoSoValue
Chart of the day: Bitcoin consolidates near record highs
The Bitcoin price’s bullish outlook remains intact on Thursday, hovering near the new record high at $111,999. However, due to a slight pullback, BTC is trading at $111,084 at the time of writing.
Apart from the surge in investor interest, multiple bullish cues bolster the strong technical structure. Traders will likely continue seeking exposure as long as the Moving Average Convergence Divergence (MACD) indicator maintains a buy signal, which was first flashed on June 25.
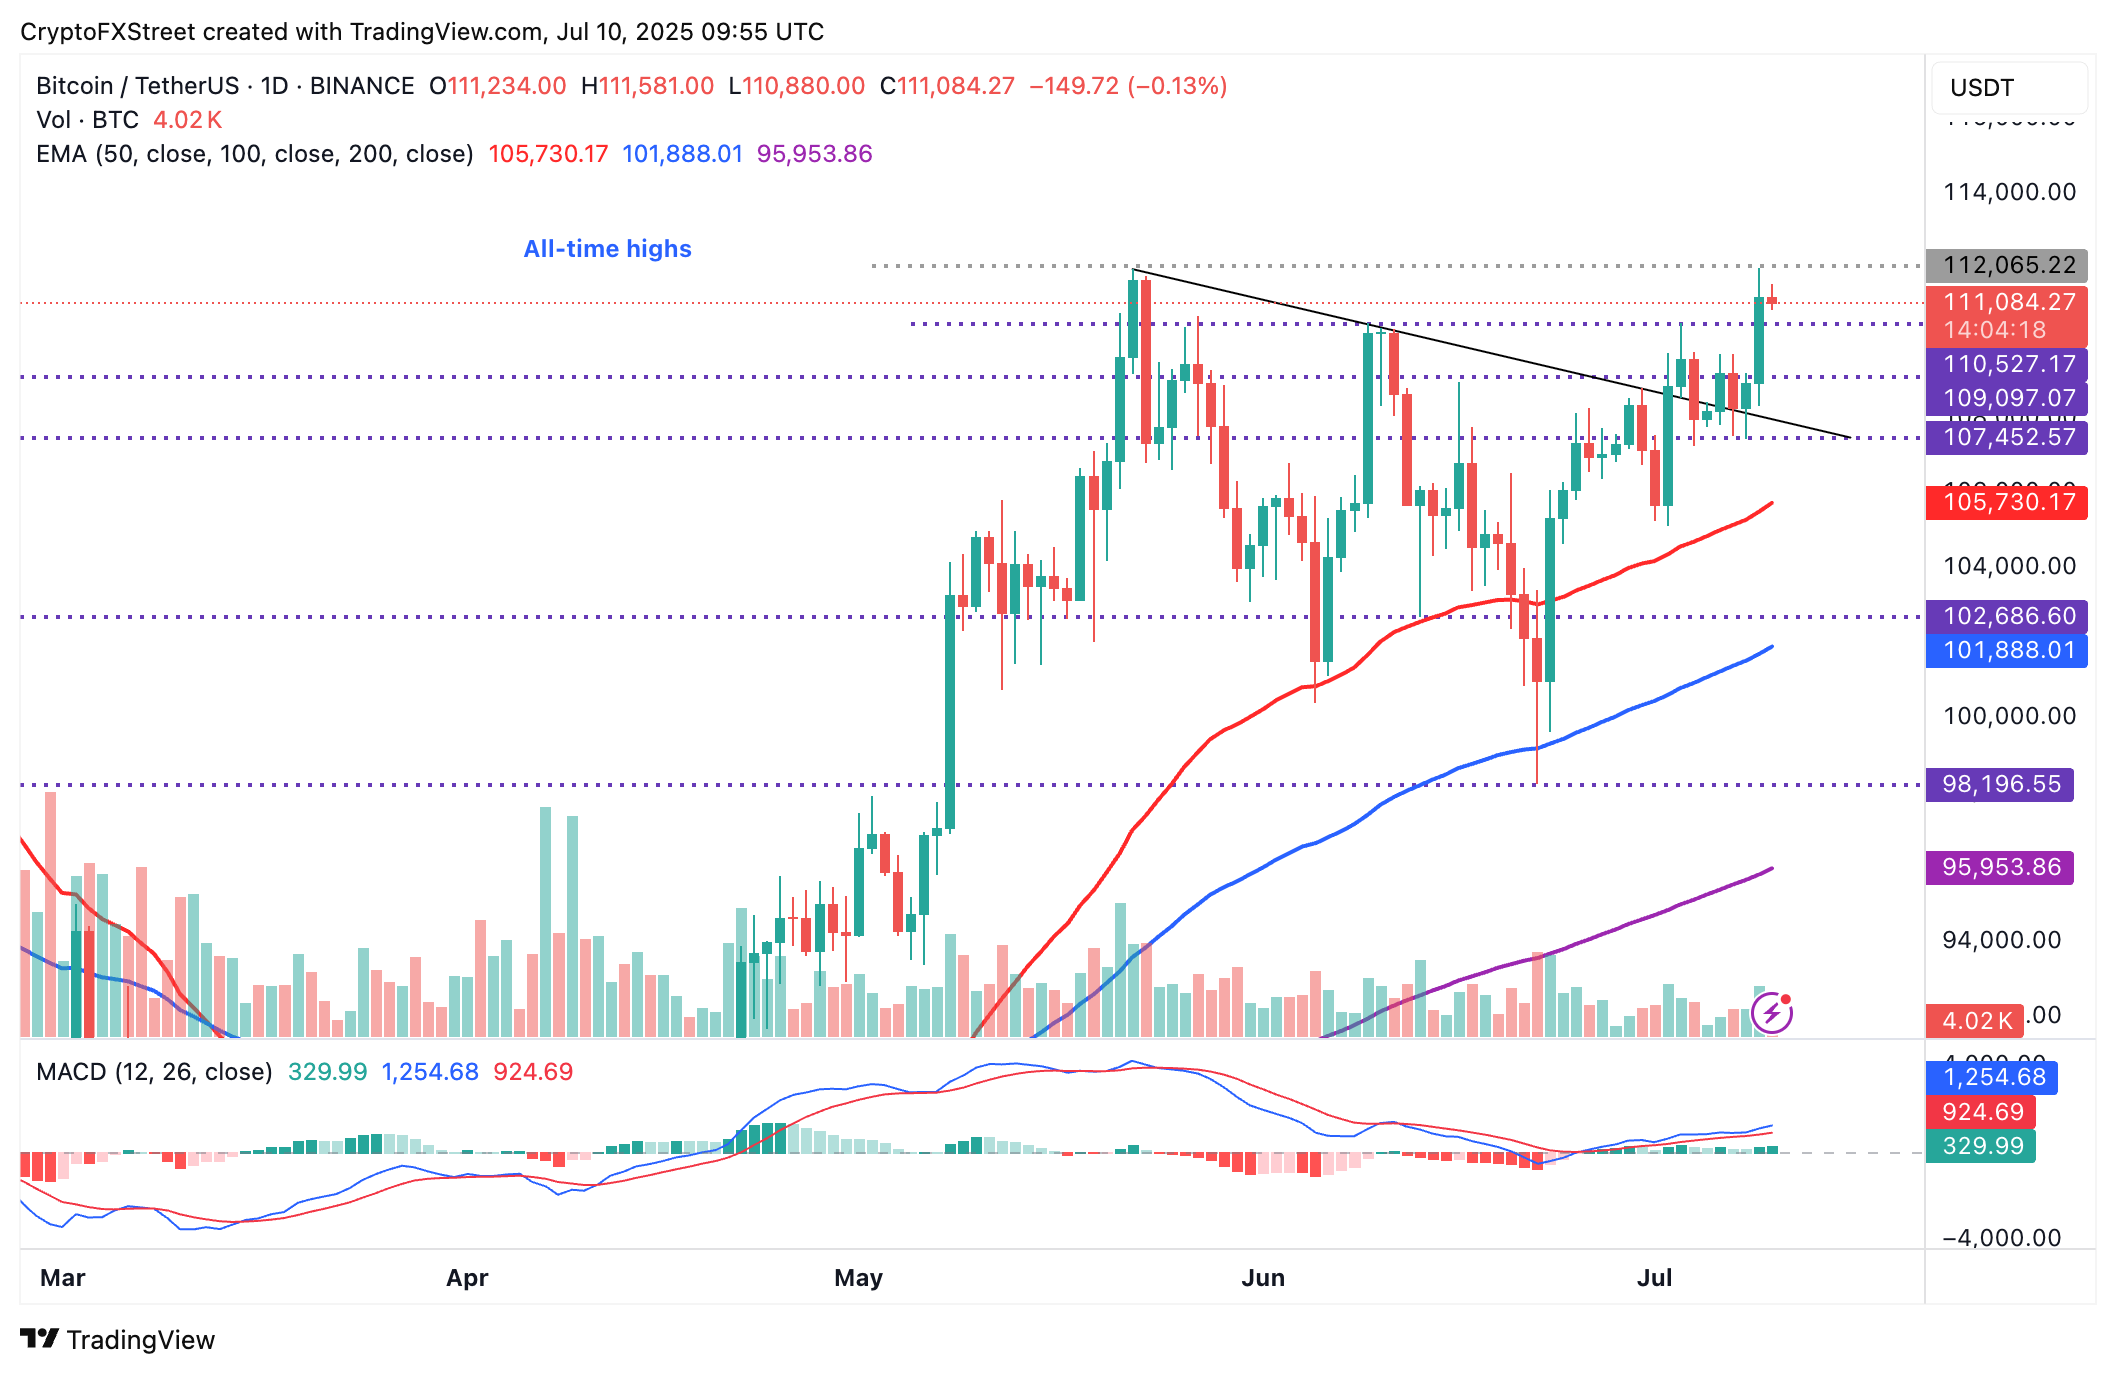
BTC/USDT daily chart
Still, if macroeconomic uncertainty triggers headwinds in the coming days, traders should be prepared for potential corrections, with dips likely to offer new entry points. Profit-taking could also contribute to the headwinds as investors gauge the capacity of the price discovery phase, which is expected to extend toward $120,000 by the end of July, as predicted by Bitget’s Research Chief Analyst, Ryan Lee.
Altcoins update: Ethereum, XRP bulls push higher
Ethereum price edges higher after breaking above two key resistance levels, at around $2,644 and $2,738. The largest smart contracts token by market capitalization is trading at around $2,775 as bulls push toward the next critical hurdle highlighted by the horizontal line at $2,880 on the daily chart (see below).
The path of least resistance is upward, backed by a MACD buy signal. A golden cross pattern has also been established, as the 50-day Moving Average (EMA) crossed above the 200-day EMA at around $2,478 earlier on Thursday.
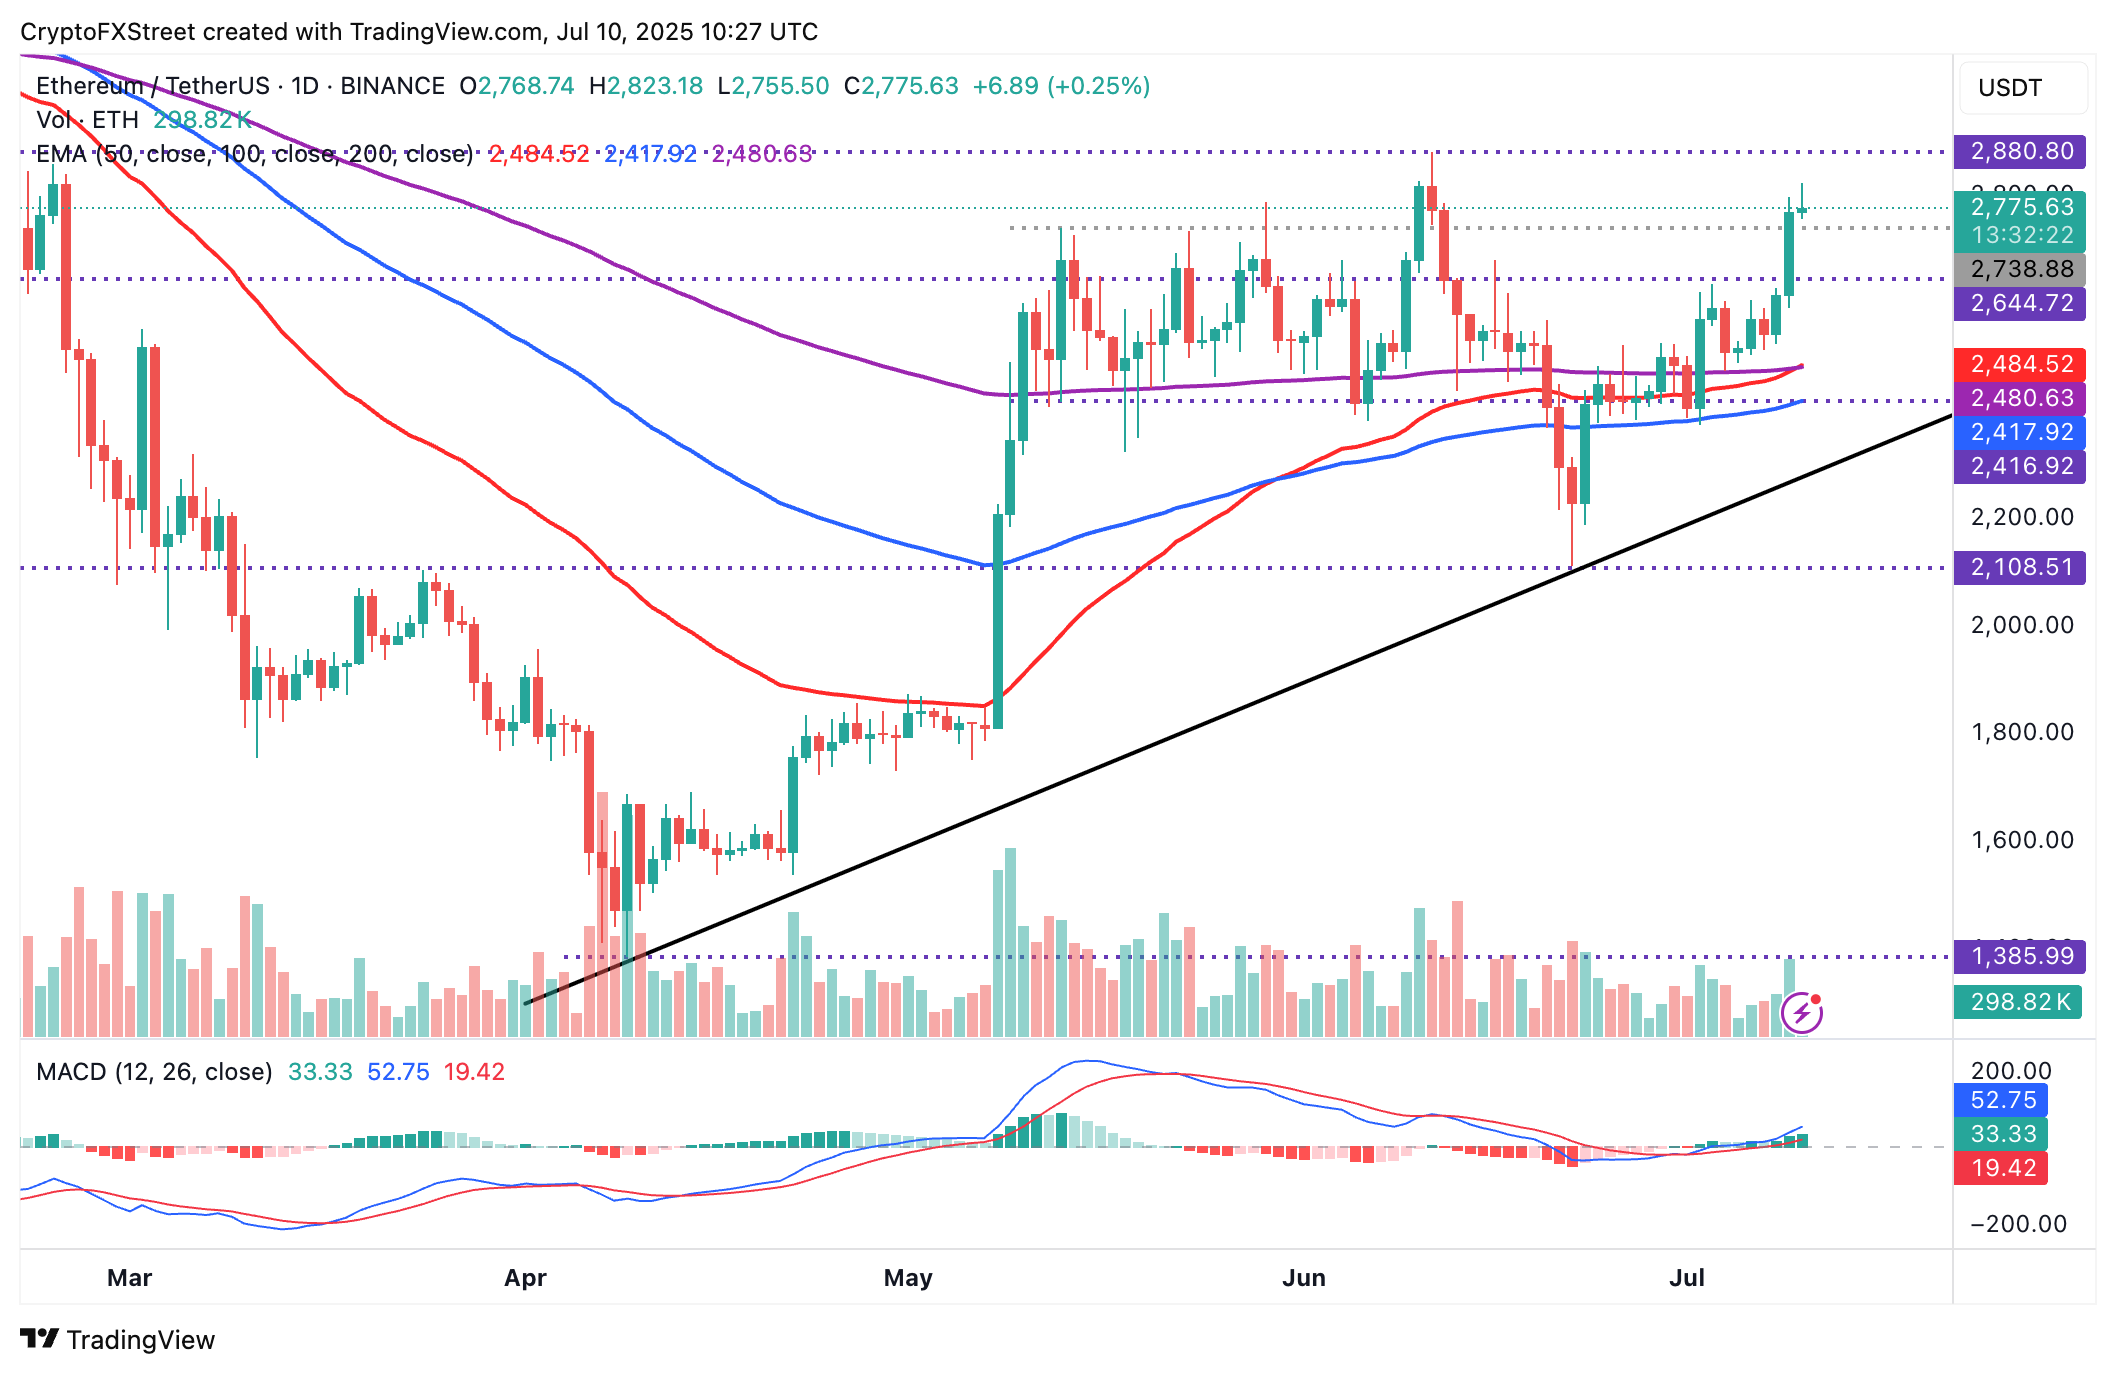
ETH/USD daily chart
As for XRP, bulls appear to have the upper hand, pushing the price to hover at around $2.43 at the time of writing. This follows an inverse Head-and-Shoulders (H&S) pattern breakout, which projects an 18% move from the neckline resistance at $2.33 to highs around $2.76.
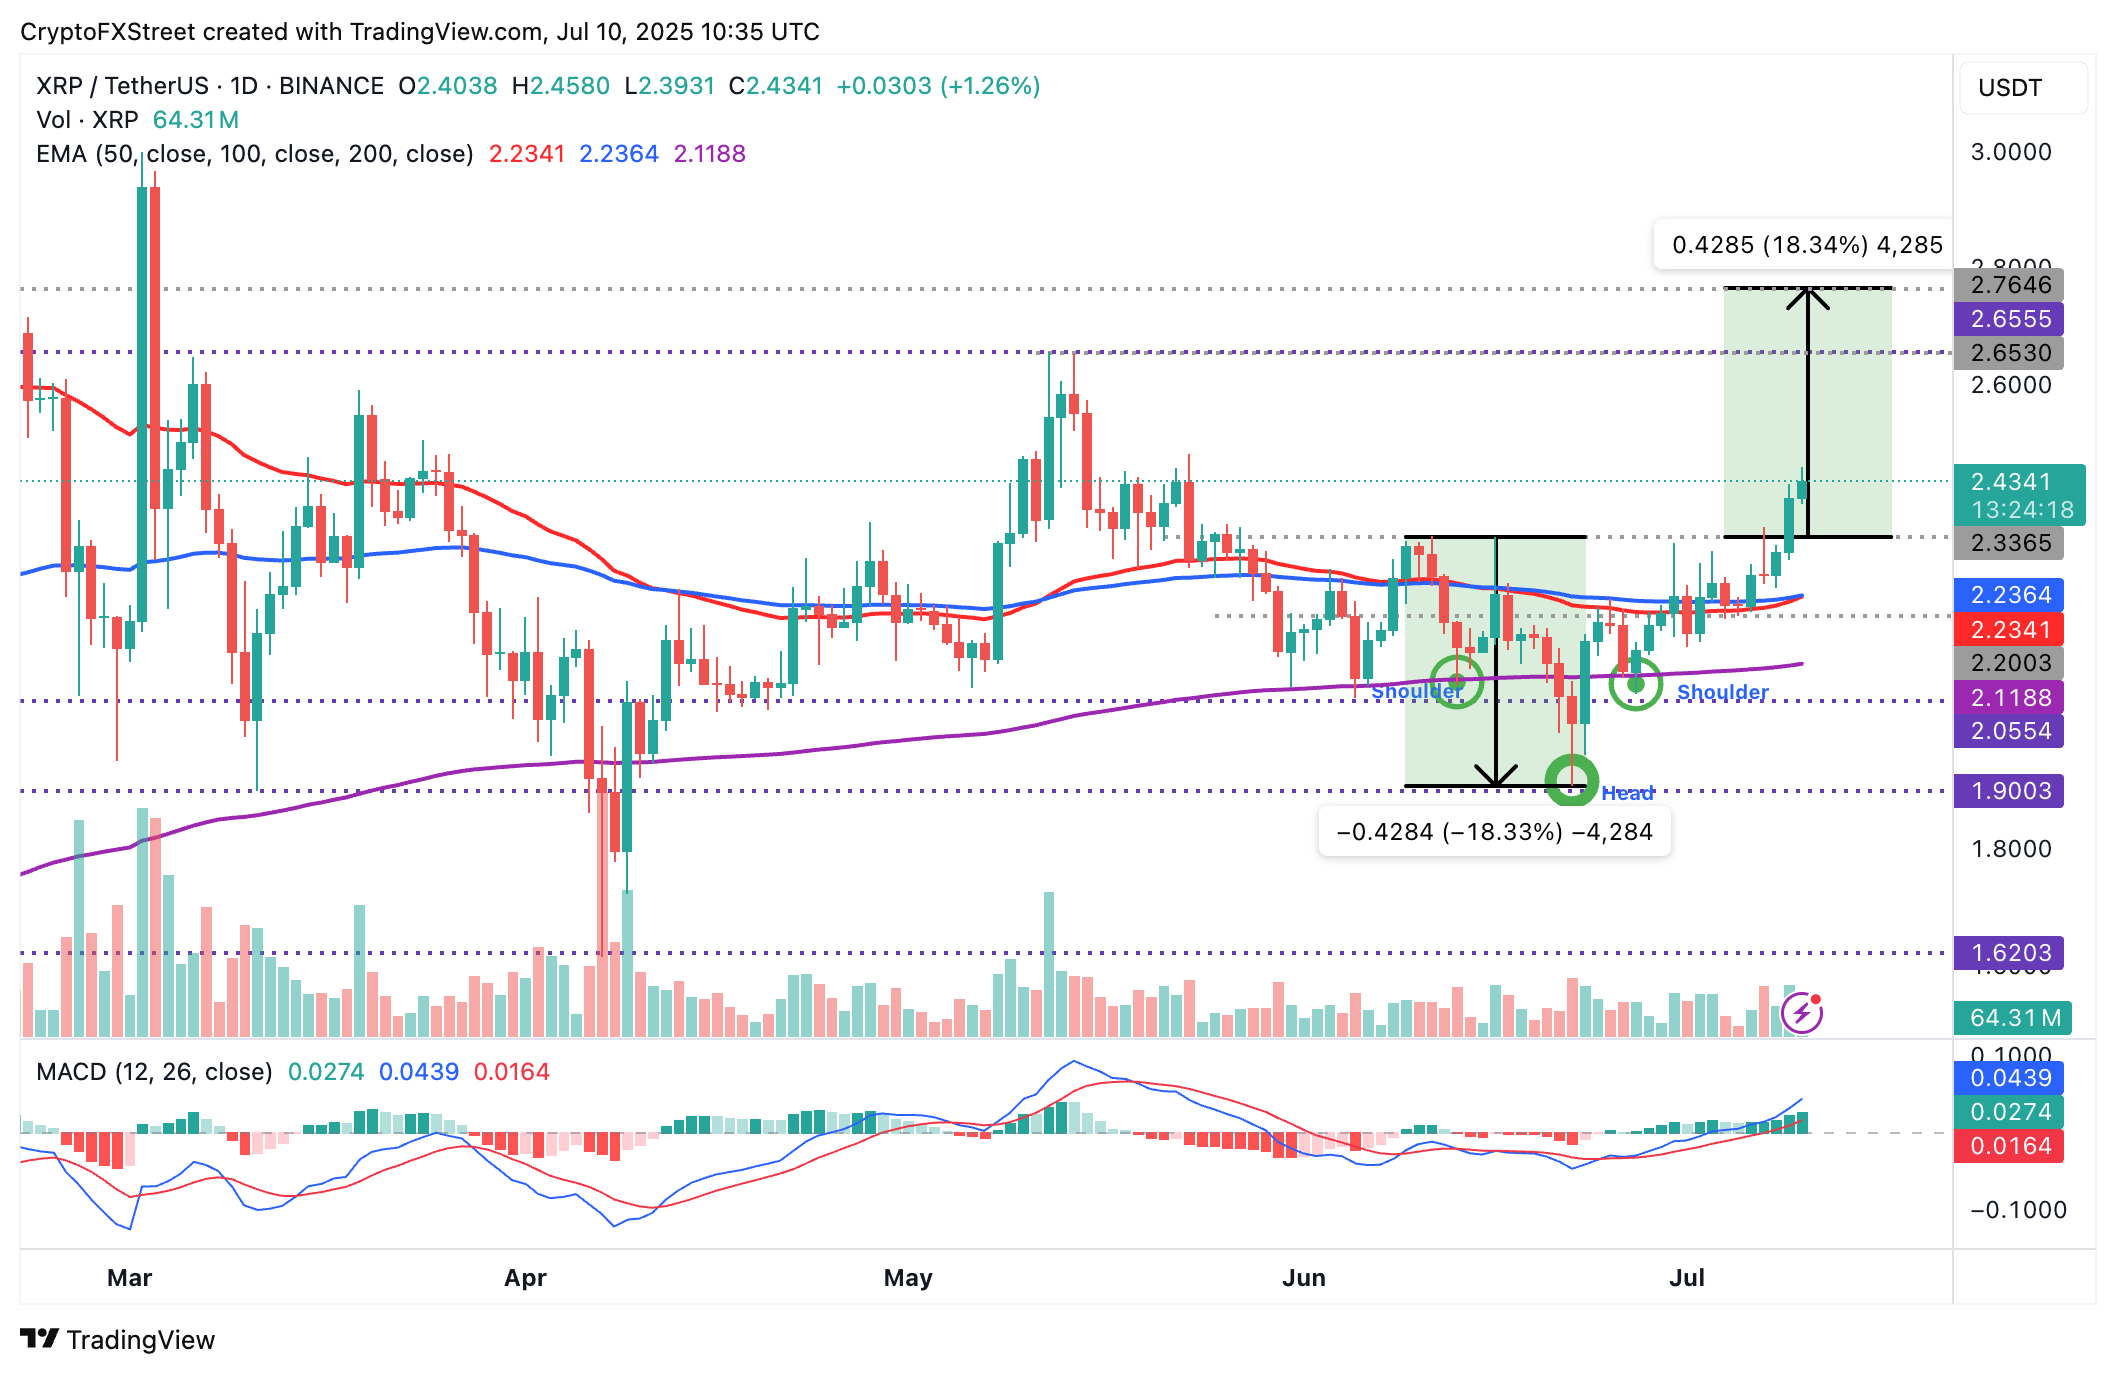
XRP/USDT daily chart
Still, traders should temper their expectations and closely monitor the macroeconomic environment to gauge the strength of the uptrend.
Potential profit-taking could overshadow the tailwind, leading to a correction. Notably, the confluence support at $2.23 formed by the 50-day EMA and the 100-day EMA could absorb the sell-side pressure.
Cryptocurrency prices FAQs
Token launches influence demand and adoption among market participants. Listings on crypto exchanges deepen the liquidity for an asset and add new participants to an asset’s network. This is typically bullish for a digital asset.
A hack is an event in which an attacker captures a large volume of the asset from a DeFi bridge or hot wallet of an exchange or any other crypto platform via exploits, bugs or other methods. The exploiter then transfers these tokens out of the exchange platforms to ultimately sell or swap the assets for other cryptocurrencies or stablecoins. Such events often involve an en masse panic triggering a sell-off in the affected assets.
Macroeconomic events like the US Federal Reserve’s decision on interest rates influence crypto assets mainly through the direct impact they have on the US Dollar. An increase in interest rate typically negatively influences Bitcoin and altcoin prices, and vice versa. If the US Dollar index declines, risk assets and associated leverage for trading gets cheaper, in turn driving crypto prices higher.
Halvings are typically considered bullish events as they slash the block reward in half for miners, constricting the supply of the asset. At consistent demand if the supply reduces, the asset’s price climbs.
Bài viết đề xuất


