
Meme Coins Price Prediction: Dogecoin, Shiba Inu, Pepe eye further gains as momentum recovers
- Dogecoin trades in the green as it inches closer to a rounding bottom pattern breakout.
- Shiba Inu extends its rebound rally to a 30-day high amid rising momentum.
- Pepe holds 8% gains from Wednesday as it breaks out of a triangle pattern.
Meme coins Dogecoin (DOGE), Shiba Inu (SHIB), and Pepe (PEPE) extend gains as bullish momentum resurfaces with Bitcoin (BTC) hitting a new all-time high. The technical outlook for meme coins remains bullish, as DOGE nears a crucial resistance level, while SHIB and PEPE eye further gains following the recent breakouts.
Dogecoin’s reversal nears rounding bottom breakout
Dogecoin remains indecisive at press time on Thursday, forming a Doji candle following a 5.61% jump the previous day. The crucial resistance of $0.1811, acting as the neckline of a rounding bottom pattern, could have resulted in the short-term buffer in DOGE’s recovery.
Typically, the rounding bottom pattern foreshadows a bullish reversal after a prevailing downfall. A positive daily close above this level would mark the rounding breakout, targeting the June 10 high of $0.1987.
The Relative Strength Index (RSI) on the daily chart reads 56 as it hovers slightly above the halfway line, indicating a bullish incline in trend momentum.
The Moving Average Convergence/Divergence (MACD) indicator displays rising green histogram bars, indicating rising trend momentum. Investors may consider the rising MACD and signal lines crossing above the zero line as a potential buy signal.
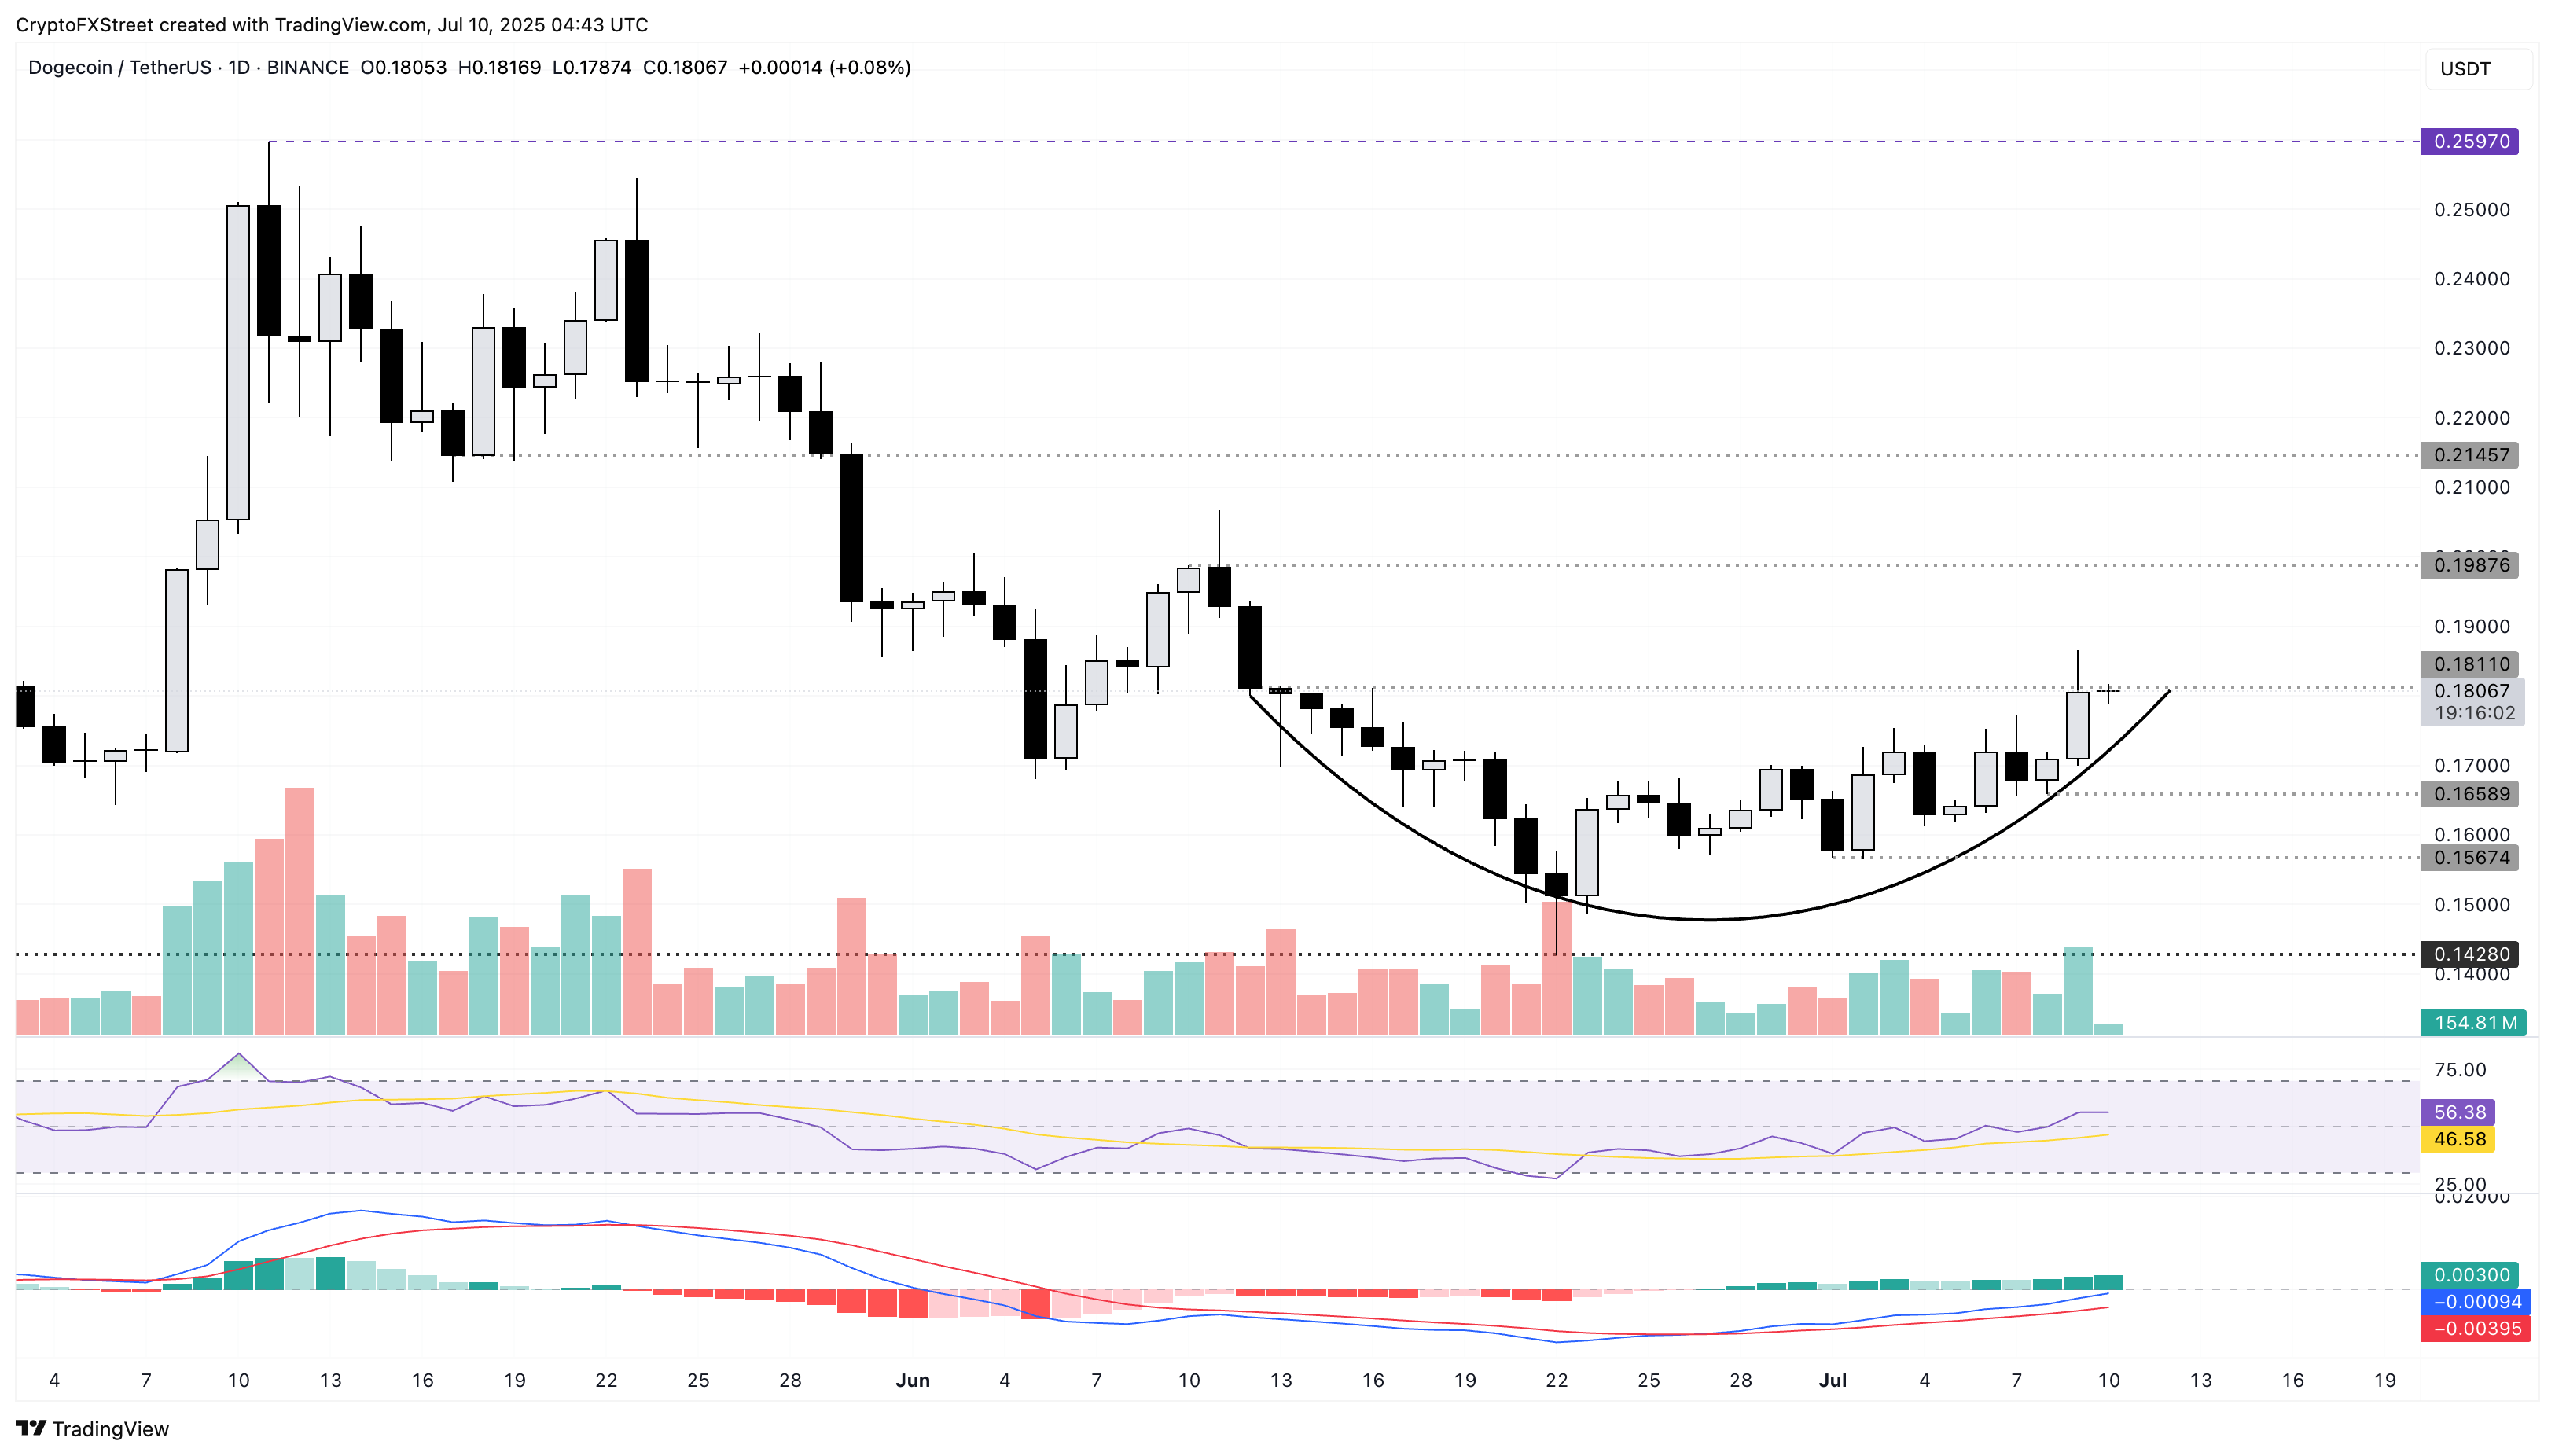
DOGE/USDT daily price chart.
A failure to surpass the $0.1811 level could result in a pullback to the weekly low of $0.1658.
Shiba Inu aims to extend gains as bullish momentum rises
Shiba Inu edges higher by nearly 1% at press time on Thursday, extending the 4.56% rise from Wednesday. The rebound rally in SHIB starting from the June 22 low of $0.00001004 exceeds the $0.00001200 round figure and reaches a new 30-day high.
As the trend reversal in Shiba Inu gains traction, bulls target the immediate resistance at $0.00001337, marked by the June 10 high.
The RSI reads 57, rising above its neutral zone and suggesting a growth in bullish momentum.
The MACD indicator shares a bullish bias as the MACD and its signal line inch closer to crossing above the zero line.
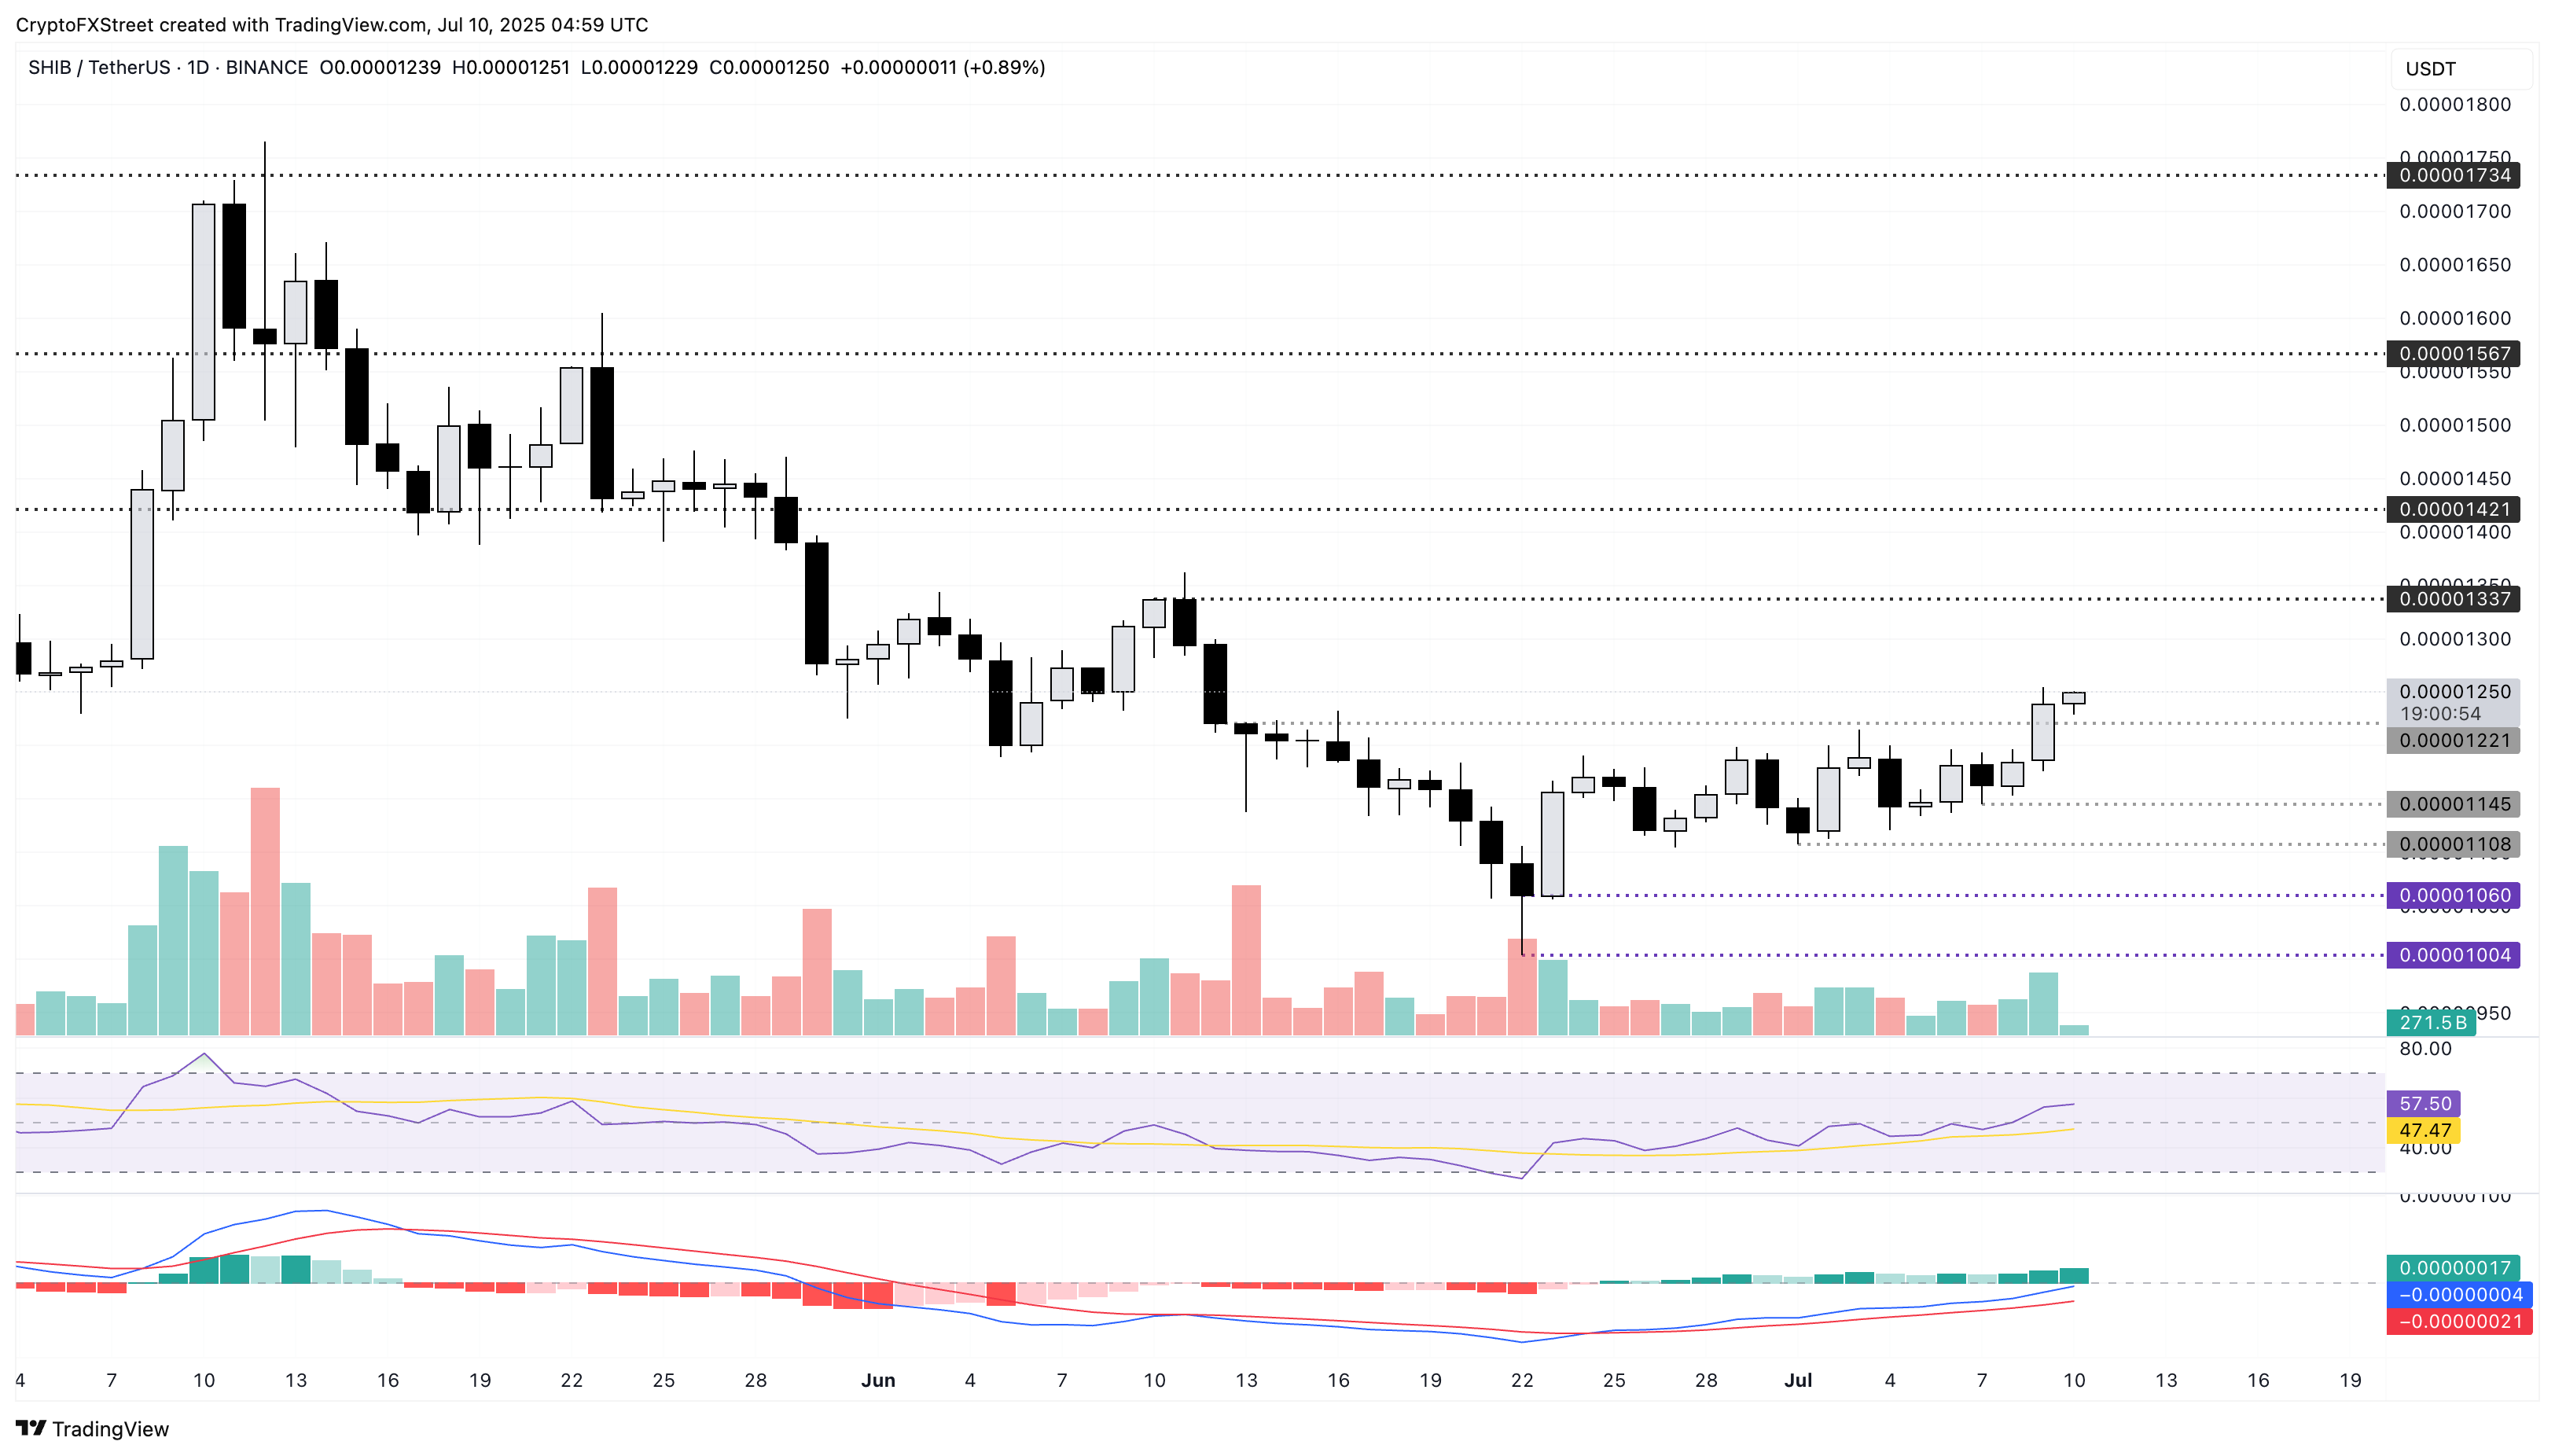
SHIB/USDT daily price chart.
On the contrary, a reversal in SHIB below the $0.00001200 round figure could extend the potential declining trend towards the weekly low of $0.00001145.
PEPE’s trend reversal gains traction
Pepe appreciated by nearly 0.50% at press time on Thursday following the 8.44% surge on Wednesday. The meme coin marks the breakout of a descending triangle pattern, as seen on the chart below, a possibility previously reported by FXStreet.
PEPE's breakout rally targets the $0.00001196 level marked by the May 17 low as the uptrend gains traction.
The technical indicators report increased trend momentum as the RSI reads 57 and rises towards the overbought boundary. Meanwhile, the MACD indicator displays a bullish trend in green histogram bars concurrent with the uptrend in the MACD and signal lines.
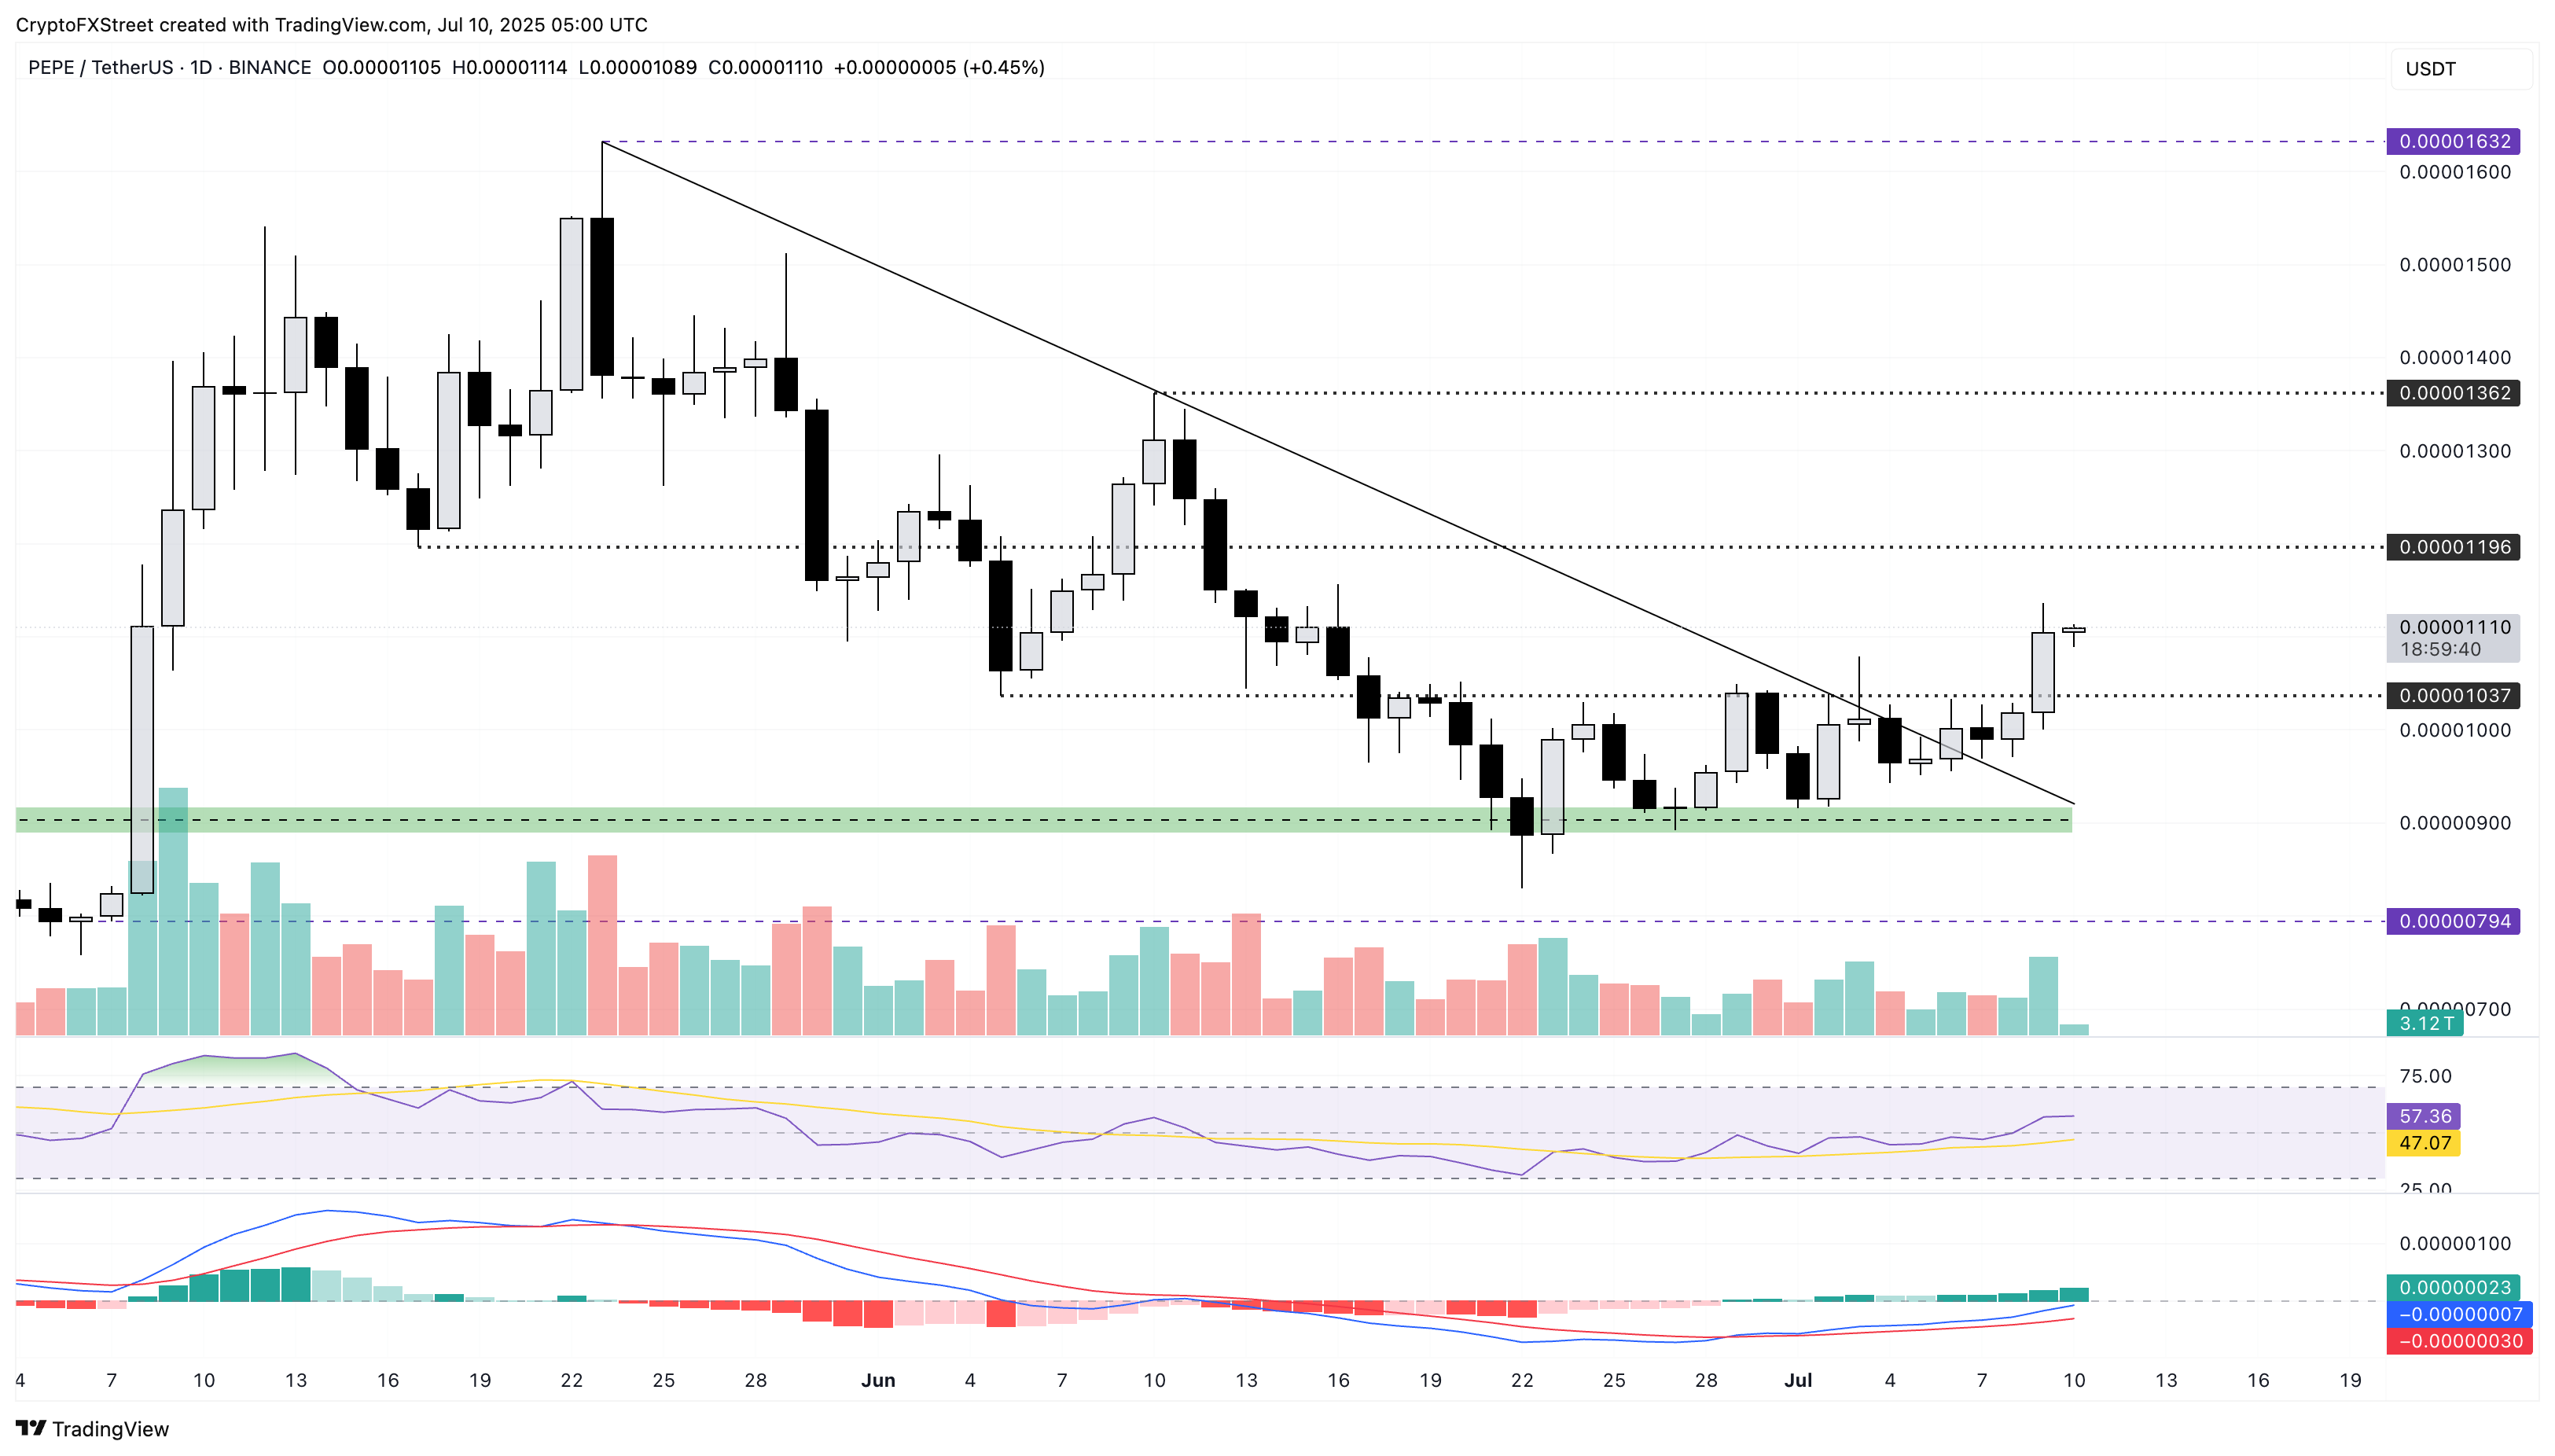
PEPE/USDT daily price chart.
If PEPE fails to uphold the bullish momentum, a pullback could retest the $0.00001037 high activity price action level, last tested on July 3.
Bài viết đề xuất


