
Avalanche, Toncoin Price Prediction: AVAX, TON active addresses double, signaling bullish breakout
- Avalanche upholds recovery amid bullish technical signals from the MACD and MFI indicators.
- Toncoin prints an intraday green candle reflecting positive market sentiment and ecosystem growth.
- Avalanche and Toncoin active addresses more than doubled over the past month, indicating renewed network activity.
The cryptocurrency market generally edges higher on Wednesday, with select altcoins such as Avalanche (AVAX) and Toncoin (TON) staging minor recoveries. AVAX has increased over 3% on the day and is currently trading at $17.59. The bullish outlook extends to TON, which is currently trading at $2.82, representing an increase of over 1%.
Avalanche, Toncoin active addresses double
The number of active addresses transacting on the Avalanche network by sending and receiving AVAX reached approximately 392,000 on Friday, up from about 192,000 recorded on May 27, representing 51% growth in 30 days.
According to IntoTheBlock data, the number of addresses joining the network edge higher, reaching approximately 199,000 on Sunday, before retreating to around 85,000 on Monday.
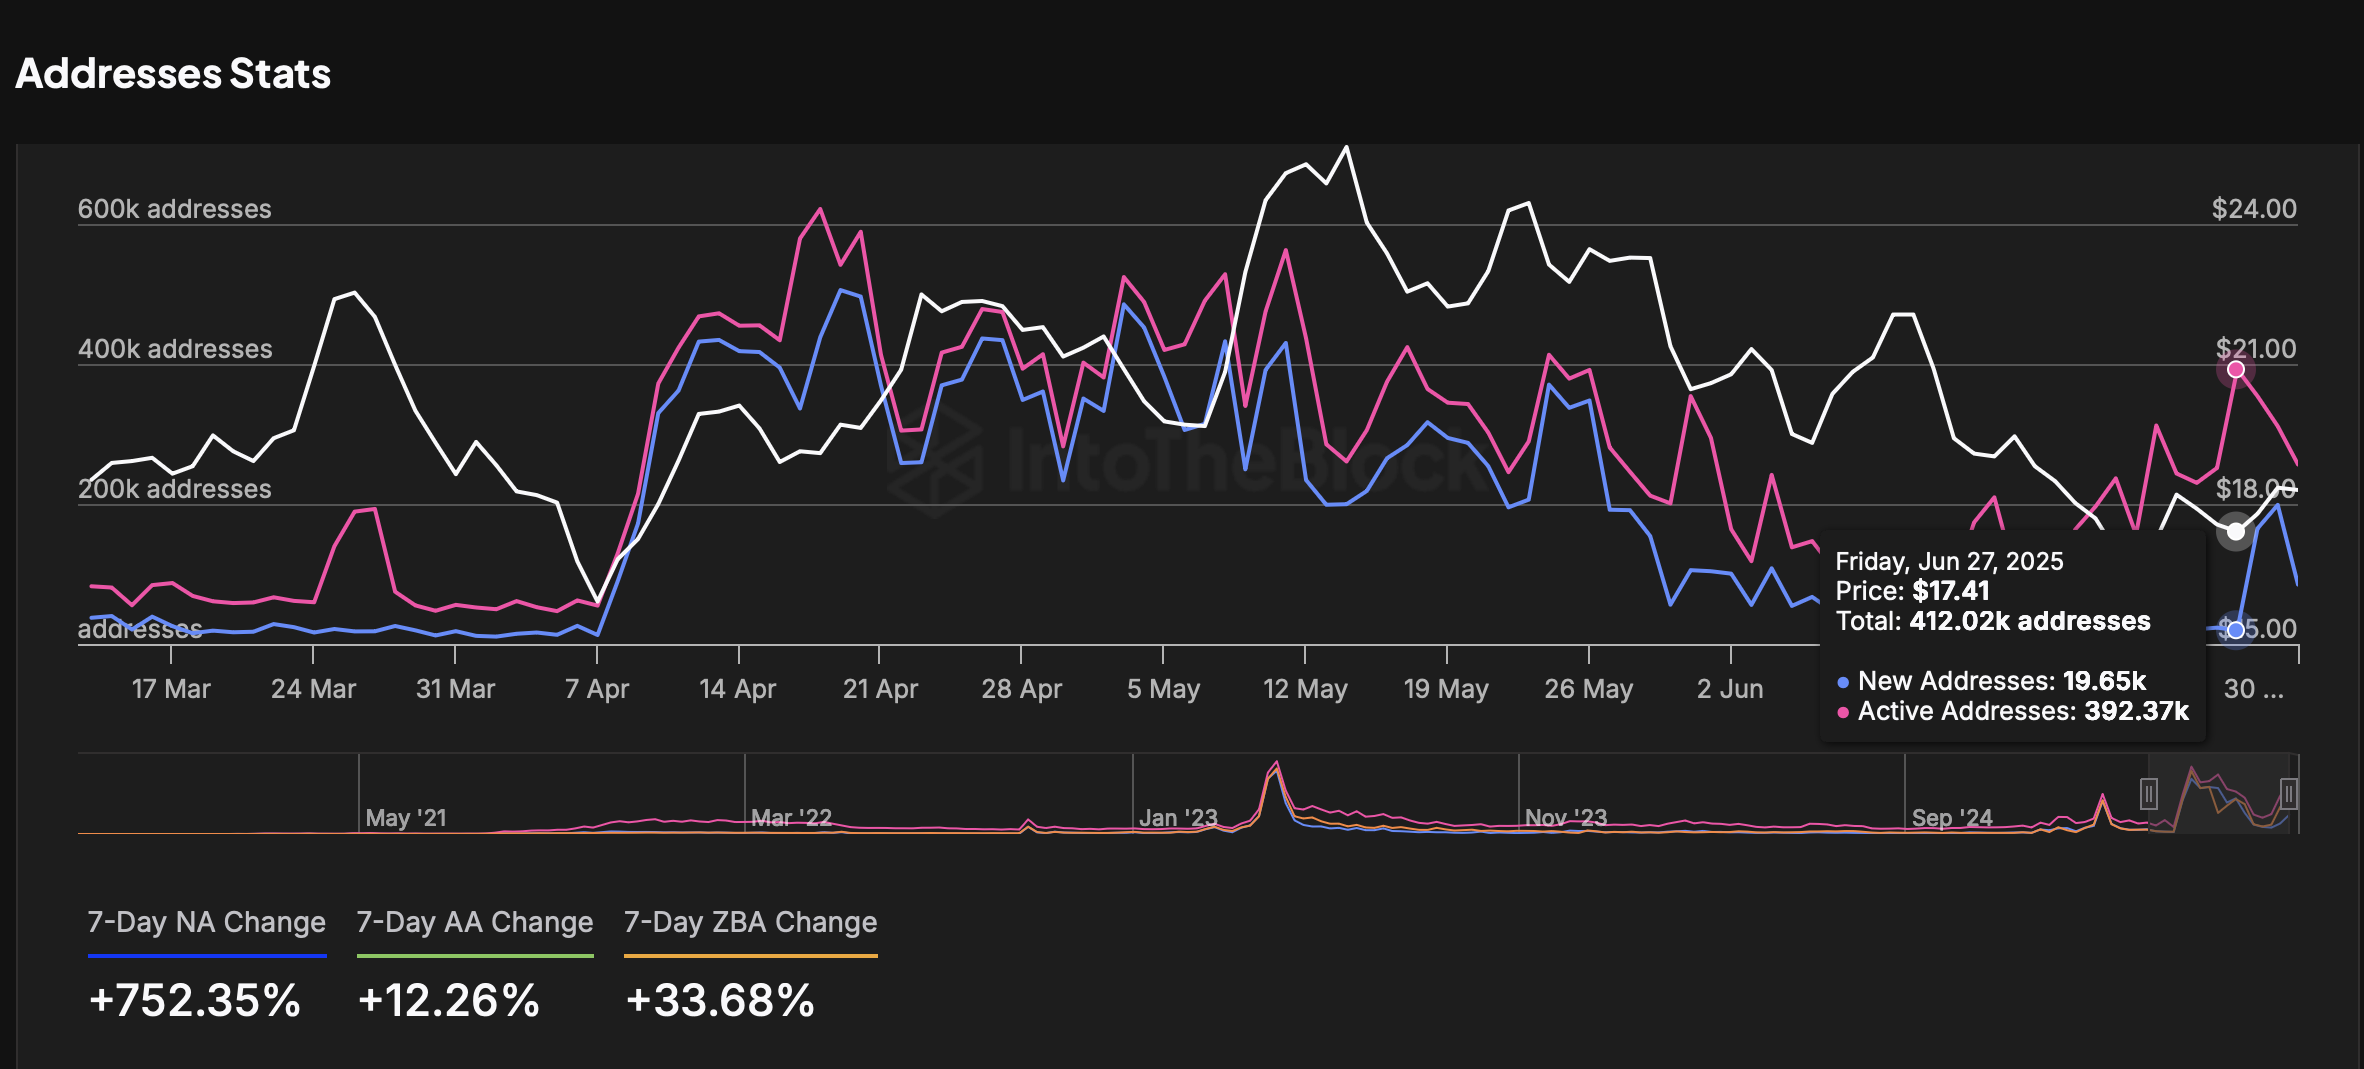
Avalanche addresses metrics | Source: IntoTheBlock
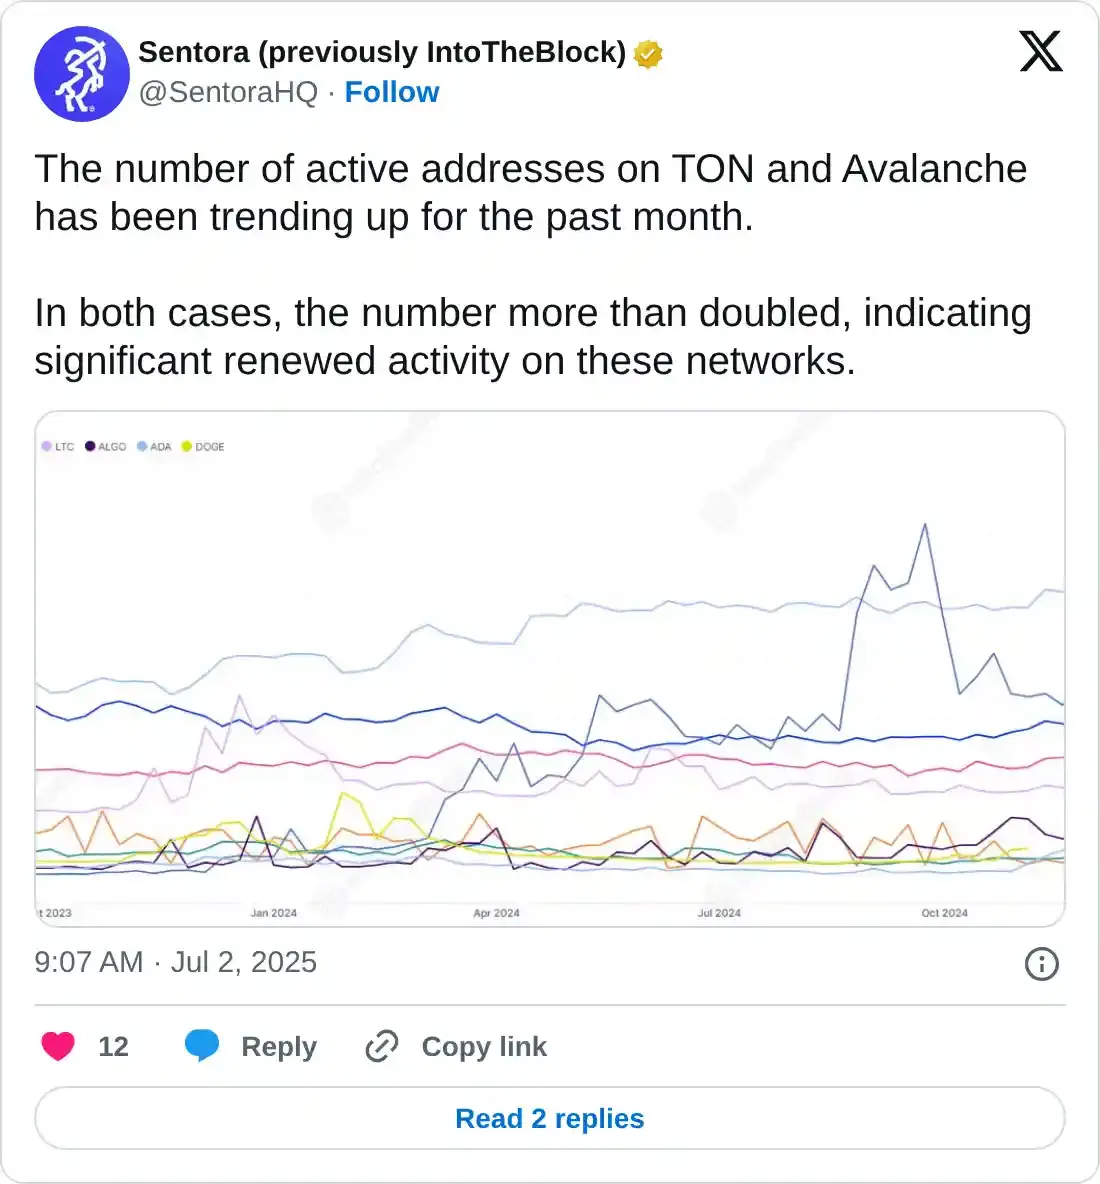
During the same month, Toncoin experienced a similar uptrend in the number of active addresses, which more than doubled, according to a post by IntoTheBlock on X.
Active addresses on TON currently stand at approximately 750,000, up from 365,000 on June 2. The number of newly created addresses on the protocol surged to about 241,000, up from roughly 133,000.
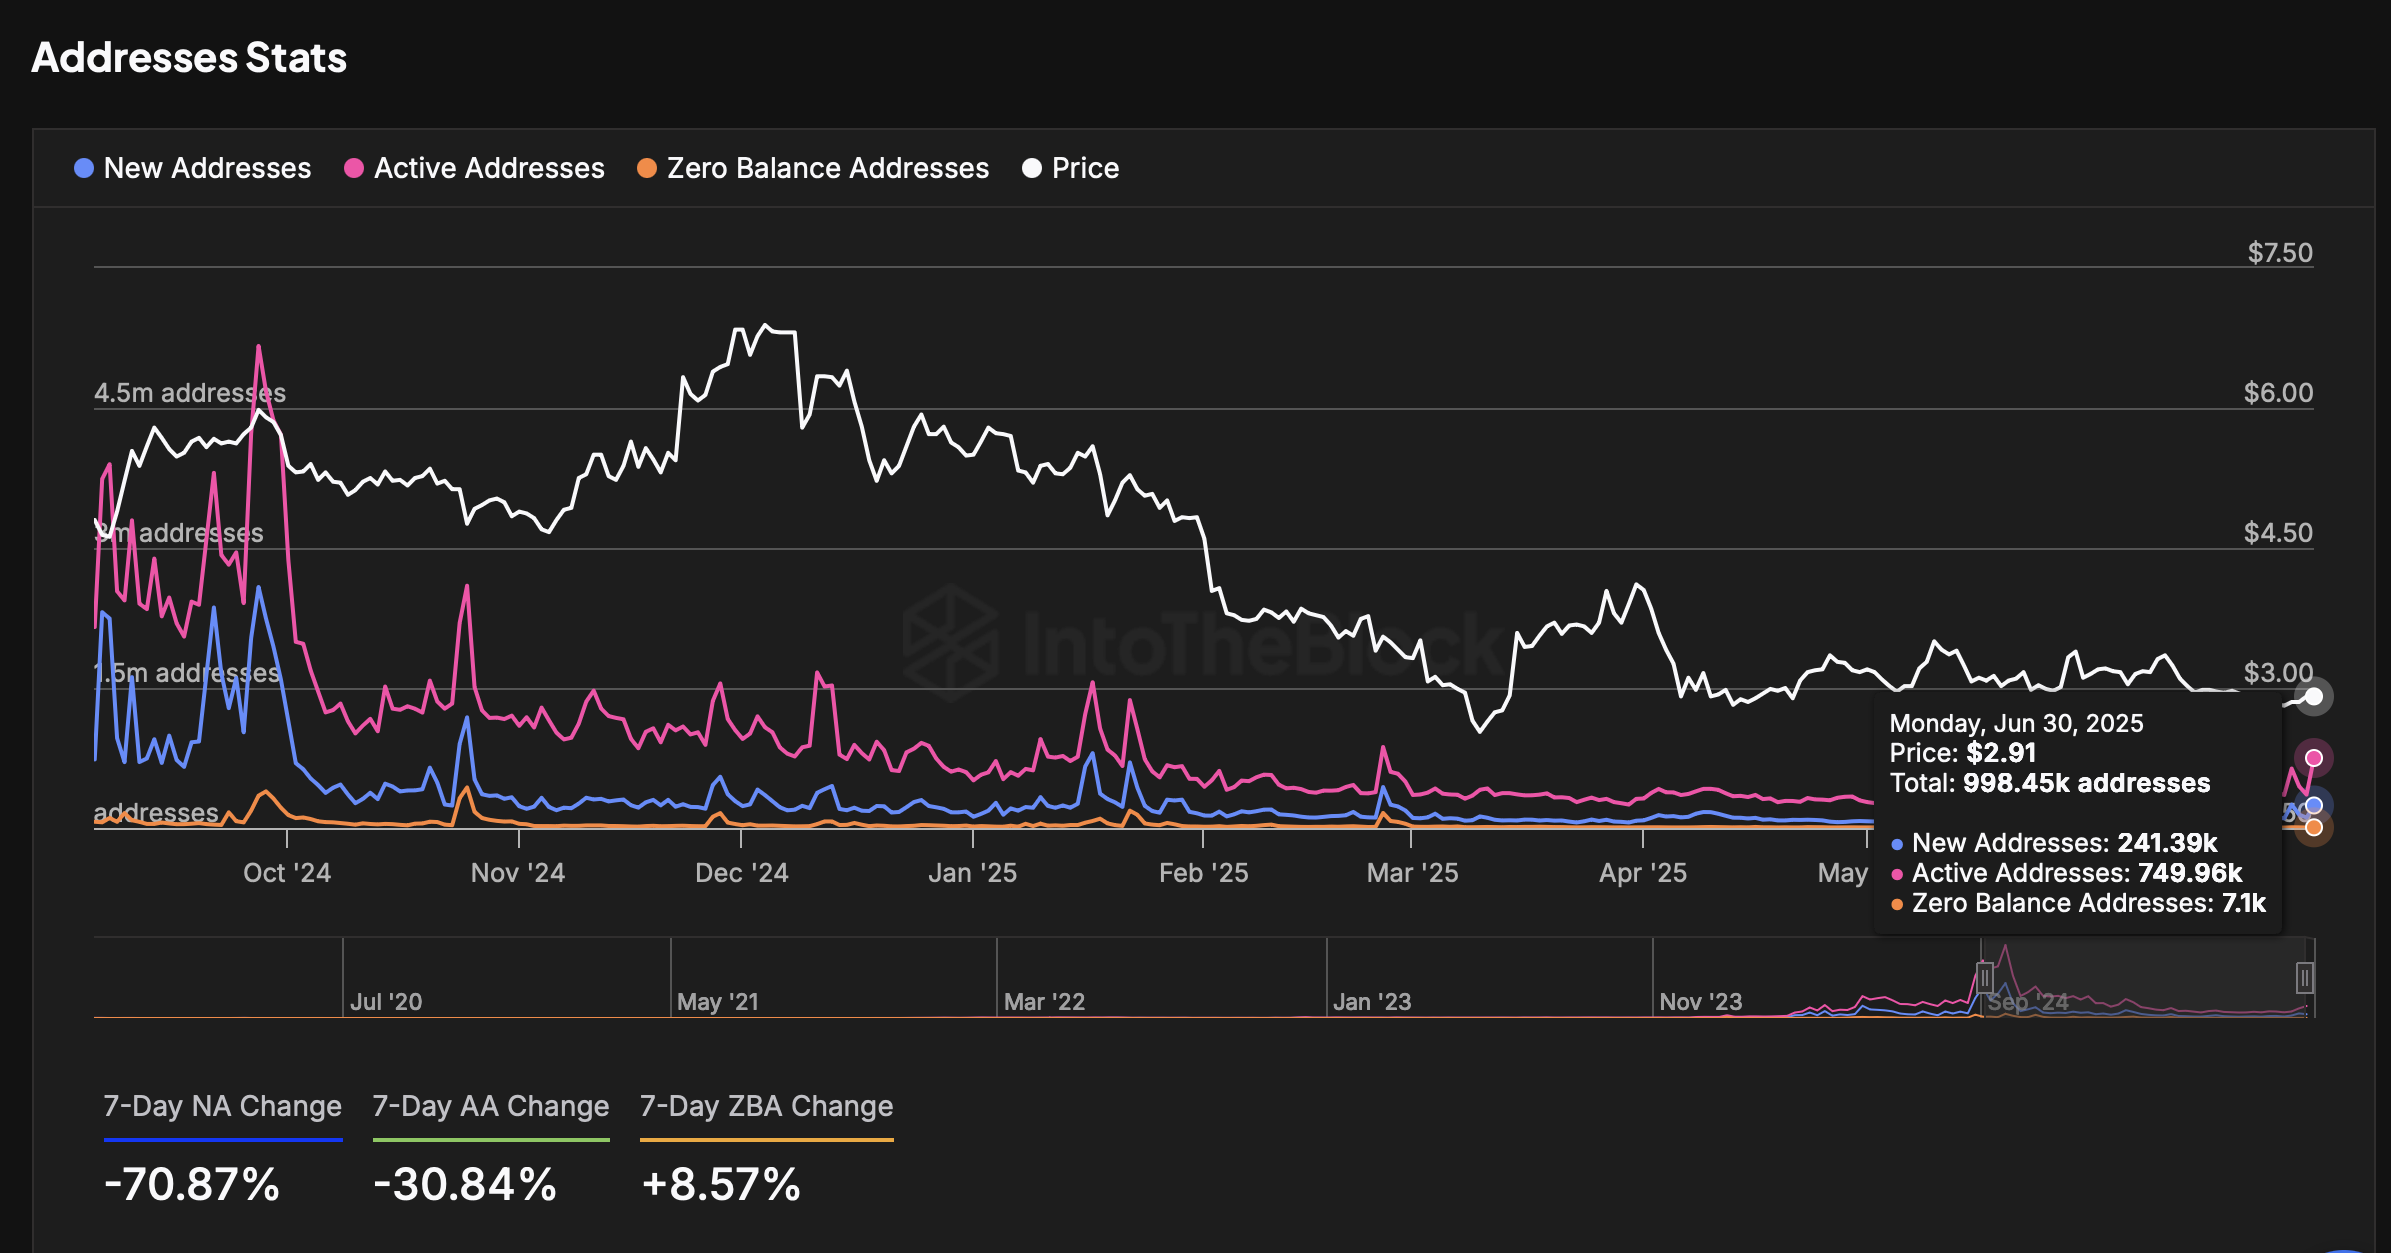
Toncoin addresses metrics | Source: IntoTheBlock
The increase in active addresses indicates growth in both user engagement and network activity. This could lead to several outcomes, including an increase in demand for the token as it is used in trading, to pay transaction fees, for staking, and even for governance.
A surge in active addresses indicates network growth, often coinciding with key developments and ecosystem expansion underpinned by the role played in Decentralised Finance (DeFi). At the same time, the uptick suggests heightened speculative sentiment as traders project future price increases.
Technical outlook: AVAX, TON signal potential bullish momentum
Avalanche is printing a green intraday candle backed by rising volume and a robust network following the surge in the number of active addresses. The Moving Average Convergence Divergence (MACD) indicator provides bullish cues, maintaining a buy signal that was confirmed on Friday.
A buy signal occurs when the blue MACD line crosses above the red signal line, indicating the presence of incoming bullish momentum. Traders often use this cue to seek exposure to the token, betting on further price increases.
A break above the immediate resistance, as highlighted by the middle boundary of the descending channel, could boost risk-on sentiment. Key areas of interest to traders include the 50-day Exponential Moving Average (EMA) resistance at $19.61, the 100-day EMA at $21.07, and the 200-day EMA, which is slightly above it at $23.74.
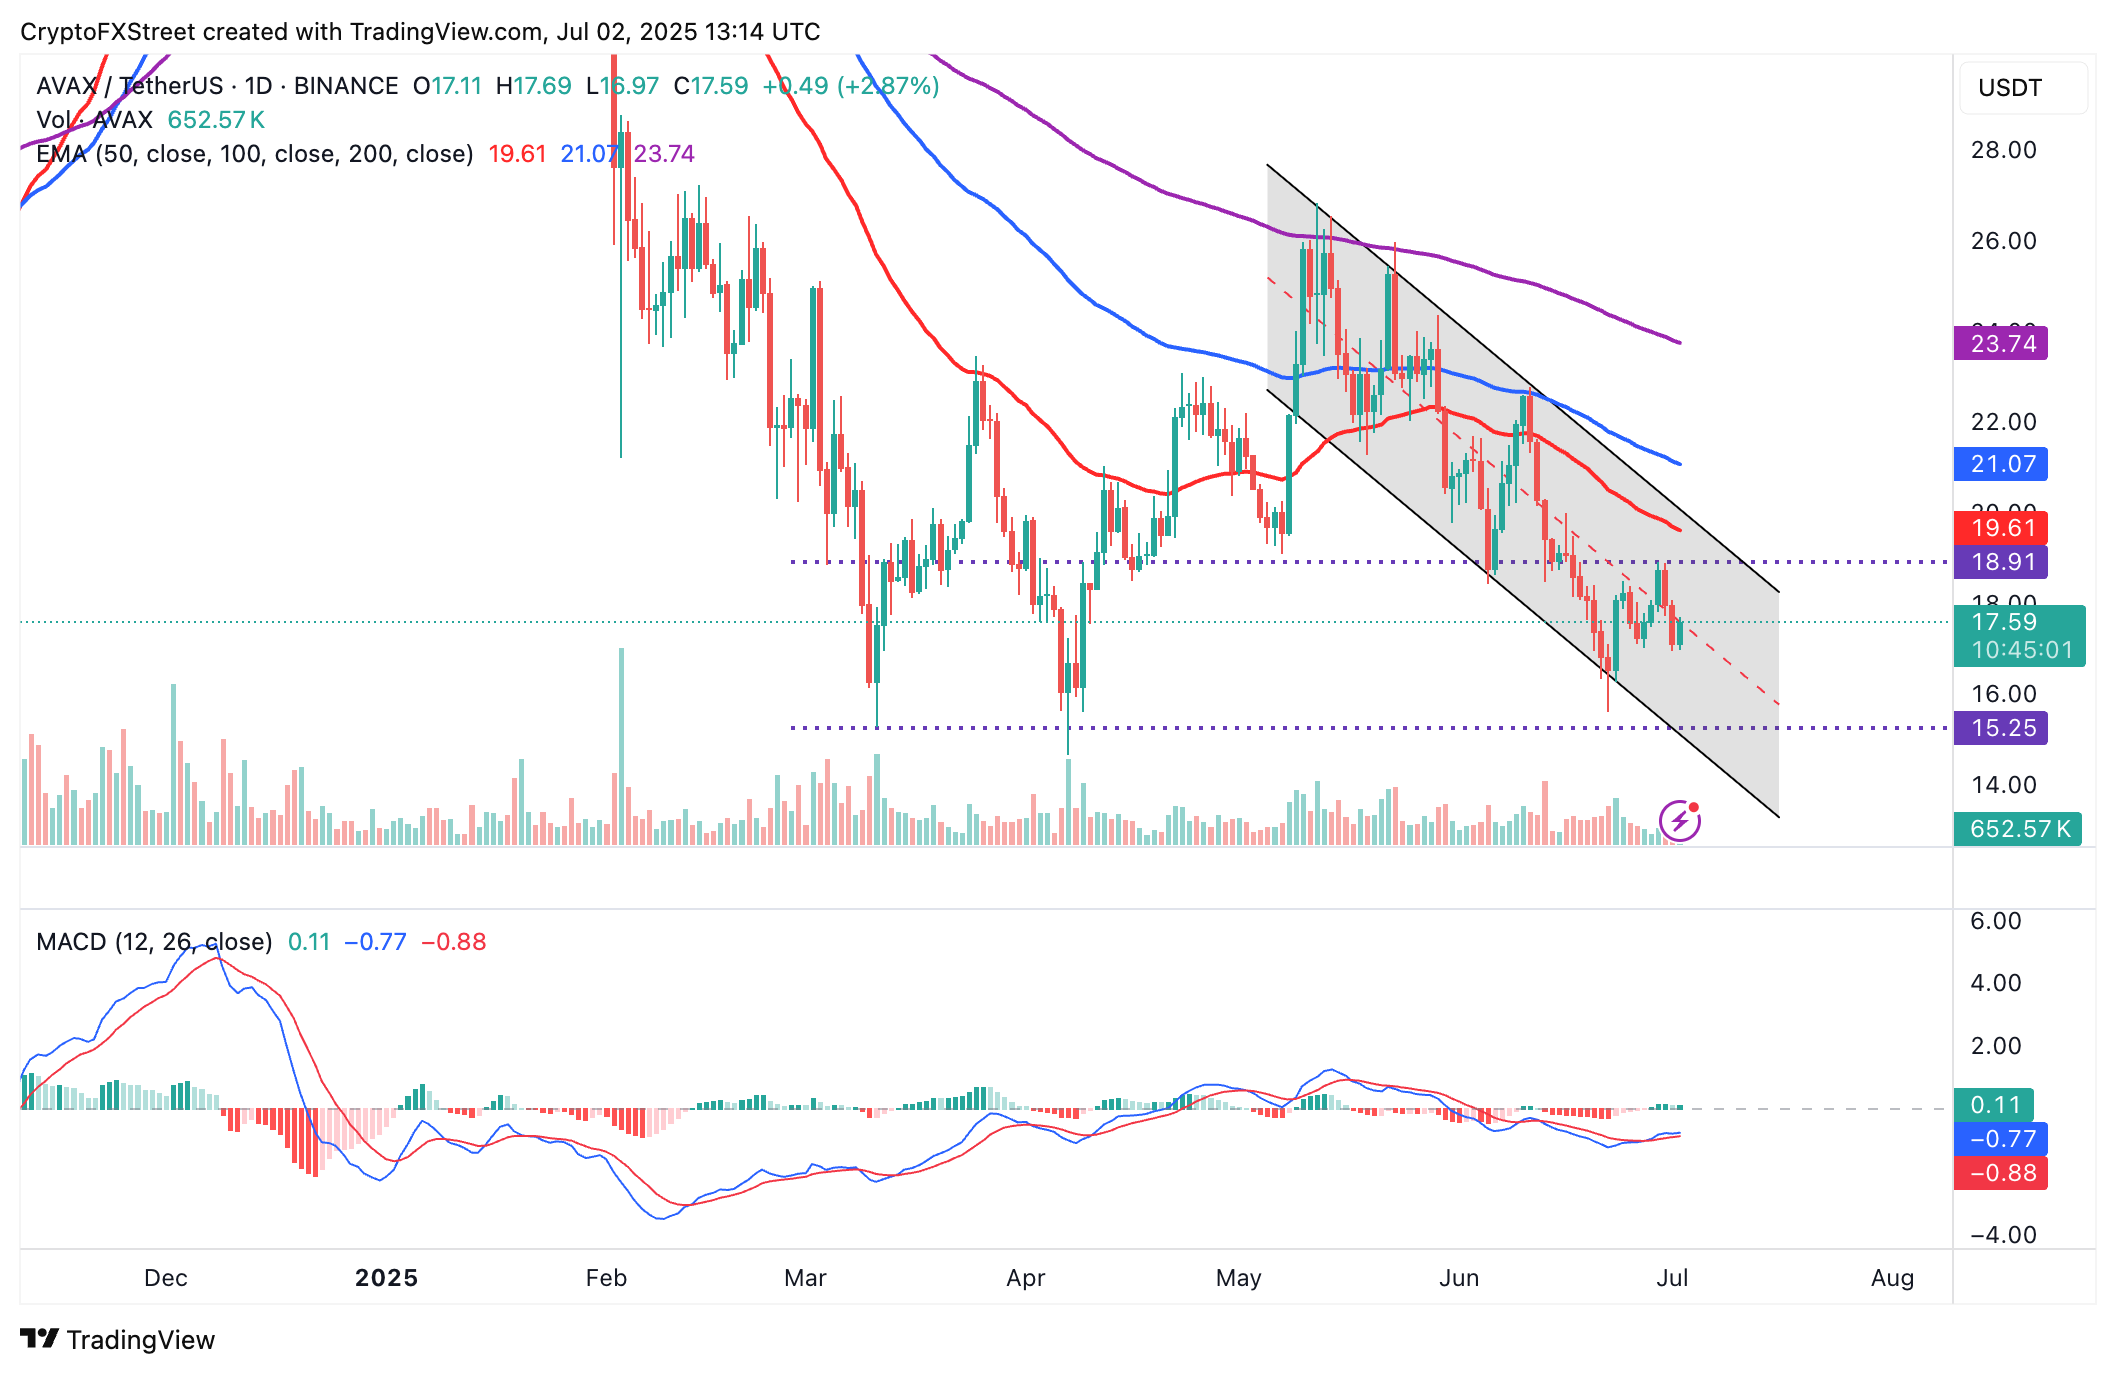
AVAX/USDT daily chart
As for Toncoin, the path of least resistance is currently upward, according to the Relative Strength Index (RSI) position at 42 and considering its reversal from lows around 32 on June 22.
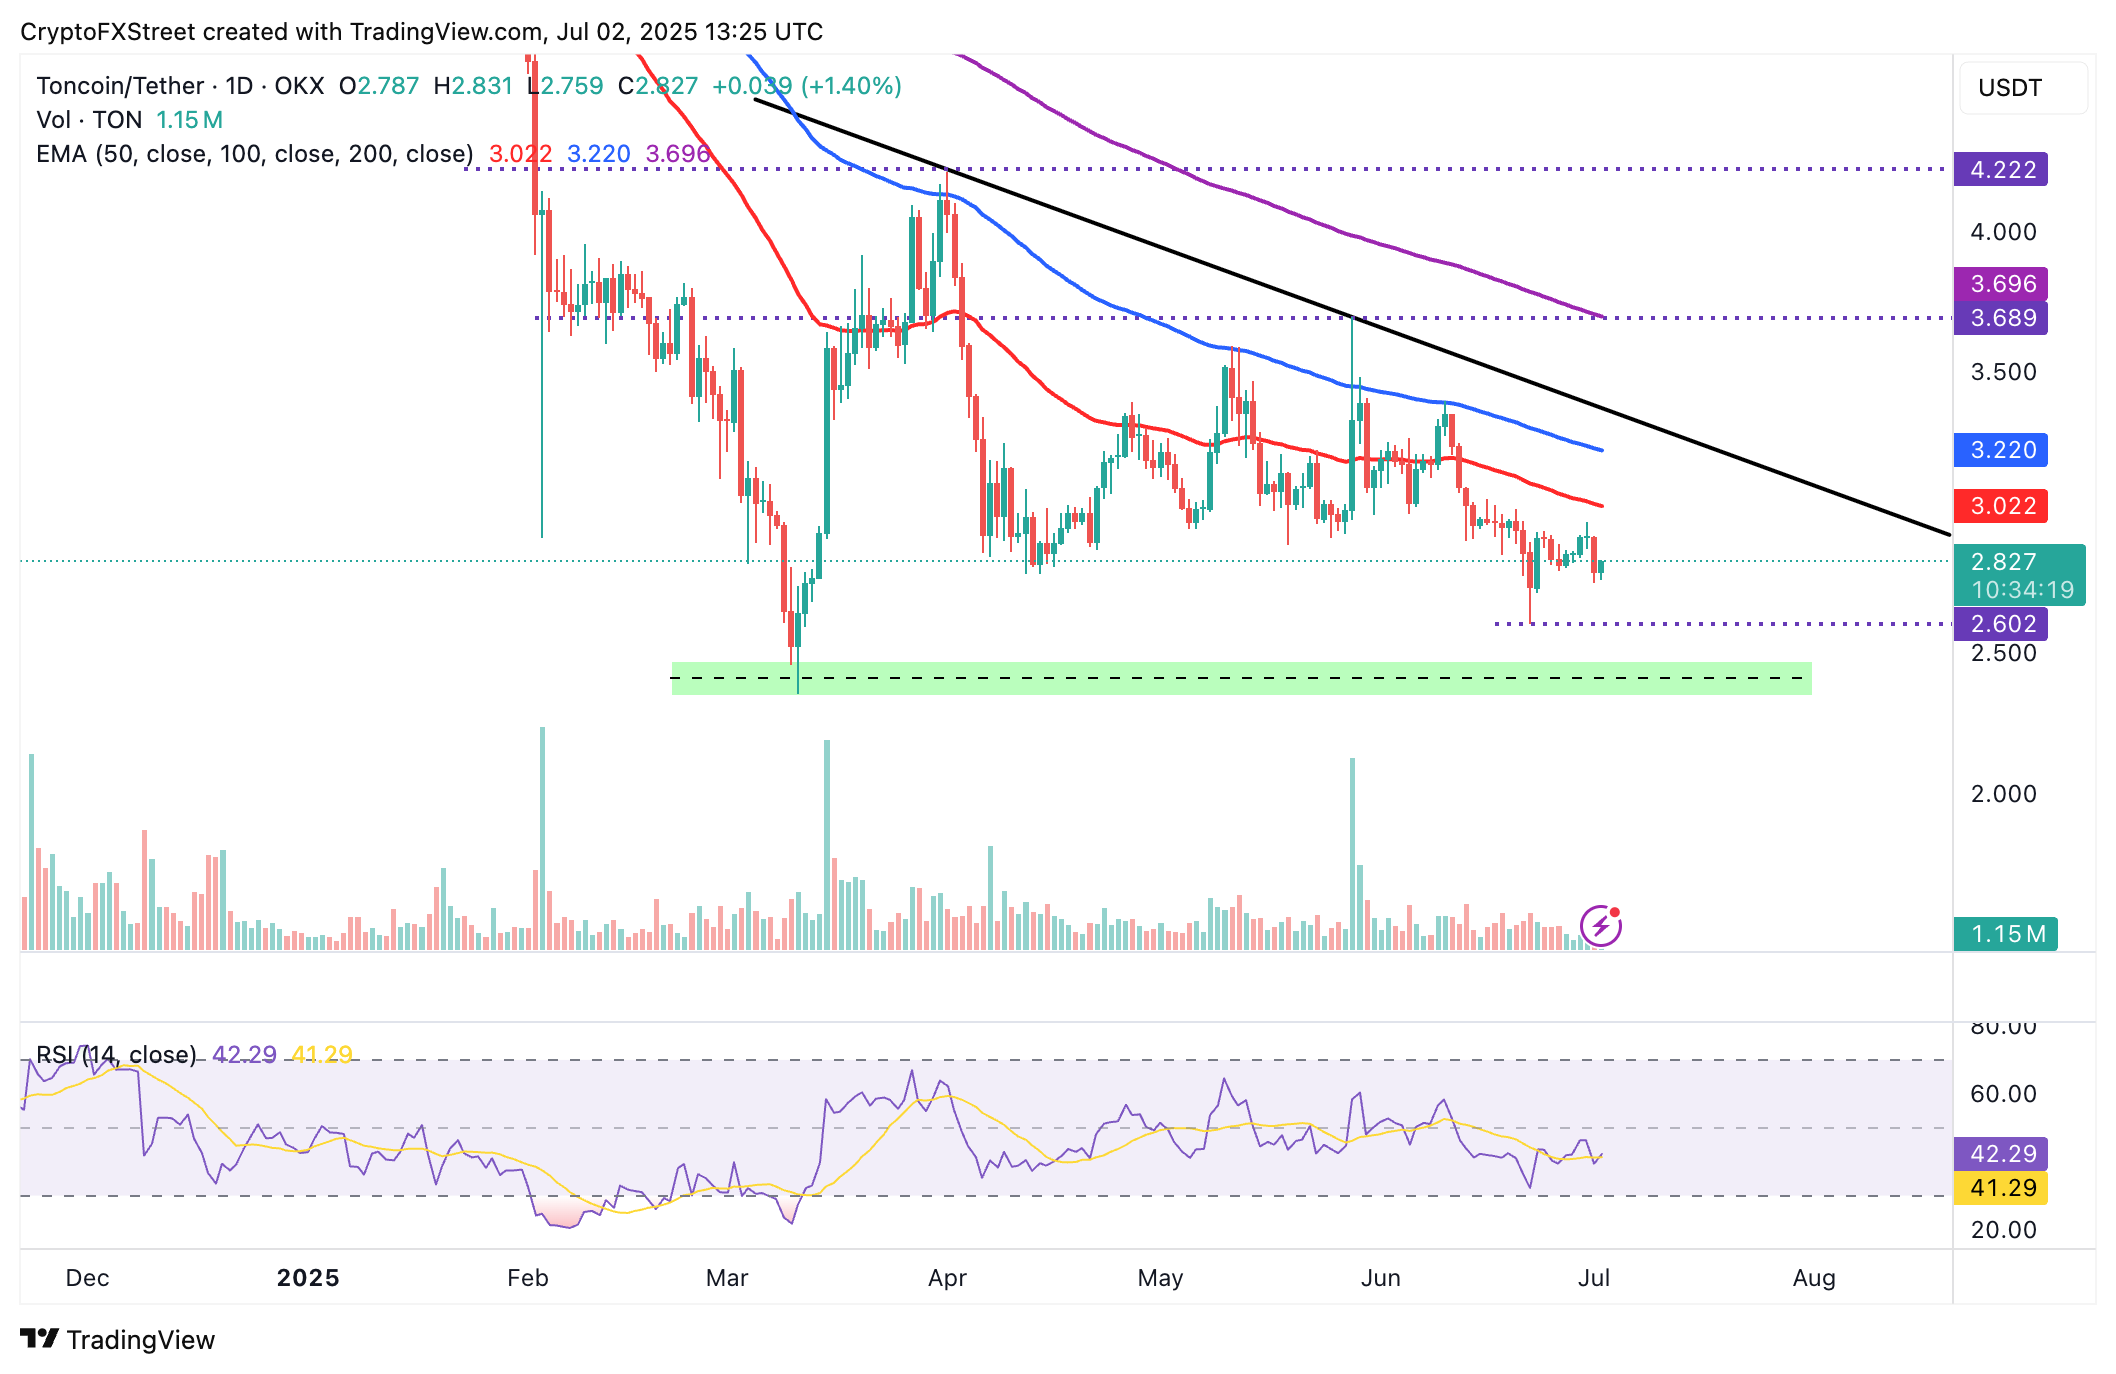
TON/USDT daily chart
Still, traders may need to temper their bullish expectations until the RSI breaks above the 50 midline. Moreover, TON is trading below key moving averages, including the 50-day EMA at $3.02, the 100-day EMA at $3.22, and the 200-day EMA at $3.69. These levels could delay the uptrend as the price rebounds. On the downside, attention could be directed to support tested at $2.60 on June 22 and $2.43 probed in March.
Cryptocurrency metrics FAQs
The developer or creator of each cryptocurrency decides on the total number of tokens that can be minted or issued. Only a certain number of these assets can be minted by mining, staking or other mechanisms. This is defined by the algorithm of the underlying blockchain technology. On the other hand, circulating supply can also be decreased via actions such as burning tokens, or mistakenly sending assets to addresses of other incompatible blockchains.
Market capitalization is the result of multiplying the circulating supply of a certain asset by the asset’s current market value.
Trading volume refers to the total number of tokens for a specific asset that has been transacted or exchanged between buyers and sellers within set trading hours, for example, 24 hours. It is used to gauge market sentiment, this metric combines all volumes on centralized exchanges and decentralized exchanges. Increasing trading volume often denotes the demand for a certain asset as more people are buying and selling the cryptocurrency.
Funding rates are a concept designed to encourage traders to take positions and ensure perpetual contract prices match spot markets. It defines a mechanism by exchanges to ensure that future prices and index prices periodic payments regularly converge. When the funding rate is positive, the price of the perpetual contract is higher than the mark price. This means traders who are bullish and have opened long positions pay traders who are in short positions. On the other hand, a negative funding rate means perpetual prices are below the mark price, and hence traders with short positions pay traders who have opened long positions.
Bài viết đề xuất


