
Weekly On-chain Report: Bitcoin trades broadly sideways amid steady activity and declining exchange reserves
- Bitcoin price continues to consolidate between support near $103,000 and around $107,500.
- Large volume holders exhibit steady interest in BTC, with 30-day active addresses holding just below 14 million.
- Bitcoin exchange reserves drop sharply to approximately $57 billion, reflecting growing investor confidence.
Bitcoin (BTC) trades sideways amid peculiar macroeconomic factors, including geopolitical tensions in the Middle East, inflation fears and tariff uncertainty in the United States (US). Despite a cautious Federal Reserve (Fed), which leaned hawkish earlier this week while leaving interest rates steady in the range of 4.25% and 4.50%, Bitcoin’s price action remains relatively elevated above support at $103,000 on Friday.
Market overview: Bitcoin consolidation extends amid rising macro uncertainty
US President Donald Trump expressed caution on Thursday when he delayed the decision regarding a potential direct attack on Iran for up to two weeks. Global markets, including crypto, responded, edging slightly higher during the Asian and European sessions as investors digested the impact of rising Crude Oil prices amid potential shipping line disruptions.
However, traders displayed striking caution, reflecting Fed Chair Jerome Powell’s hawkish stance on the economy, citing expectations of short-term inflation due to tariffs.
“Despite projections hinting at easing, Chair Powell struck a notably hawkish tone, warning of rising inflation from tariffs and saying the Fed needs to 'learn more' before acting,” a K33 Research report states.
Sideways trading could persist into the weekend, underpinned by declining interest in Bitcoin, as indicated by muted funding rates and a gradual decline in Open Interest (OI) in the derivatives market.
“Risk reversals in both BTC and ETH continue to show a preference for downside protection across June and September tenors. This suggests that long holders are actively hedging spot exposure and preparing for potential drawdowns,” QCP Capital said in Friday’s market update.
Fundamental outlook: Bitcoin holders accumulate amid macroeconomic uncertainty
Bitcoin’s large volume holders continue to accumulate despite the cautious approach exhibited by traders in spot and derivatives arenas.
Santiment’s Supply Distribution metric shows that key whale cohorts, particularly those holding between 100 and 1,000 BTC, have a remarkable risk appetite for BTC. Related addresses highlighted by the red line on the chart below currently account for almost 24% of Bitcoin’s total supply, up from 23% on April 1 and 22.5% on January 1. This steady accumulation rate reflects persistent net inflows into Bitcoin spot Exchange Traded Funds (ETFs), which reached a total cumulative net inflow of $47 billion on Thursday.
 [18-1750438184441.12.49, 20 Jun, 2025].png)
Bitcoin Supply Distribution metric | Source: Santiment
Bitcoin’s stability can also be attributed to steady on-chain activity, backed by a marginal but critical increase in 30-day active addresses.
Based on Santiment’s Active Addresses metric shown below, the number of active addresses, tracked on a 30-day basis, holds just below 14 million. These are the addresses interacting with the protocol by sending and receiving BTC.
A consistent increase in this metric indicates a surge in demand for Bitcoin, which often translates to bullish momentum and tends to have a positive impact on the price.
 [18-1750438203341.20.32, 20 Jun, 2025].png)
Bitcoin Active Addresses metric | Source: Santiment
CryptoQuant sheds light on the state of Bitcoin’s exchange balance, which has declined sharply to nearly $57 billion, as shown in the Exchange Reserve chart below. As the value extends the drop following the peak of around $64 billion on May 22, it indicates a potential reduction in selling pressure. Investors often transfer Bitcoin from exchanges to self-custody storage, indicating a preference for long-term holding and reflecting confidence in Bitcoin’s future performance.
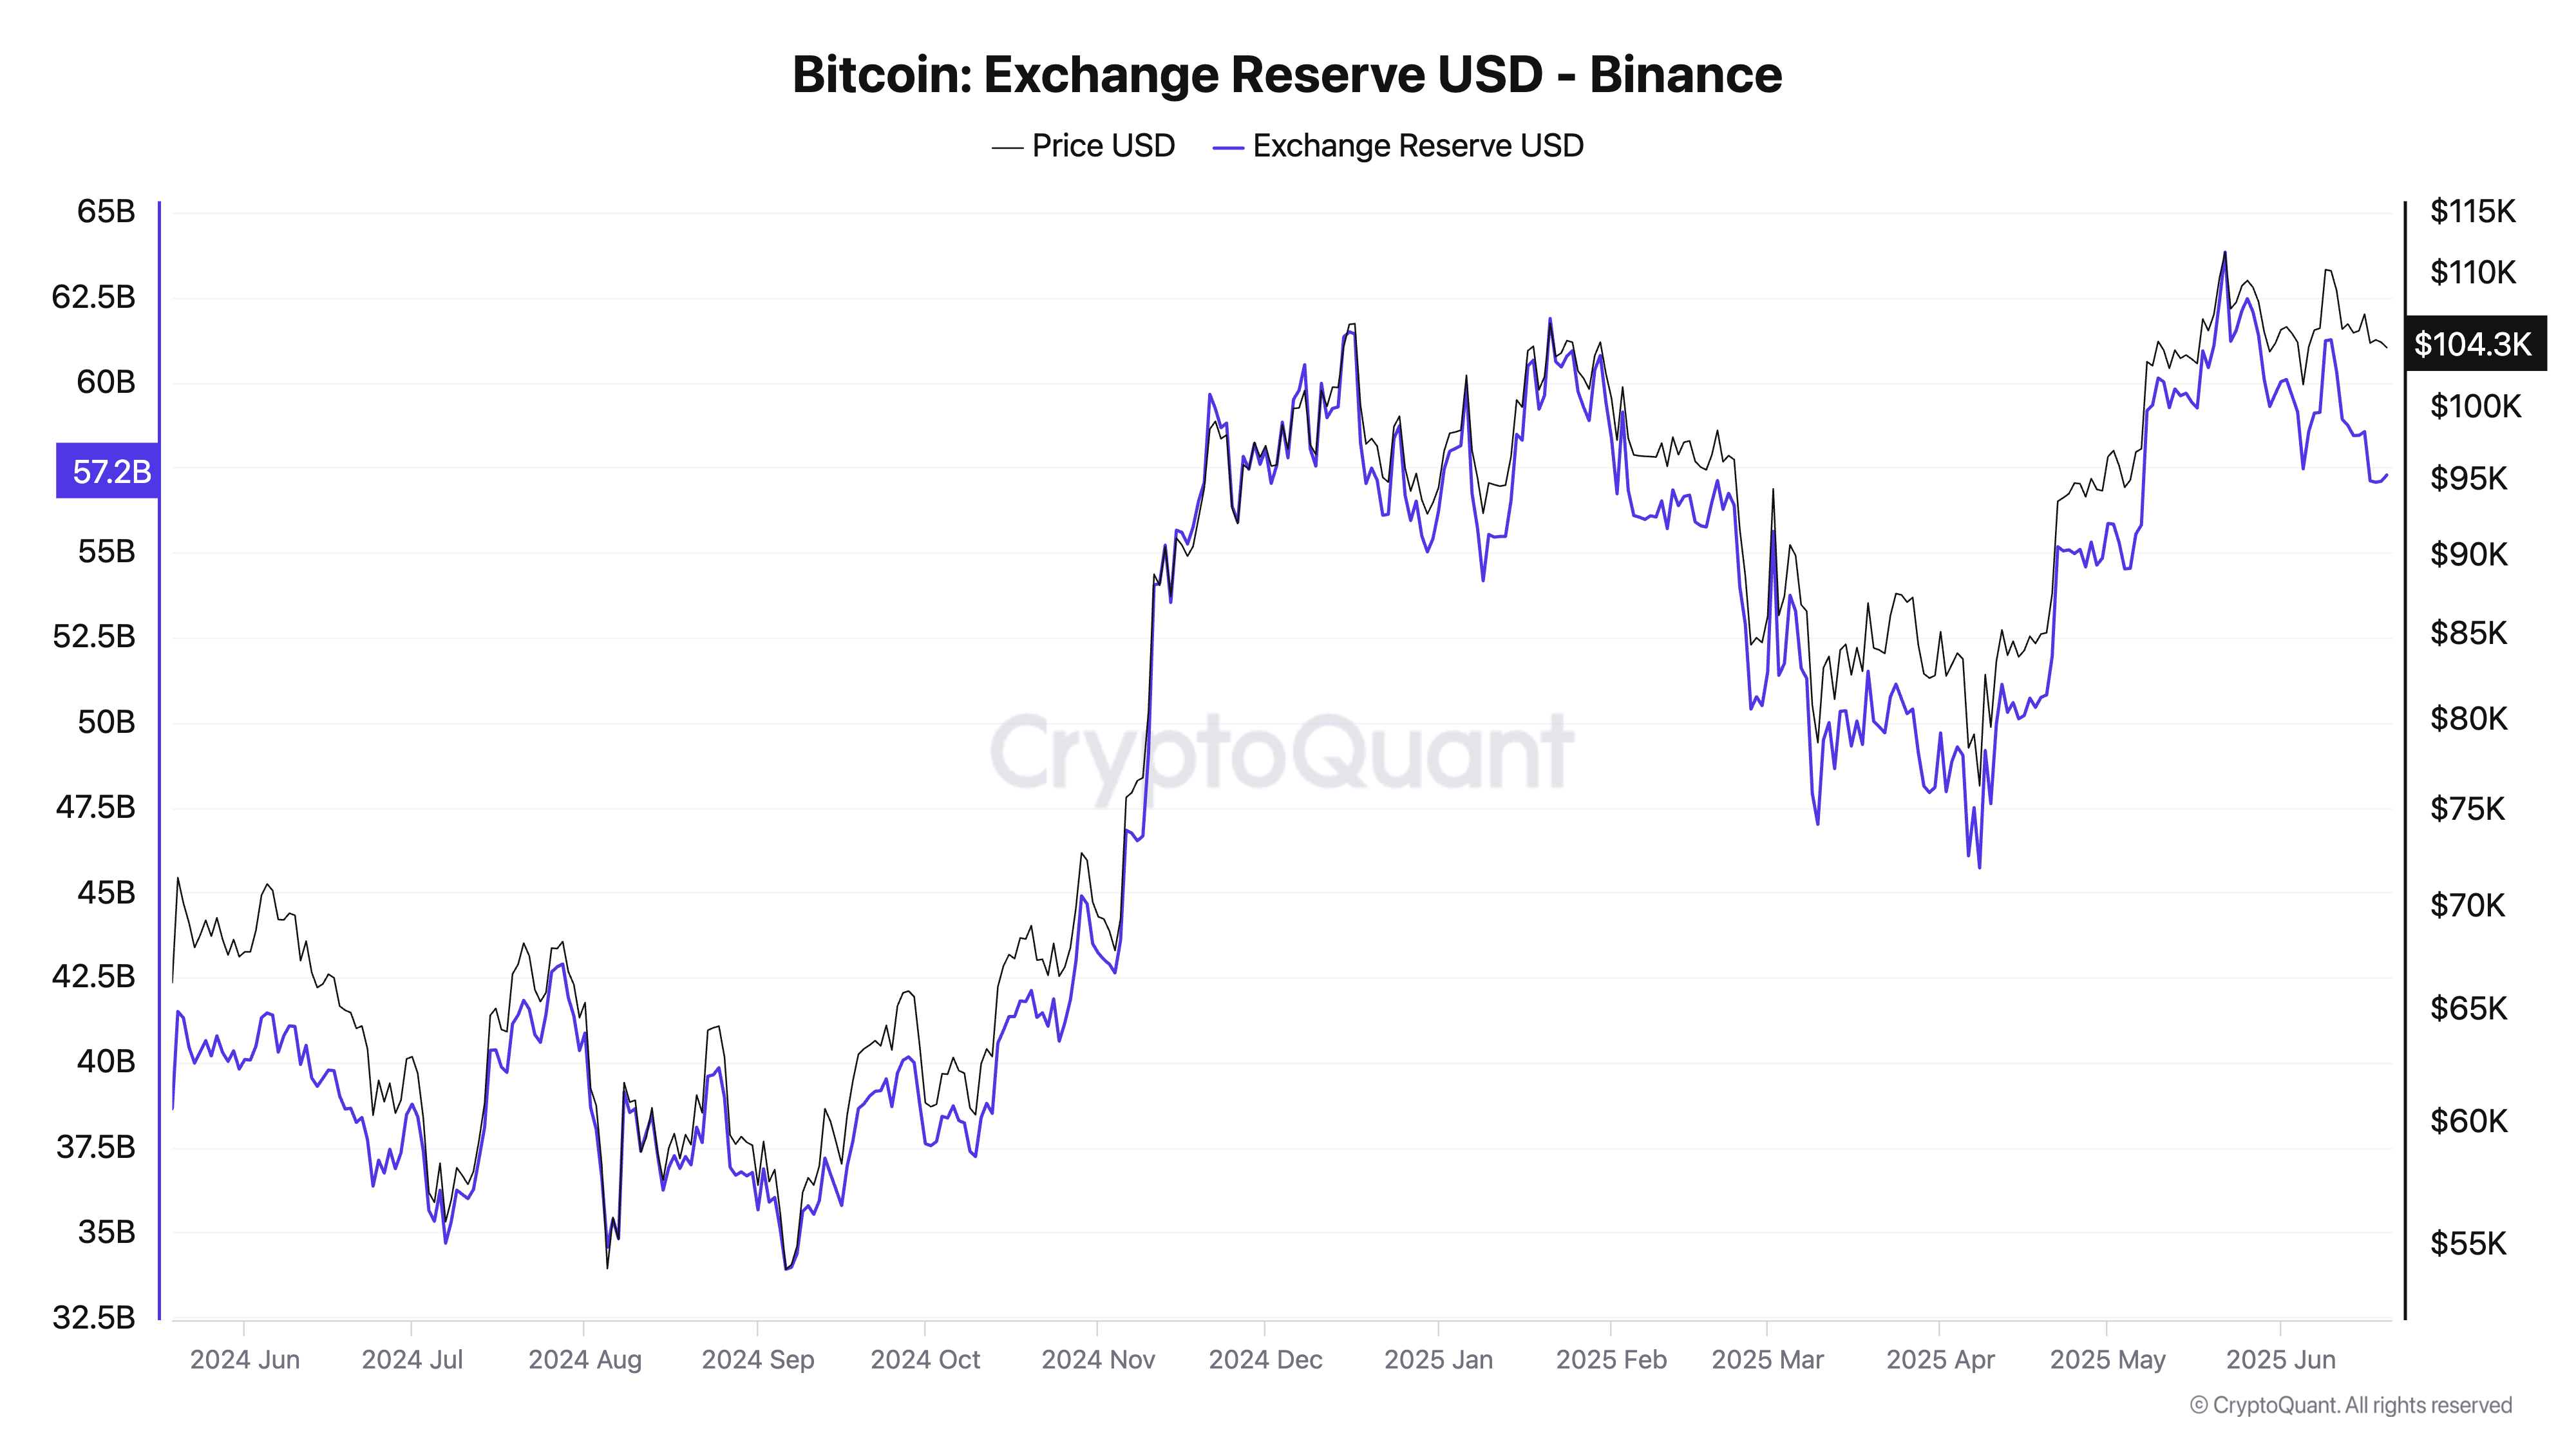
Bitcoin Exchange Reserves metric | Source: CryptoQuant
Technical outlook: Bitcoin’s 50-day EMA critical to support
Bitcoin’s price hovers at around $104,057 after trimming intraday gains from the Friday peak of $106,457. Key technical indicators, such as the Relative Strength Index (RSI), underpin the bearish bias as it slips below the 50 midline.
The Money Flow Index (MFI) indicator, which tracks the amount of money entering BTC, cut short the uptrend, steadying around the midline. This mirrors subdued interest in Bitcoin both in spot and derivatives markets.
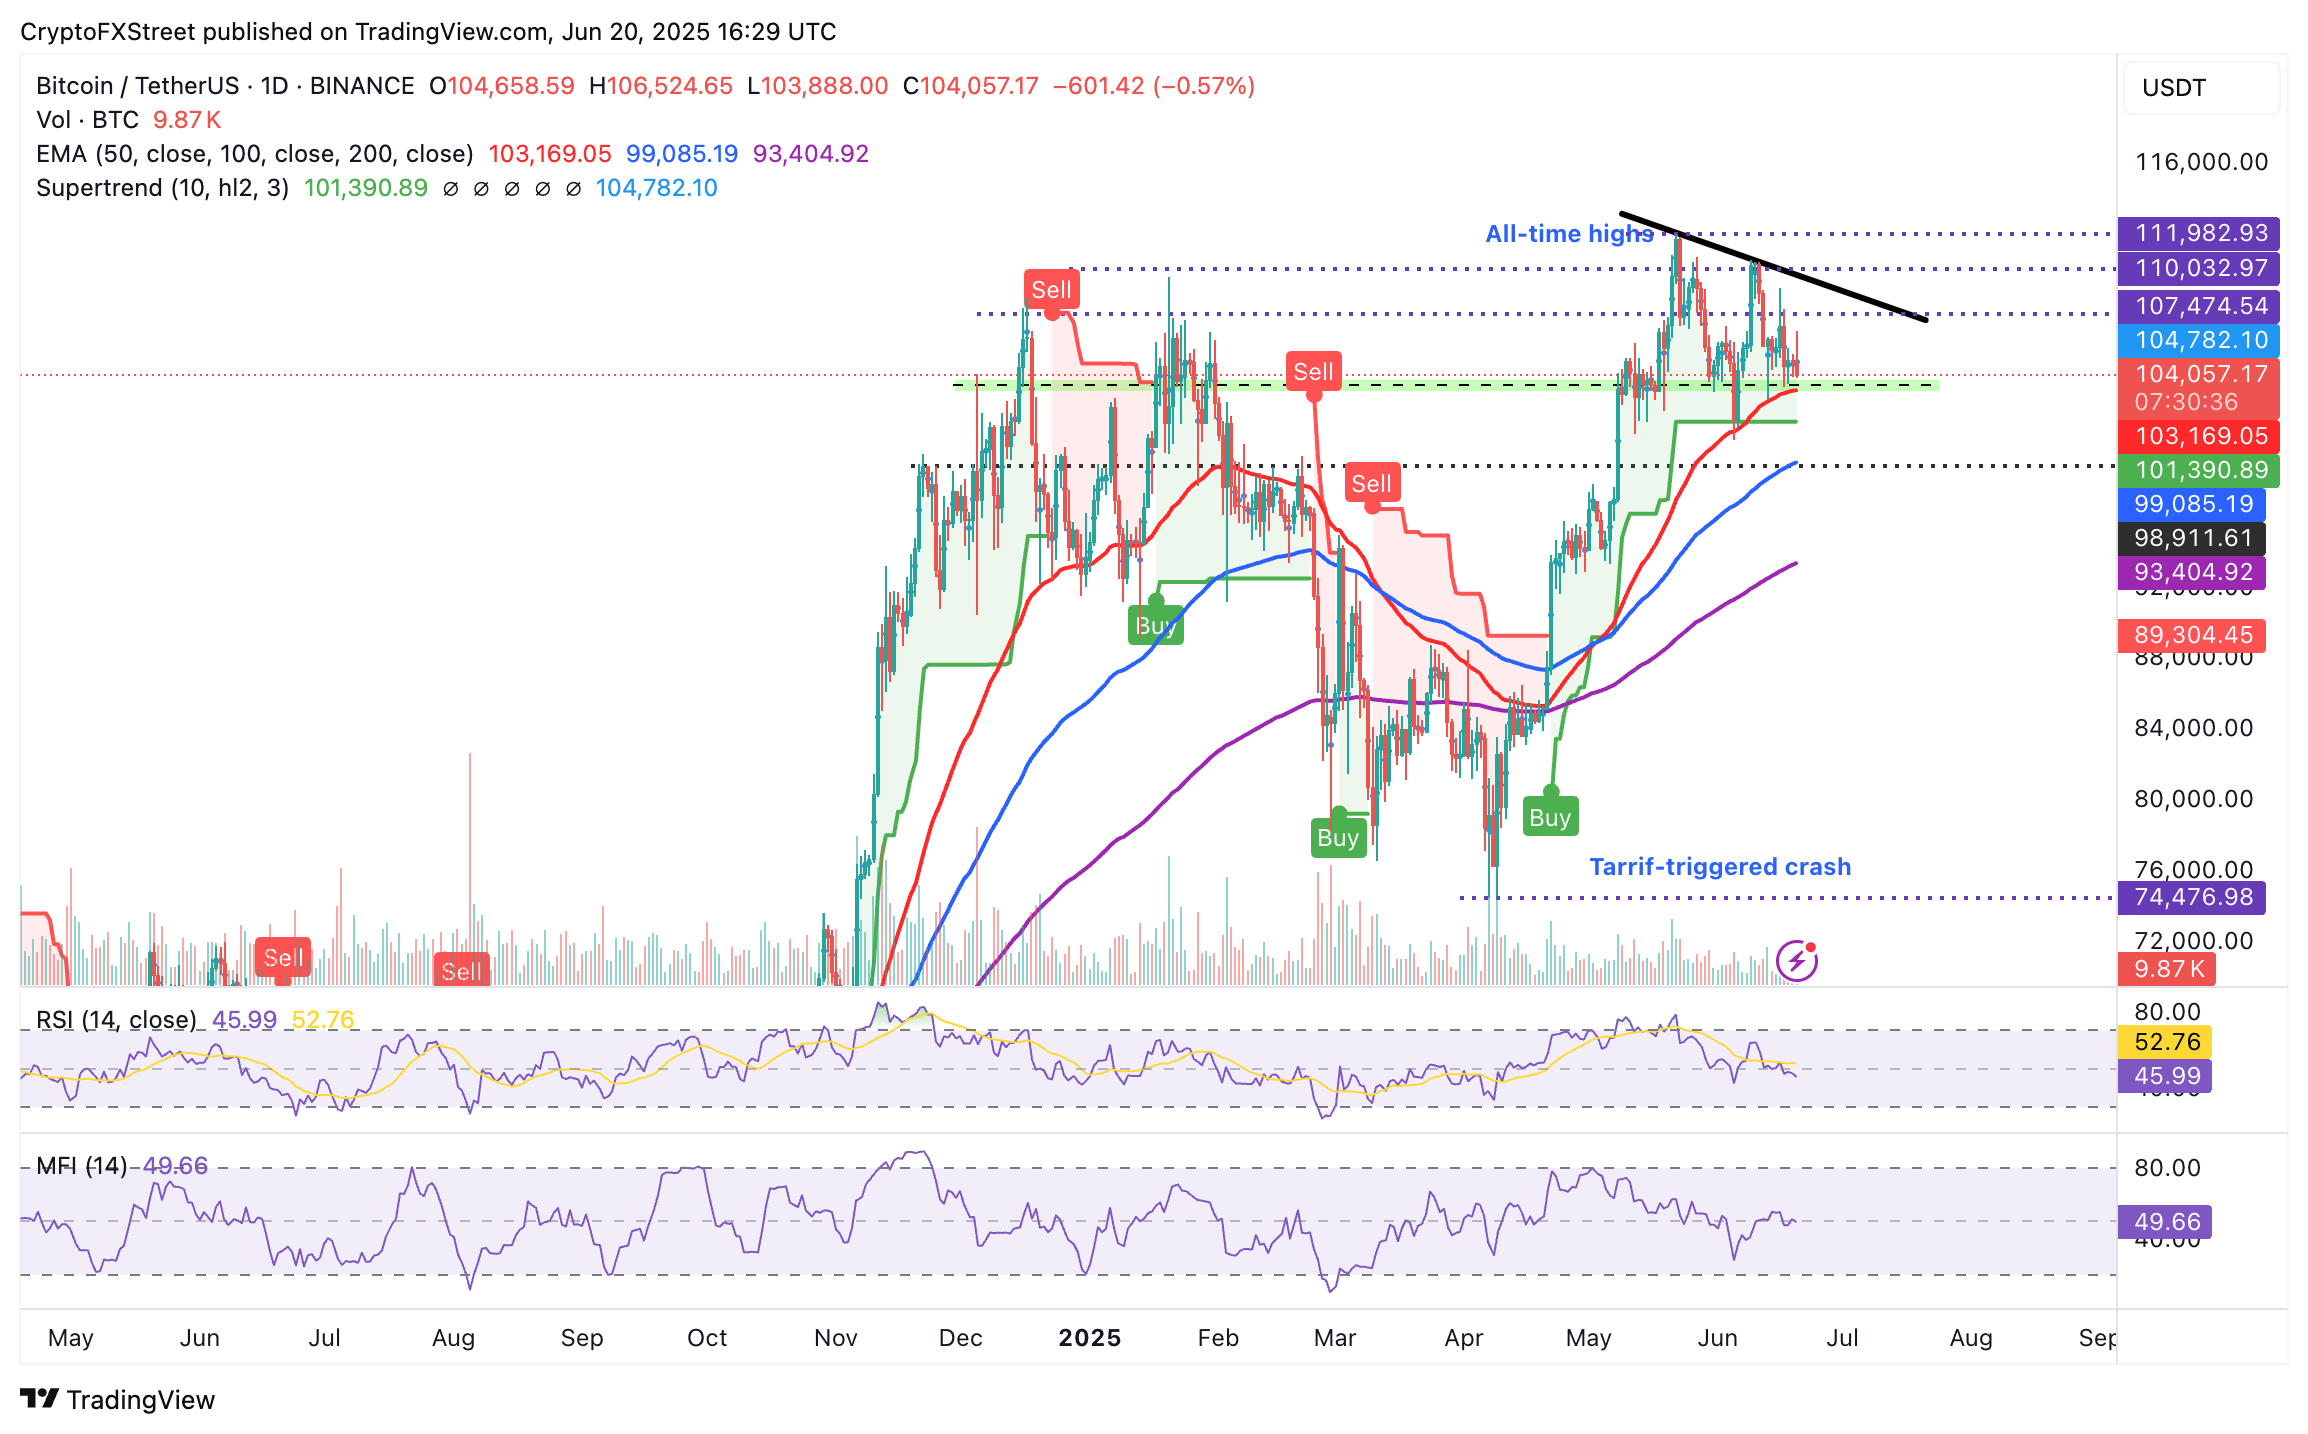
BTC/USD daily chart
Should BTC’s downside vulnerability overshadow on-chain demand and network activity, the 50-day Exponential Moving Average (EMA) support at $103,169 could come in handy, tentatively absorbing the sell-side pressure. Beyond this level, high volatility could accelerate the decline, bringing key levels, such as the 100-day EMA at $99,085 and the 200-day EMA at $93,404, into play.
Open Interest, funding rate FAQs
Higher Open Interest is associated with higher liquidity and new capital inflow to the market. This is considered the equivalent of increase in efficiency and the ongoing trend continues. When Open Interest decreases, it is considered a sign of liquidation in the market, investors are leaving and the overall demand for an asset is on a decline, fueling a bearish sentiment among investors.
Funding fees bridge the difference between spot prices and prices of futures contracts of an asset by increasing liquidation risks faced by traders. A consistently high and positive funding rate implies there is a bullish sentiment among market participants and there is an expectation of a price hike. A consistently negative funding rate for an asset implies a bearish sentiment, indicating that traders expect the cryptocurrency’s price to fall and a bearish trend reversal is likely to occur.
Bài viết đề xuất


