Stellar and ApeCoin Price Prediction: XLM and APE at risk of further losses as technical weakness grows

Nguồn Fxstreet
  • Stellar price closes below its critical support at $0.2537, hinting at a correction ahead.
  • ApeCoin touches the lower boundary of an ascending triangle formation, a breakdown would signal a downtrend.
  • Momentum indicators for both altcoins show weakness, further supporting the bearish thesis.

Stellar (XLM) and ApeCoin (APE) are showing signs of weakness as both altcoins struggle to hold above key support levels. XLM slips below its crucial support at $0.2537, raising the risk of a deeper correction. Meanwhile, APE is breaking below the lower boundary of an ascending triangle formation, a breakdown would signal a downtrend. Momentum indicators for both tokens are weakening, suggesting that bearish momentum is gaining traction and hinting at a downleg ahead.

Stellar Price Prediction: XLM is poised for a downleg as it closed below key support 

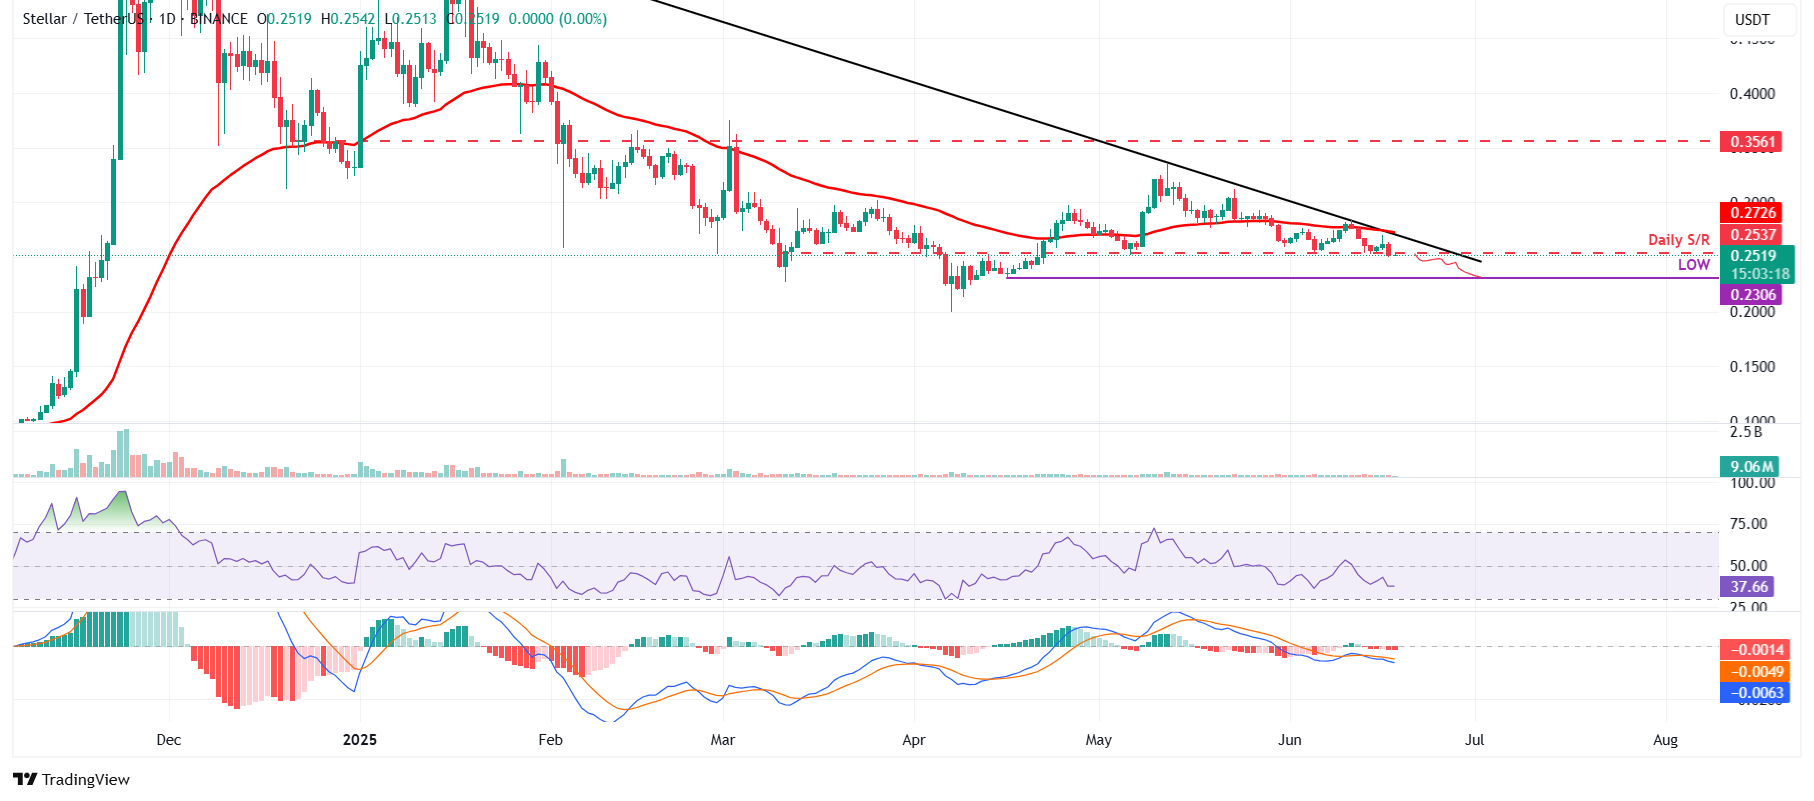
Stellar price failed to close above the descending trendline on June 11 and declined by nearly 8% over the next three days, finding a cushion at the daily support level of $0.2537 over the weekend. However, XLM closed below this support level on Tuesday. At the time of writing on Wednesday, it trades at $0.2519, below the key support.

If XLM continues its correction, it could extend the decline to retest the April 16 low of $0.2306.

The Relative Strength Index (RSI) on the daily chart reads 37, indicating strong bearish momentum and approaching oversold conditions. Additionally, the Moving Average Convergence Divergence (MACD) indicator on the daily chart displayed a bearish crossover last week. It also shows rising red histogram bars below its neutral level, indicating bearish momentum and suggesting a downward trend.
XLM/USDT daily chart

XLM/USDT daily chart

However, if XLM recovers, it could extend toward the 50-day Exponential Moving Average (EMA) at $0.2726.

ApeCoin Price Prediction: APE on the verge of a breakdown 

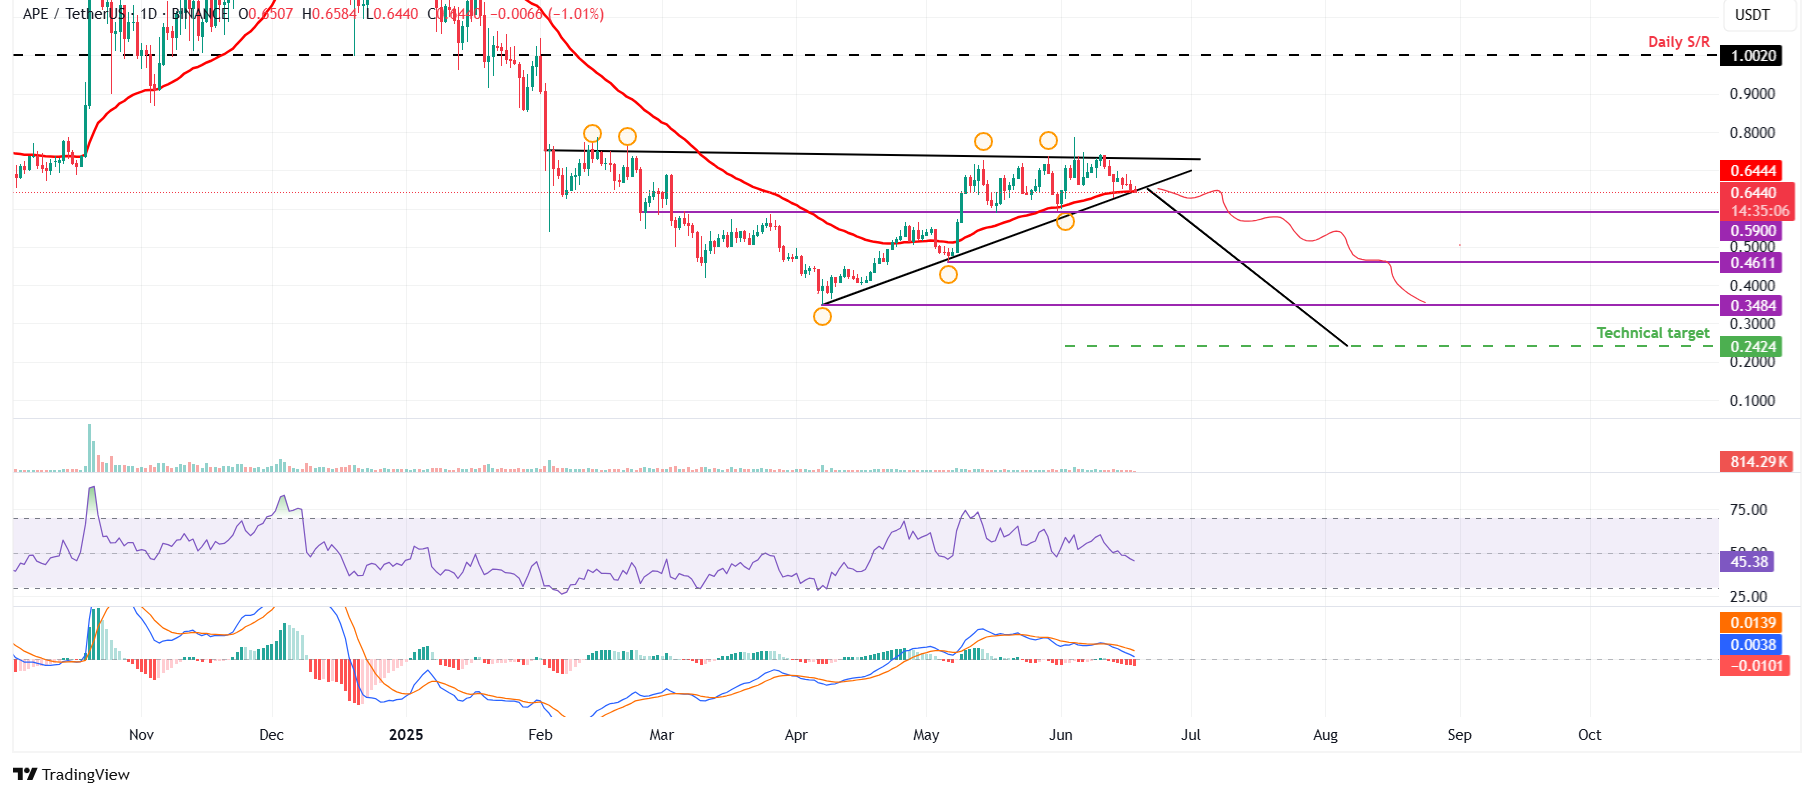
ApeCoin price has produced multiple higher lows and roughly equal highs since early February. Connecting these swing points using a trend line reveals an ascending triangle formation in the daily chart. The breakdown of this pattern supports a bearish bias, and the target is typically determined by measuring the distance between the first swing high and the first swing low to the breakdown point. At the time of writing on Wednesday, APE is nearly its lower boundary of this chart pattern, around $0.64.

If APE breaks below the lower boundary of this pattern at around $0.64, it could extend the rally toward its technical target of $0.24. Investors should be cautious of this theoretical move, as any downside move could encounter support around key levels, such as $0.59, $0.46 and $0.34, where traders could book some profits.

The RSI on the daily chart reads 45, below its neutral level of 50, indicating increasing bearish momentum. Moreover, the MACD indicator also displayed a bearish crossover last week. It also shows rising red histogram bars below its neutral level, indicating bearish momentum and suggesting a downward trend.
APE/USDT daily chart

APE/USDT daily chart

However, if APE recovers, it could extend the recovery toward its upper boundary of the pattern around $0.72.

Tuyên bố miễn trừ trách nhiệm: Chỉ dành cho mục đích thông tin. Hiệu suất trong quá khứ không đảm bảo cho kết quả trong tương lai.
placeholder
WTI tăng lên mức 73,50$ khi Trump kêu gọi Iran đầu hàng vô điều kiệnWest Texas Intermediate (WTI), chuẩn dầu thô của Mỹ, đang giao dịch quanh mức 73,55$ trong giờ giao dịch châu Á vào thứ Tư. Giá WTI kéo dài đà tăng khi căng thẳng ở Trung Đông leo thang và khả năng Hoa Kỳ (US) tham gia vào cuộc xung đột gia tăng.
Tác giả  FXStreet
14 giờ trước
West Texas Intermediate (WTI), chuẩn dầu thô của Mỹ, đang giao dịch quanh mức 73,55$ trong giờ giao dịch châu Á vào thứ Tư. Giá WTI kéo dài đà tăng khi căng thẳng ở Trung Đông leo thang và khả năng Hoa Kỳ (US) tham gia vào cuộc xung đột gia tăng.
placeholder
WTI kéo dài đà tăng trên mức 70,50$ trước thềm công bố Doanh số bán lẻ của MỹWest Texas Intermediate (WTI), chuẩn dầu thô của Mỹ, đang giao dịch quanh mức 70,60$ trong giờ giao dịch châu Á vào thứ Ba. Giá WTI tăng cao hơn giữa những rủi ro địa chính trị dai dẳng ở Trung Đông
Tác giả  FXStreet
Hôm qua 02: 12
West Texas Intermediate (WTI), chuẩn dầu thô của Mỹ, đang giao dịch quanh mức 70,60$ trong giờ giao dịch châu Á vào thứ Ba. Giá WTI tăng cao hơn giữa những rủi ro địa chính trị dai dẳng ở Trung Đông
placeholder
Dự báo giá vàng: XAU/USD tăng lên gần 3.450$ trong bối cảnh xung đột Israel-IranGiá vàng (XAU/USD) thu hút một số người mua gần 3.445$ trong phiên giao dịch đầu ngày thứ Hai ở châu Á. Kim loại quý tăng lên mức cao nhất trong hơn một tháng do căng thẳng gia tăng ở Trung Đông và đặt cược ngày càng tăng vào việc cắt giảm lãi suất của Cục Dự trữ Liên bang Mỹ (Fed)
Tác giả  FXStreet
6 tháng 16 ngày Thứ Hai
Giá vàng (XAU/USD) thu hút một số người mua gần 3.445$ trong phiên giao dịch đầu ngày thứ Hai ở châu Á. Kim loại quý tăng lên mức cao nhất trong hơn một tháng do căng thẳng gia tăng ở Trung Đông và đặt cược ngày càng tăng vào việc cắt giảm lãi suất của Cục Dự trữ Liên bang Mỹ (Fed)
placeholder
Top 3 DEX token đáng chú ý trong tuần thứ ba của tháng 06/2025Các token sàn giao dịch phi tập trung đang trở lại tâm điểm khi PancakeSwap (CAKE), Uniswap (UNI), và Cetus Protocol (CETUS) cho thấy hoạt động mạnh mẽ khi bước vào tuần thứ ba của tháng 06/2025. CAKE
Tác giả  BeInCrypto
6 tháng 13 ngày Thứ Sáu
Các token sàn giao dịch phi tập trung đang trở lại tâm điểm khi PancakeSwap (CAKE), Uniswap (UNI), và Cetus Protocol (CETUS) cho thấy hoạt động mạnh mẽ khi bước vào tuần thứ ba của tháng 06/2025. CAKE
placeholder
Dự báo giá AUD/JPY: Đạt mức cao nhất trong tháng, rút lui xuống dưới 94,00 khi tín hiệu giảm giá xuất hiệnAUD/JPY đã không vượt qua mức kháng cự 94,00 và giảm hơn 0,56% vào thứ Tư, sau mức cao nhất trong tháng là 94,73, sau tâm lý rủi ro lạc quan và báo cáo lạm phát của Mỹ yếu hơn dự kiến. Tại thời điểm viết bài, cặp tiền tệ này giao dịch gần 93,90, hầu như không thay đổi
Tác giả  FXStreet
6 tháng 12 ngày Thứ Năm
AUD/JPY đã không vượt qua mức kháng cự 94,00 và giảm hơn 0,56% vào thứ Tư, sau mức cao nhất trong tháng là 94,73, sau tâm lý rủi ro lạc quan và báo cáo lạm phát của Mỹ yếu hơn dự kiến. Tại thời điểm viết bài, cặp tiền tệ này giao dịch gần 93,90, hầu như không thay đổi
sản phẩm liên quan
goTop
quote