
Cardano Price Forecast: ADA eyes further losses amid triangle fallout
- Cardano risks a triangle breakdown as fear grips the ADA derivatives market.
- Input/Output plans a revised stake pool incentive scheme for smaller stake pool operators.
- The technical outlook shares a bearish Cardano viewpoint, targeting the $0.51 level.
Cardano (ADA) trades in the red by over 1% at press time on Tuesday, extending its losses from the previous day. Shrugging off the recent announcement of the revised stake pool incentive scheme by Input/Output firm, pressure mounts over Cardano, with optimism in ADA derivatives declining. Amid such conditions, the technical outlook warns of a steeper correction as a triangle pattern unfolds.
Input/Output announces revised incentive scheme
Input/Output Global announced on Monday an investigation to plan a smoother incentives program for smaller stake pools in the Cardano ecosystem. The decision comes to help smaller stake pool operators (SPOs), which struggle against larger multi-pool operations.

Overall, this marks an effort to boost ecosystem diversity and avoid centralization within larger stake pool operators. However, the fundamental step towards improving network diversity fails to boost bullish sentiment towards Cardano.
Bearish pressure grows in ADA derivatives
CoinGlass data shows a sudden plunge in Cardano’s Open Interest (OI) by 4.35% in the last 24 hours, reaching 742 million. The massive capital wipeout in OI signals a huge withdrawal by traders to avoid a volatility spike. It also relates to a push down in buying pressure.
The fear sparks among Cardano bulls as long liquidations over the last 24 hours surge to $1.66 million compared to just $233K in short liquidations. With the wipeout of massive bullish positions, the long/short ratio drops to 0.9384, signaling a surge in active bearish positions.
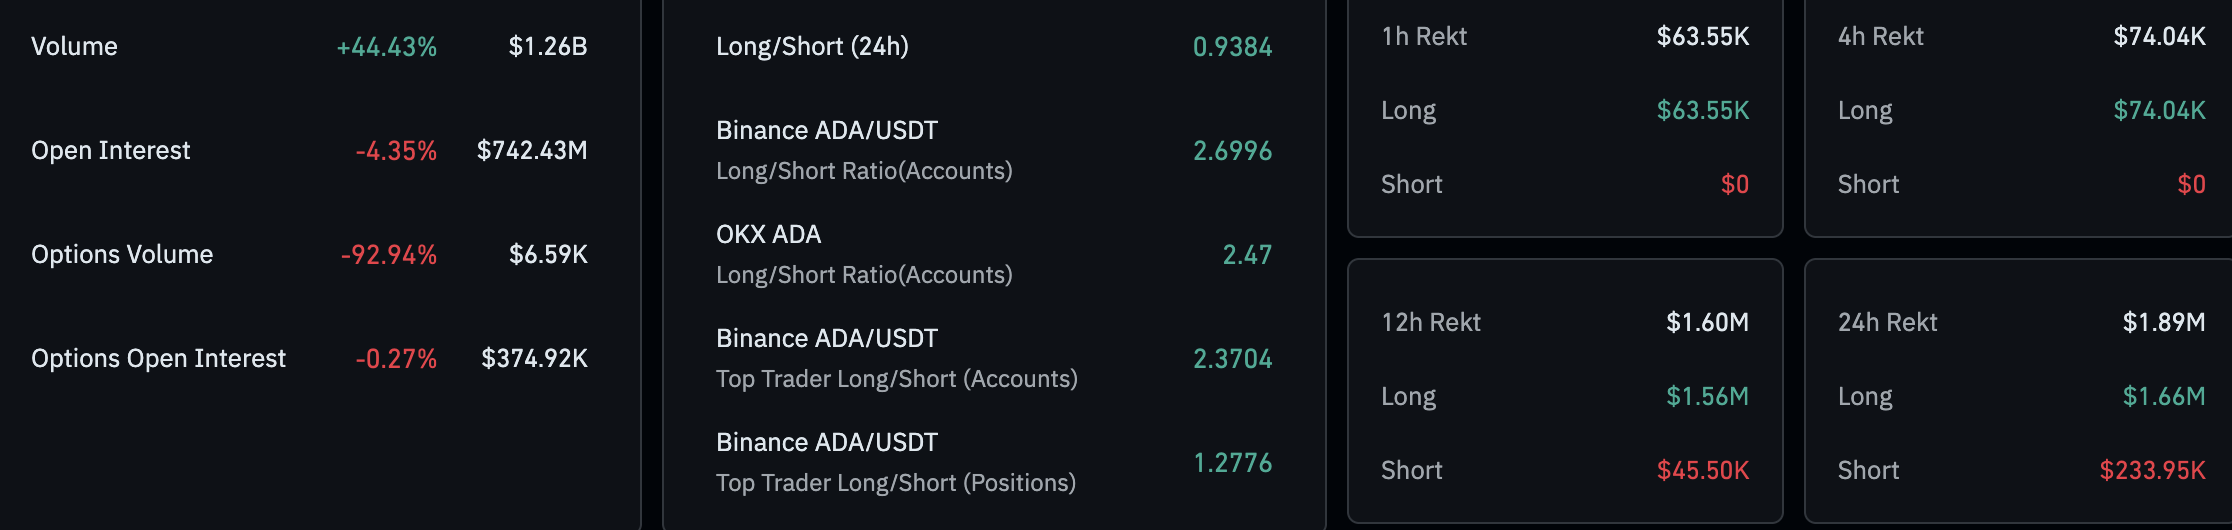
Cardano derivatives. Source: Coinglass
The overall data signals a bearish inclination in Cardano derivatives as traders' optimism weakens and bearish positions surge.
Cardano triangle fallout eyes $0.51
Cardano’s bearish turnaround from the 200-day Exponential Moving Average (EMA) at $0.7120 accounted for a 5.50% plunge last week. The downfall extends to over 1% so far this week, breaking below a support trendline formed by the November 5, April 9, and June 5 lows on the daily chart.
With the trendline breakdown, Cardaono marks the triangle pattern fallout formed by a converging trendline extrapolated from March 3, May 12, and May 23 peaks. The immediate support for Cardano lies at $0.5946, the April 16 low, followed by the year-to-date low at $0.5110.
The Moving Average Convergence/Divergence (MACD) indicator displays a declining trend in the daily chart, with the signal line indicating a bearish trend on the rise. Further up, the Relative Strength Index (RSI) at 36 declines towards the oversold zone, suggesting a surge in bearish momentum.
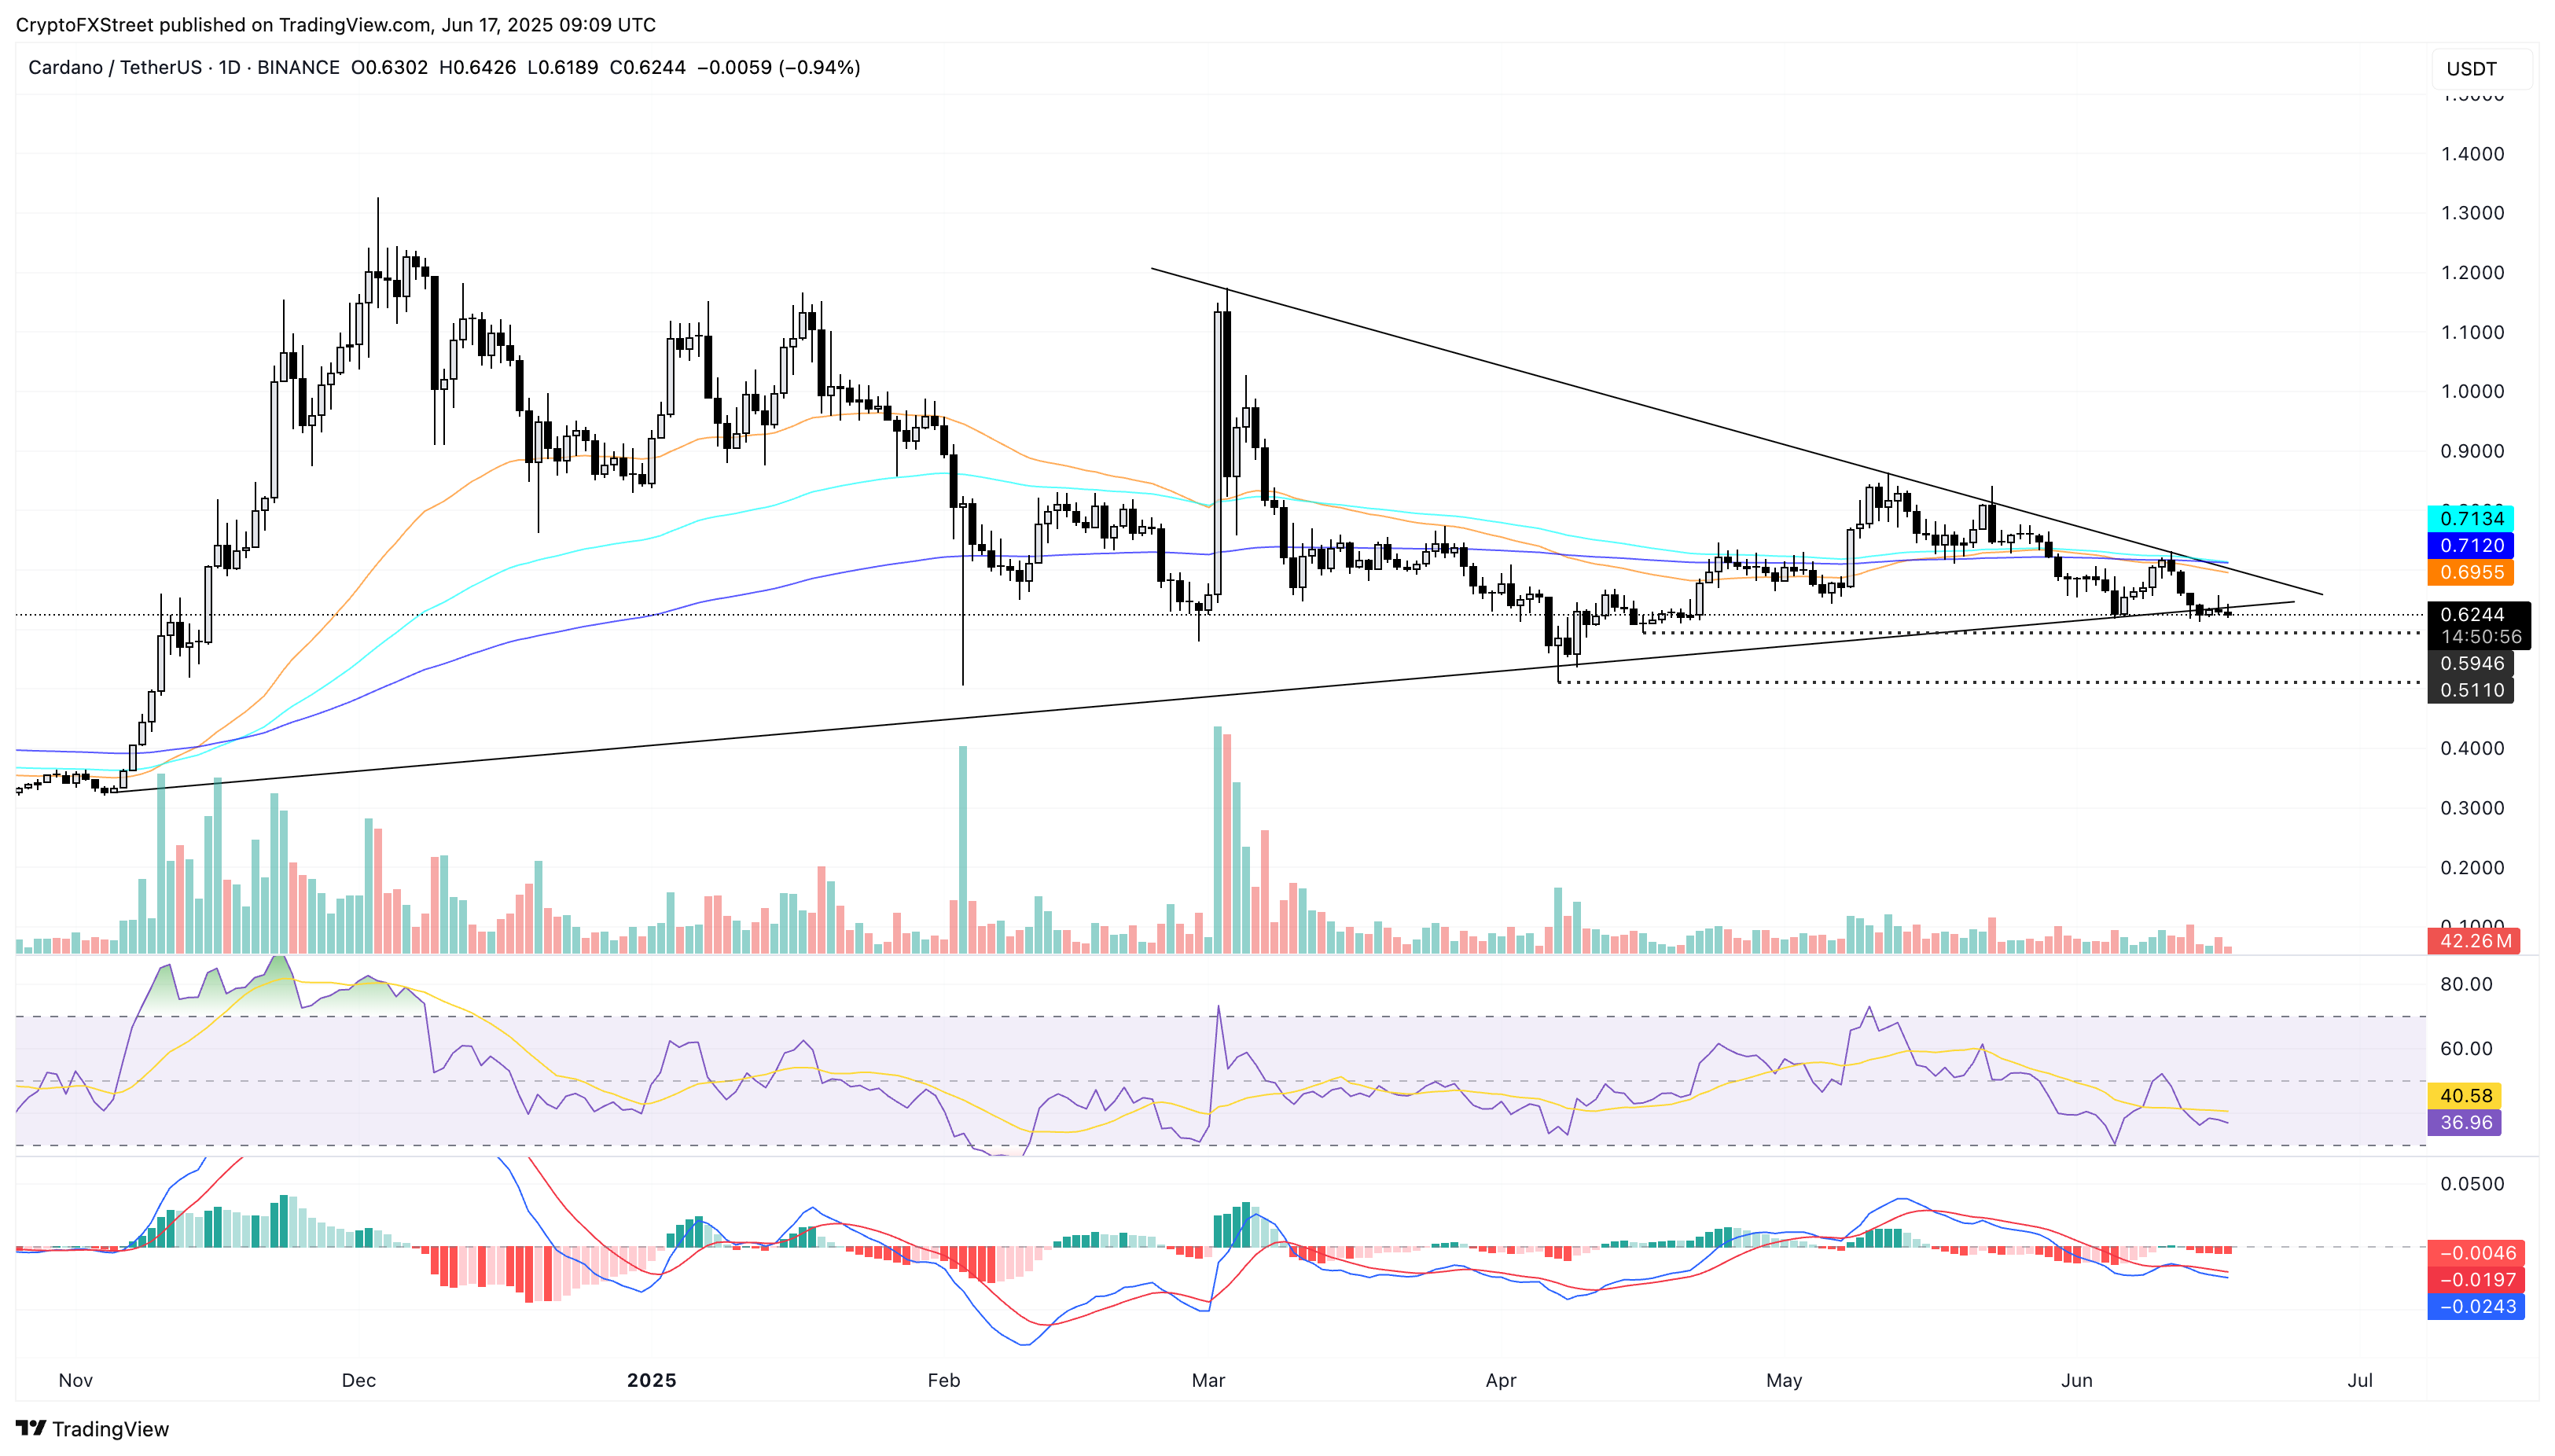
ADA/USDT daily price chart.
If ADA marks an intraday recovery to avoid a bearish closing, a reversal above the weekly high at $0.6575 could prolong its uptrend, propelling Cardano towards the 50-day EMA at $0.6955.
Bài viết đề xuất


