Crypto Today: Negative spot ETF flows break 10-day inflow streak as BTC, ETH, XRP extend losses
- Bitcoin strongly falls below $106,000 support as renewed tariff fears rattle markets.
- Bitcoin spot ETF flows flip negative after ten consecutive days of inflows.
- Bitcoin's current bull market exhibits significantly lower volatility compared to previous cycles, with a 50% average realized volatility.
- Ethereum holds steadily above $2,600 short-term support while XRP shows multiple sell signals.
The cryptocurrency market faces intensifying headwinds on Friday as markets digest the uncertainty surrounding tariffs in the United States (US). Bitcoin (BTC) is extending losses below $106,000 while major altcoins, including Ethereum (ETH) and Ripple (XRP), test critical support areas.
Market overview: Macroeconomic risks surge as US tariff tune changes
Sharp pullbacks characterize trading in the cryptocurrency market on Friday after a federal court of appeals stayed the ruling that had nullified President Donald Trump's tariffs on Wednesday at the request of the Justice Department.
The ruling by the Court of International Trade said that the US Constitution grants Congress exclusive power to regulate trade with other countries and that this authority cannot be overridden by the President's emergency powers to safeguard the economy.
However, the Trump administration called the ruling a "judicial overreach," according to The Washington Post. Global markets clawed back the gains accrued on Thursday amid growing uncertainty over the US tariff policy.
Volatility in the cryptocurrency market could persist into the weekend, depending on how investors react to the Personal Consumption Expenditures (PCE) Price Index inflation data, which is expected later on Friday.
The PCE price index is known for reflecting inflation across a wide range of consumer expenses and for reflecting changes in consumer behavior. Market participants use the PCE price index data as a cue for the direction the Federal Reserve (Fed) will take in the future, especially as the interest rate cut window narrows.
Data spotlight: Bitcoin spot ETFs post outflows for the first time in 10 days
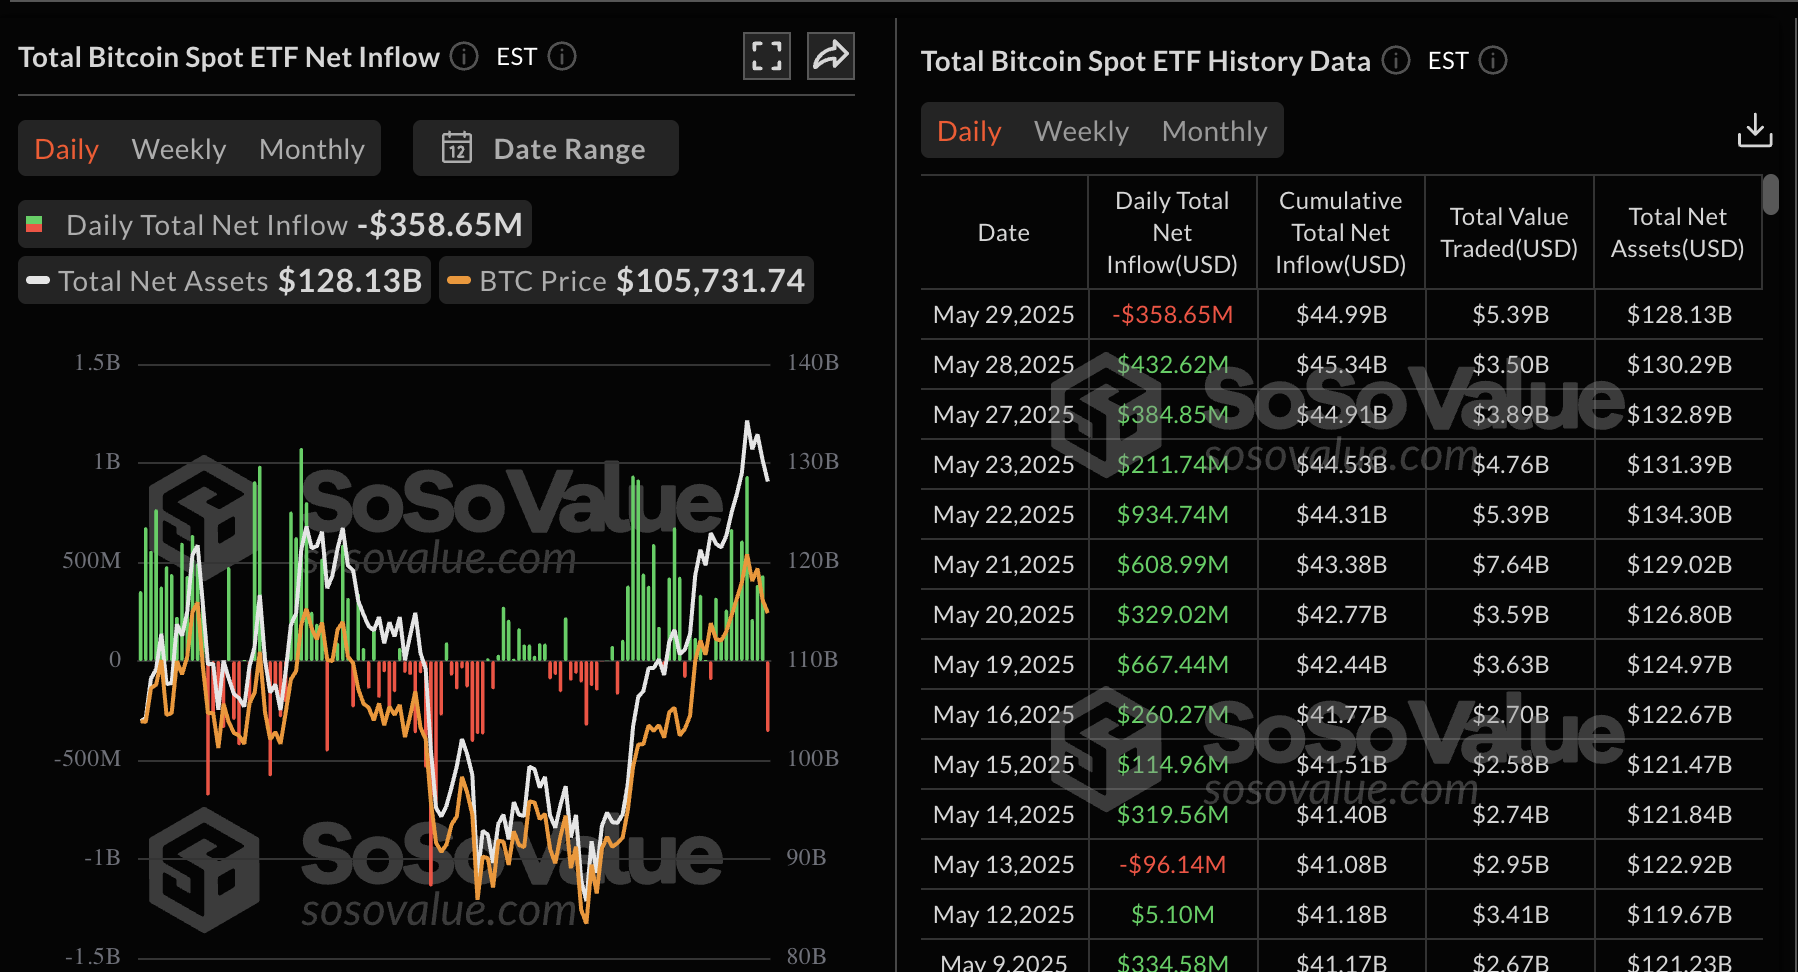
The rally to a new all-time high of $111,980 was majorly driven by institutional risk-on sentiment, with spot Bitcoin Exchange Traded Funds (ETFs) recording inflows for ten straight days from May 14 to May 28. Demand from institutions building Bitcoin treasuries, such as Strategy and Metaplanet, also contributed to the rally.
However, SoSOValue data shows outflows of $359 million on Thursday, breaking the ten-day trend of inflows. This reflects changing dynamics in the broader market, especially with US tariffs and geopolitical tensions in Europe and the Middle East.

Bitcoin spot ETF outflow volume | Source: SoSoValue
Meanwhile, the current Bitcoin bull market shows significantly lower volatility compared to previous cycles. According to Glassnode data reported by CoinDesk, realized volatility is averaging below 50% on a three-month rolling basis, significantly lower than the 80% to 100% range observed during previous bull runs.
Bitcoin's stability largely stems from its swelling market capitalization and increased institutional interest, backed by ETFs and derivatives offerings.
"Additionally, the launch of the US Spot ETF Products, supplemented by increasing regulatory clarity, has altered the underlying composition of the investor base, allowing sophisticated, institutional investors and capital to gain exposure to bitcoin for the first time," Glassnode states in a recent report.
Chart of the day: Bitcoin tumbles below key support
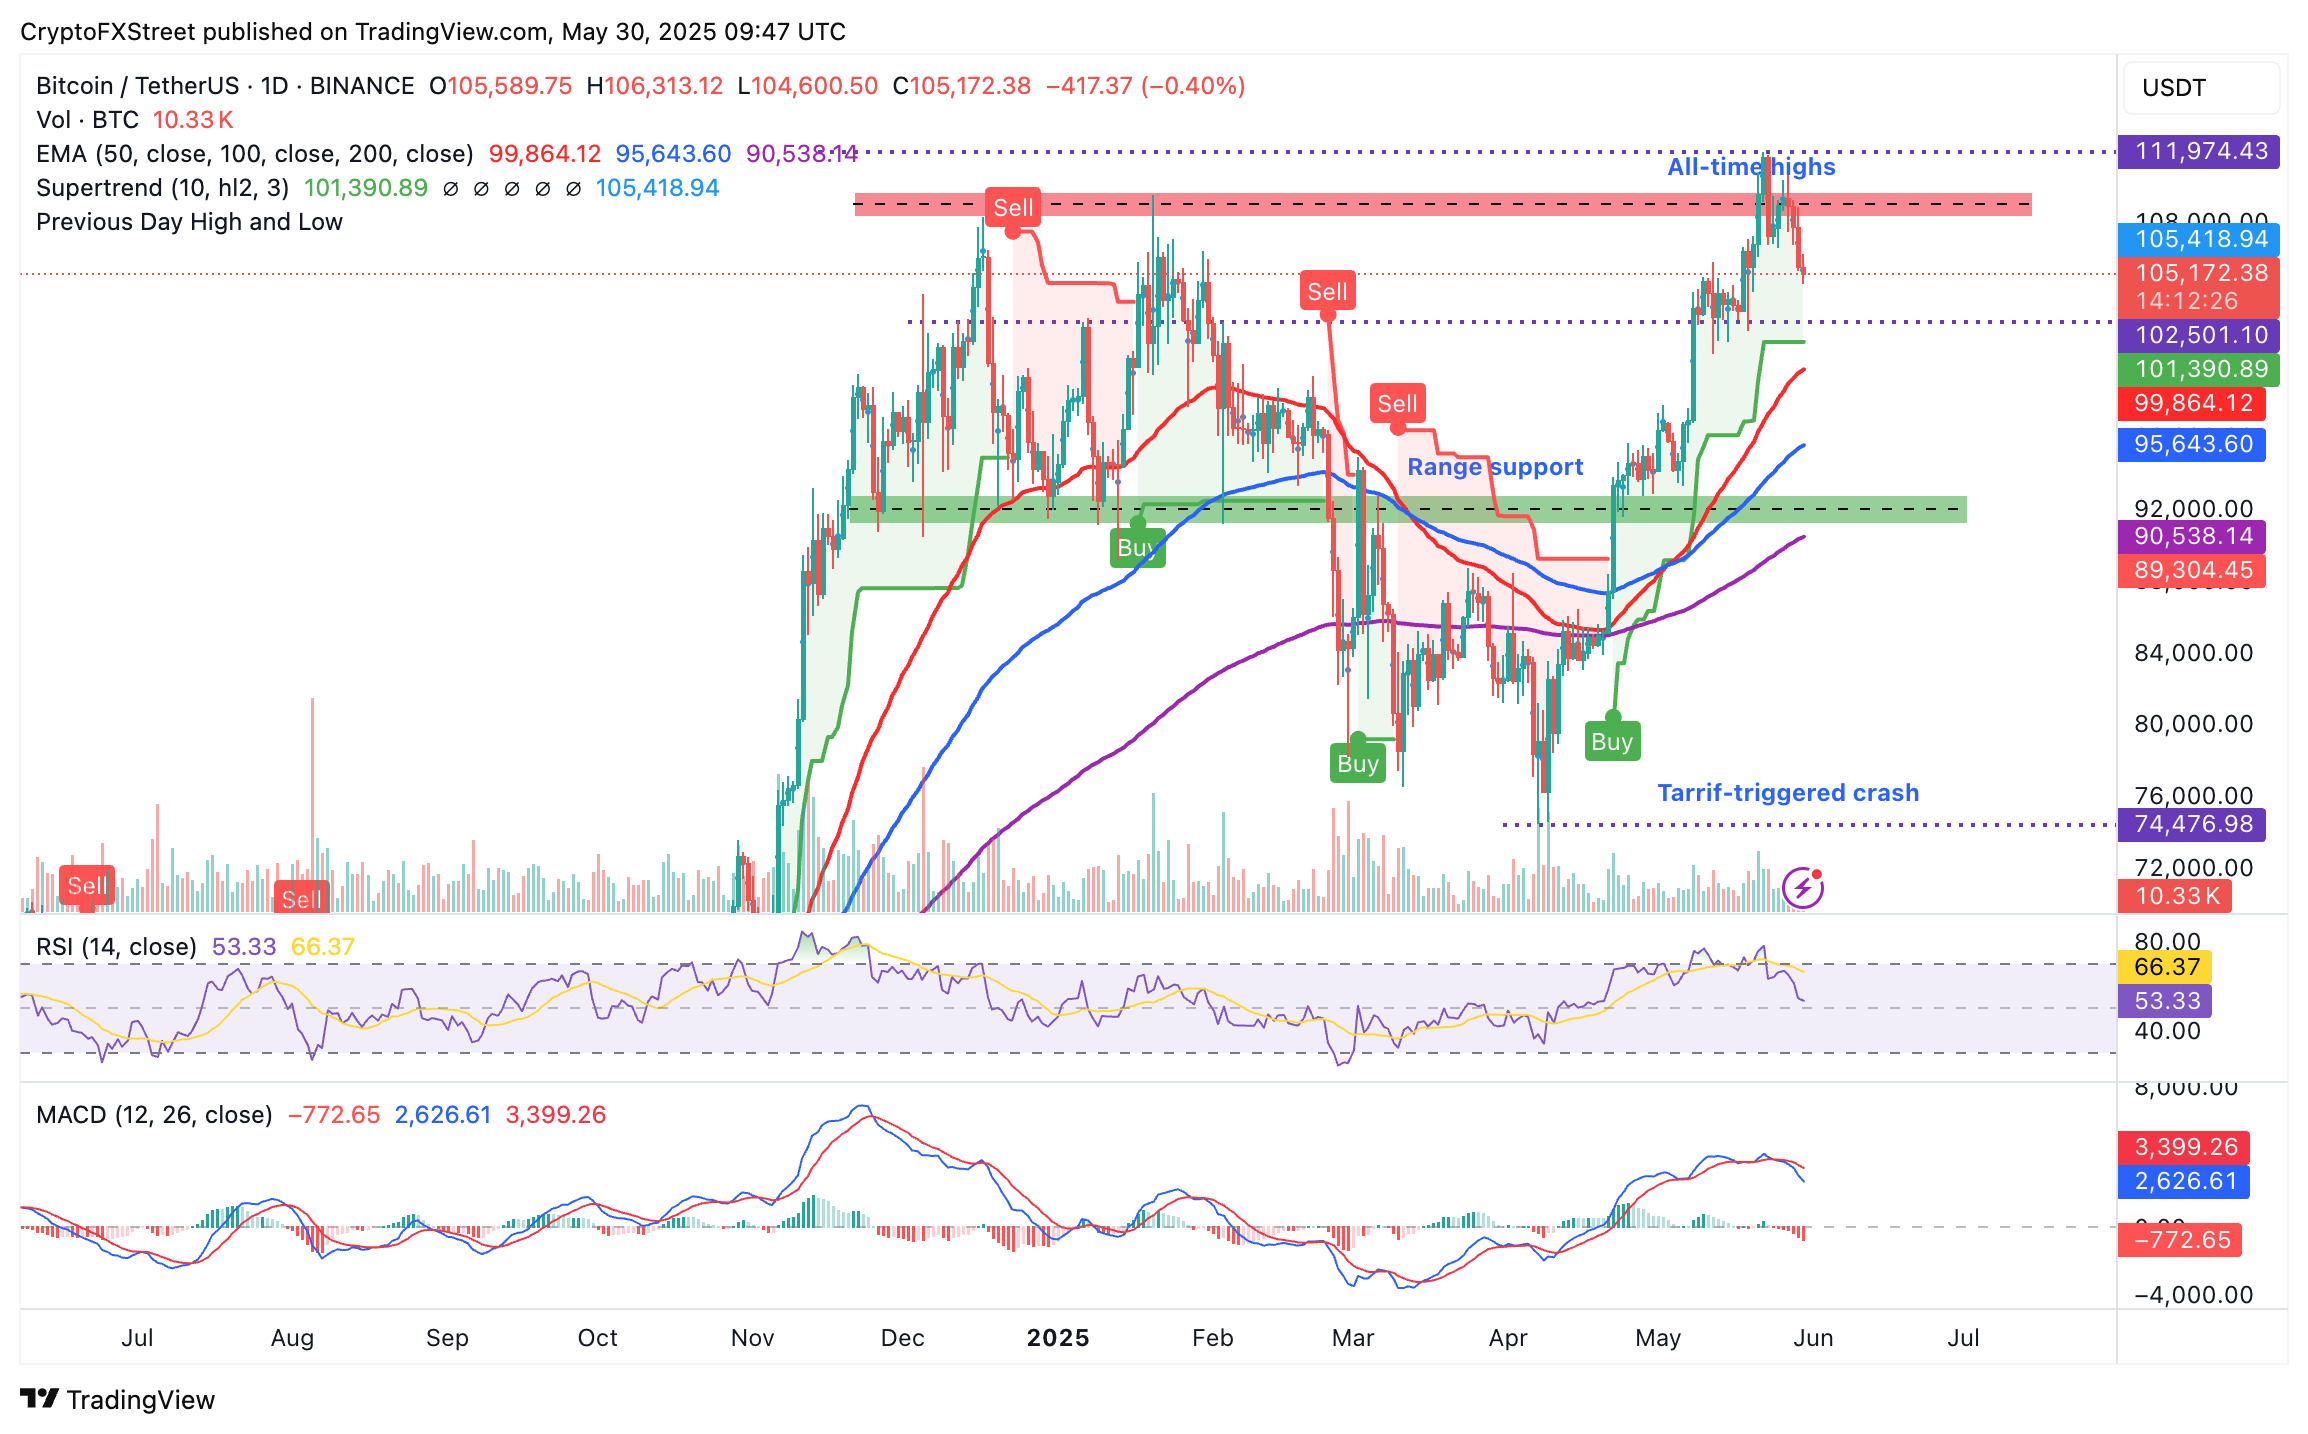
Bitcoin's price is extending losses strongly below $106,000 at the time of writing, reflecting increasing sell-side pressure. Key technical indicators, such as the Moving Average Convergence Divergence (MACD), reflect the new bearish outlook.
As the MACD indicator drops toward the center line (0.00) after validating a sell signal on May 25, when the blue MACD line crossed below the red signal line, traders are encouraged to sell BTC, contributing to the largest sell-off since Bitcoin hit new all-time highs on May 22.
The Relative Strength Index (RSI) downtrend from recent overbought levels, as it approaches the 50 midline, cements the increasing bearish influence in the market. Key areas of interest in upcoming sessions include the short-term support at $105,000 and the area around $102,500, which was tested as support in mid-May and resistance in early January.

BTC/USDT daily chart
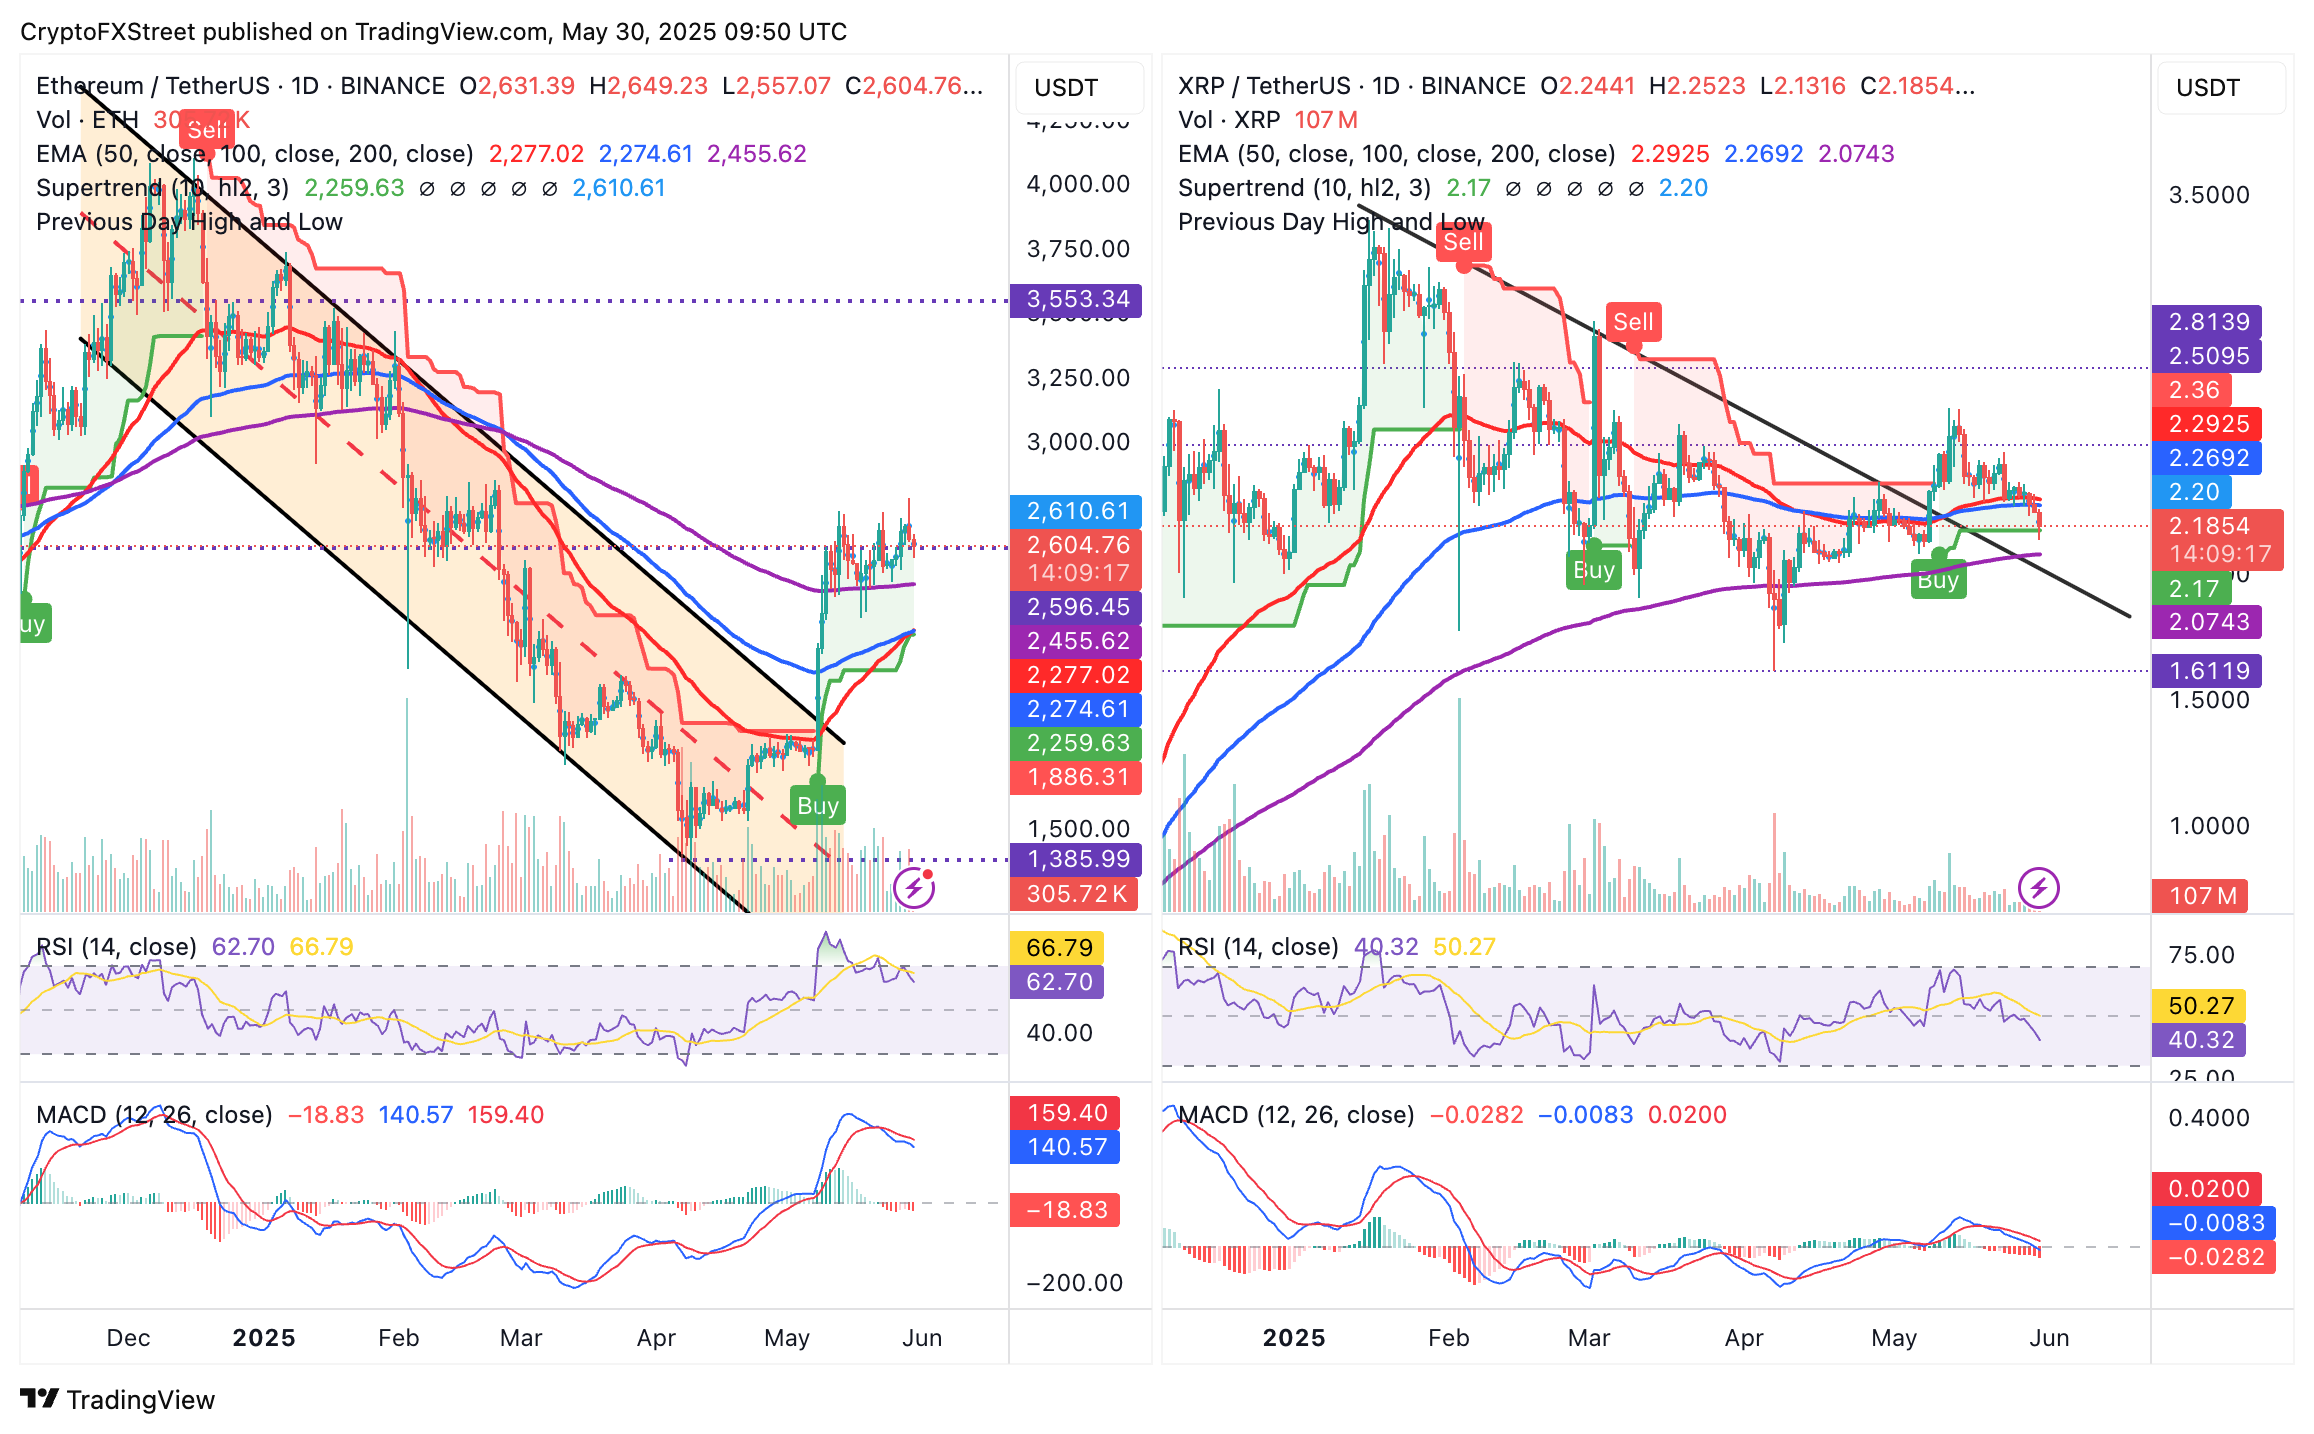
On the other hand, altcoins have been overshadowed by increasing selling pressure, which could threaten the gains accrued in May and, by extension, those from the tariff-triggered crash in April. Ethereum is testing support at $2,600, currently hovering around $2,605 at the time of writing.
The MACD and the RSI indicators are sloping downwards, respectively, as shown on the daily chart below. Suppose this technical outlook remains unchanged and the MACD indicator approaches the zero line (0.00) while maintaining a sell signal confirmed on May 22. In that case, the path of least resistance will continue downward heading into the weekend. The RSI at 62, after falling from the overbought region, signals fading bullish momentum. Key areas of interest include the 200-day Exponential Moving Average (EMA) at $2,445 and the 50-day EMA at $2,277.

ETH/USDT & XRP/USDT daily charts
XRP has not been spared amid losses of over 2% on the day. The cross-border money remittance token is trading at $2.19 at the time of writing after losing two critical support levels: the 50-day EMA, currently at $2.29, and the 100-day EMA, which is holding at $2.26.
The next area of interest, especially for traders focusing on the dips, is the 200-day EMA at $2.07. Beyond this level, declines could accelerate, bringing into focus the April 7 low at $1.61 and the liquidity-rich region at $1.00.
Cryptocurrency metrics FAQs
The developer or creator of each cryptocurrency decides on the total number of tokens that can be minted or issued. Only a certain number of these assets can be minted by mining, staking or other mechanisms. This is defined by the algorithm of the underlying blockchain technology. On the other hand, circulating supply can also be decreased via actions such as burning tokens, or mistakenly sending assets to addresses of other incompatible blockchains.
Market capitalization is the result of multiplying the circulating supply of a certain asset by the asset’s current market value.
Trading volume refers to the total number of tokens for a specific asset that has been transacted or exchanged between buyers and sellers within set trading hours, for example, 24 hours. It is used to gauge market sentiment, this metric combines all volumes on centralized exchanges and decentralized exchanges. Increasing trading volume often denotes the demand for a certain asset as more people are buying and selling the cryptocurrency.
Funding rates are a concept designed to encourage traders to take positions and ensure perpetual contract prices match spot markets. It defines a mechanism by exchanges to ensure that future prices and index prices periodic payments regularly converge. When the funding rate is positive, the price of the perpetual contract is higher than the mark price. This means traders who are bullish and have opened long positions pay traders who are in short positions. On the other hand, a negative funding rate means perpetual prices are below the mark price, and hence traders with short positions pay traders who have opened long positions.


